Download to read offline


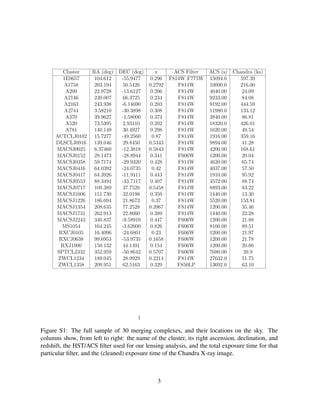
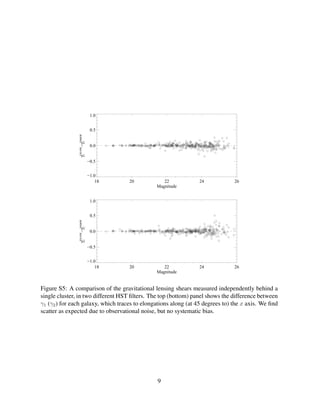
![Observed offset between various components of substructure [kpc]
-200 -100 0 100 200 300 400
20B
15A
δ
(galaxies-gas)
δ
(galaxies-dark matter)
δ
(gas-dark matter)
GI
SI
GI
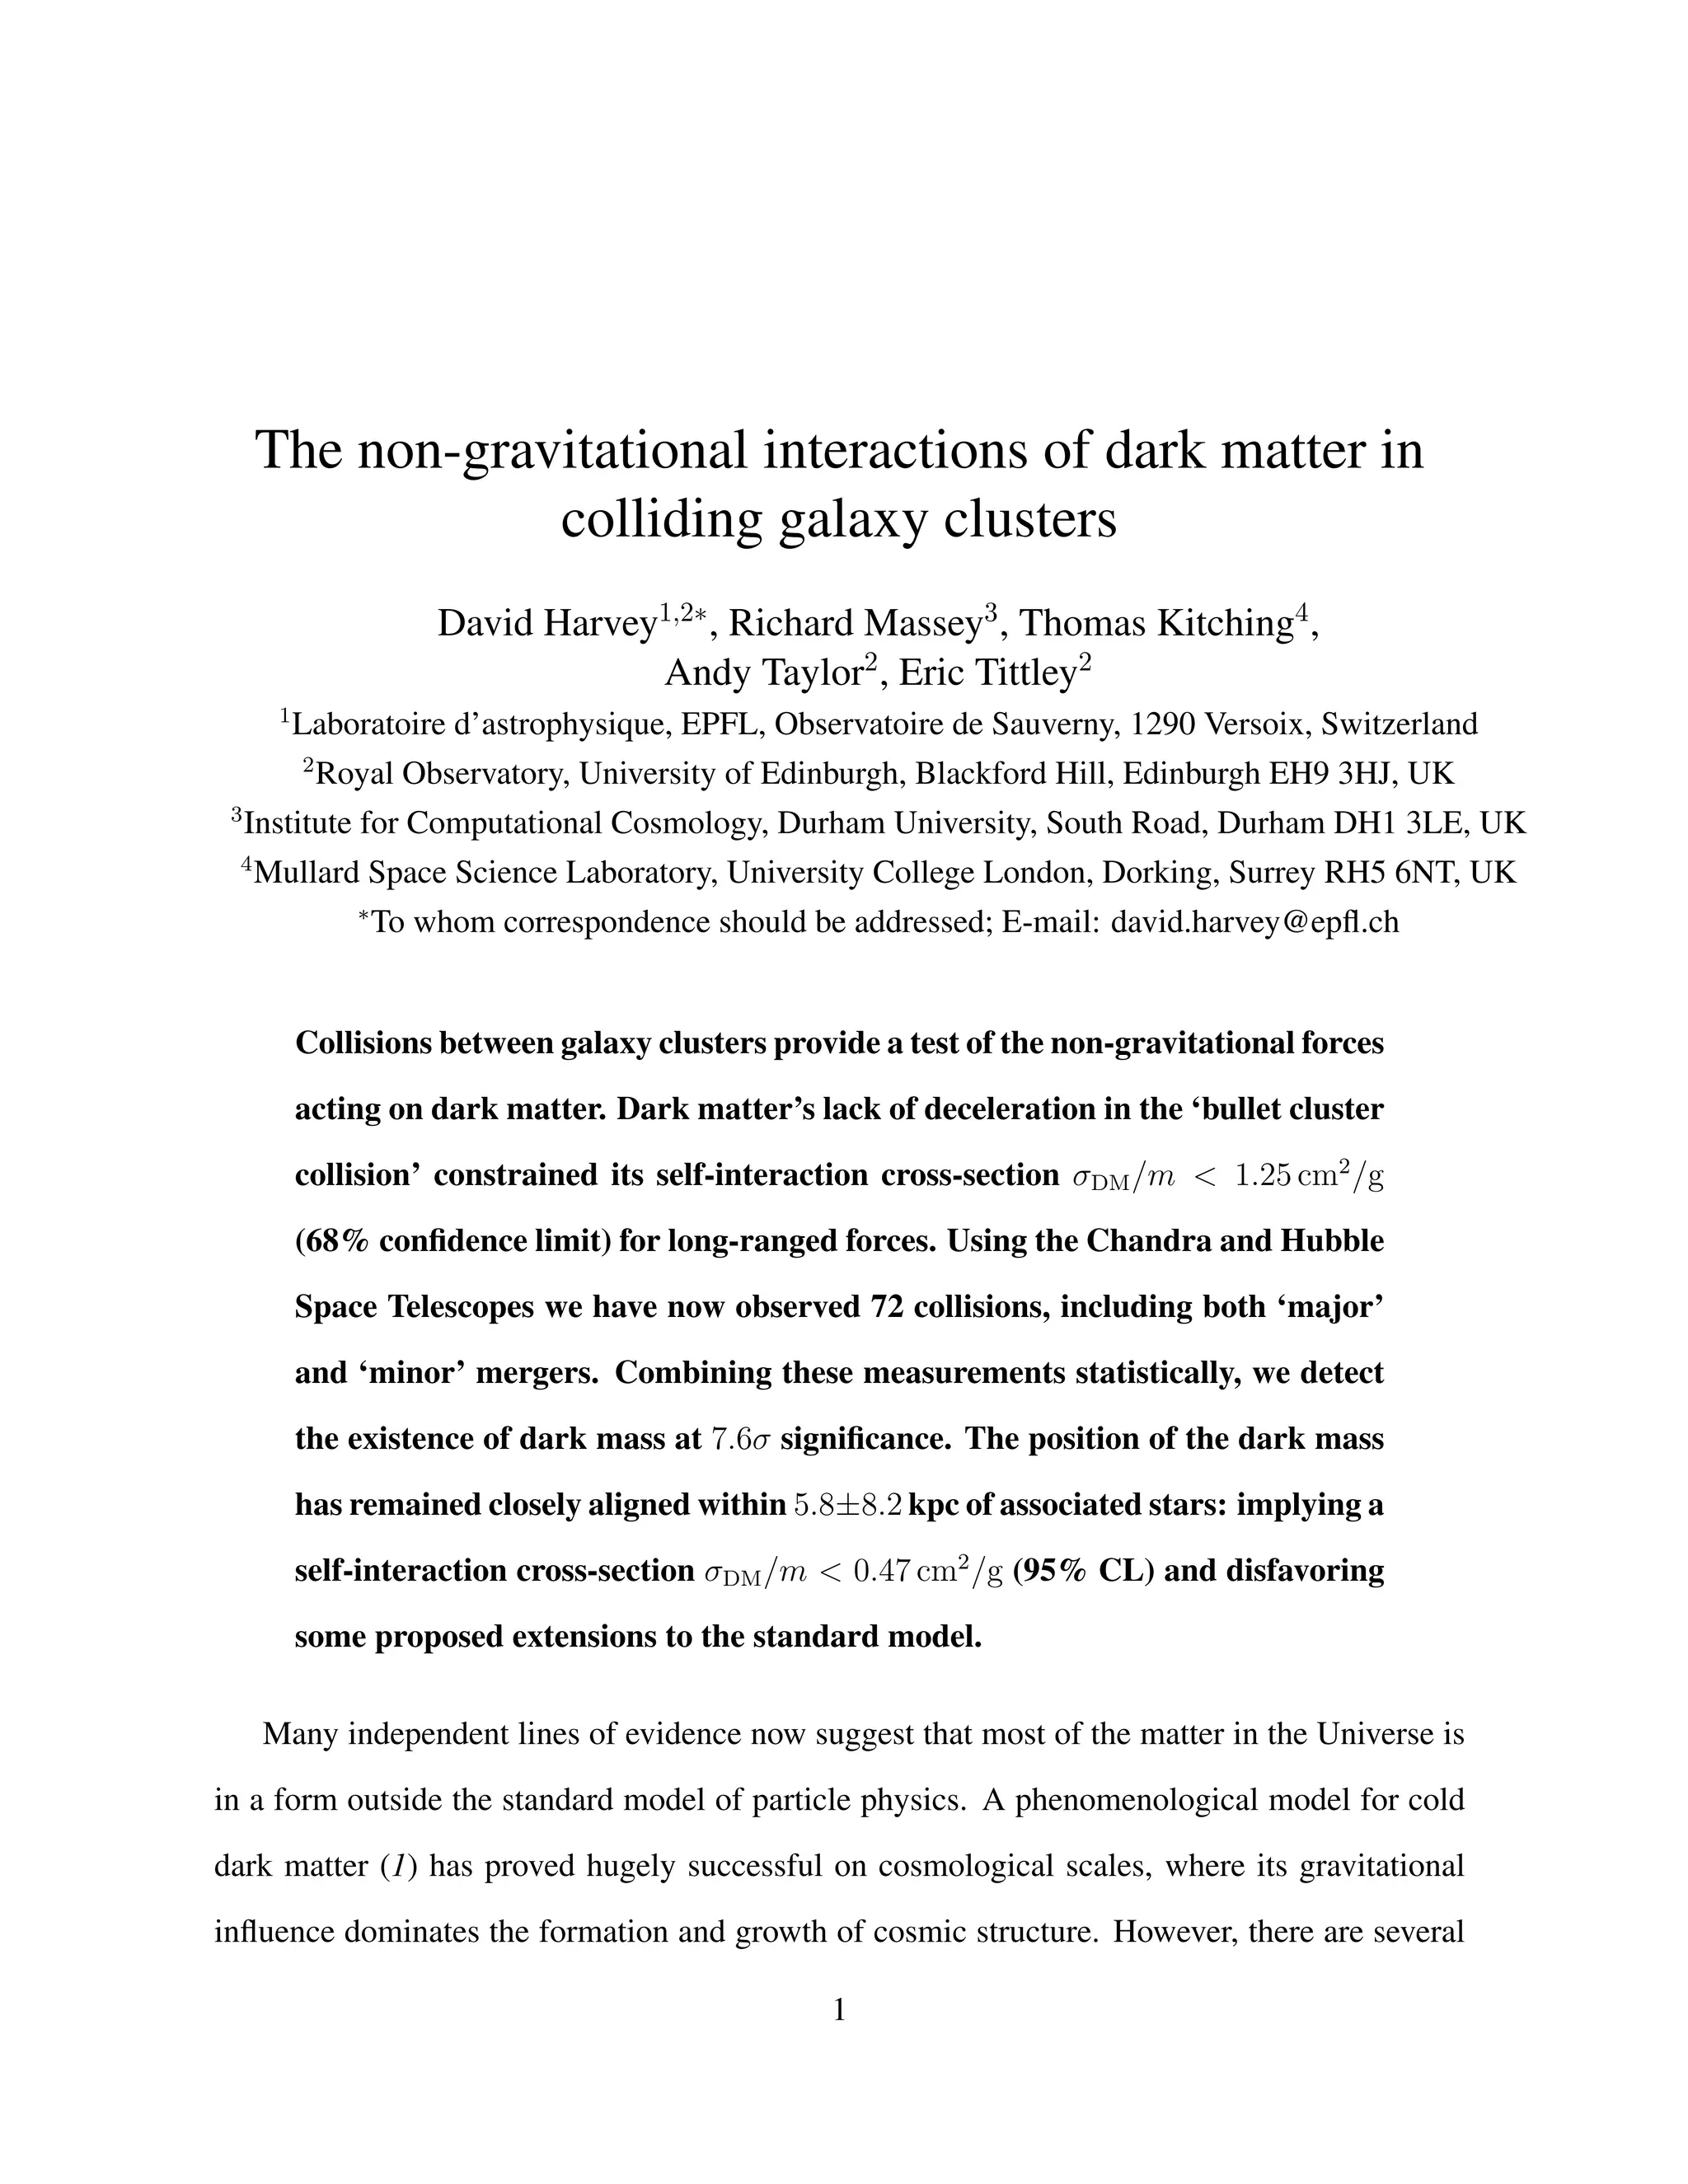
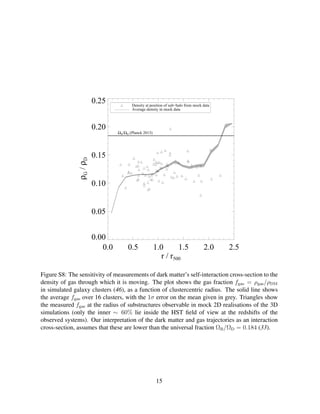
Figure 3: Observed offsets between the three components of 72 pieces of substructure. Offsets
δSI and δGI include corrections accounting for the fact that gravitational lensing measures the
total mass, not just that of dark matter. (A) The observed offset between gas and mass, in the
direction of motion. The smooth curve shows the distribution expected if dark matter does not
exist; this hypothesis is inconsistent with the data at 7.6σ statistical significance. (B) Observed
offsets from galaxies to other components. The fractional offset of dark matter towards the gas,
δSI/δSG, is used to measure the drag force acting on the dark matter.
9](https://image.slidesharecdn.com/thenongravitationalinteractionsofdarkmatterincollidinggalaxyclusters-150326215132-conversion-gate01/85/The-non-gravitational_interactions_of_dark_matter_in_colliding_galaxy_clusters-9-320.jpg)
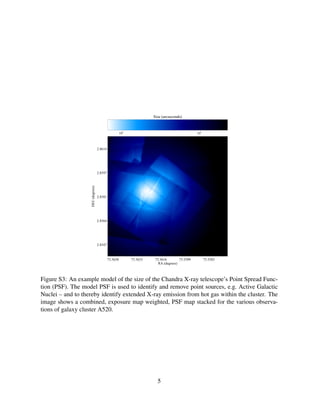
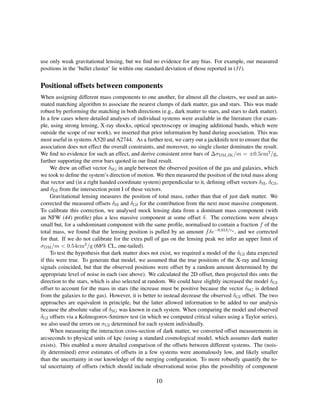
![Posteriorprobability(linearscale)
Dark matter self-interaction cross section, [cm /g]2σDM
-2 -1 0 1 2 3 4
(Bulletcluster)
bulletcluster
(Babybullet)
(Pandora’scluster)
1E0657-558
Masslossin
MACSJ0025
Abell2744
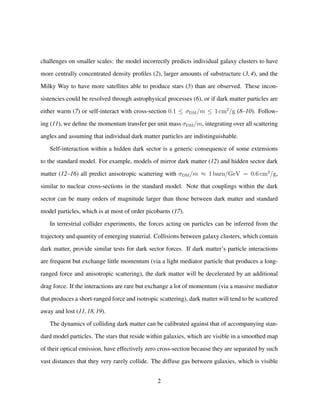
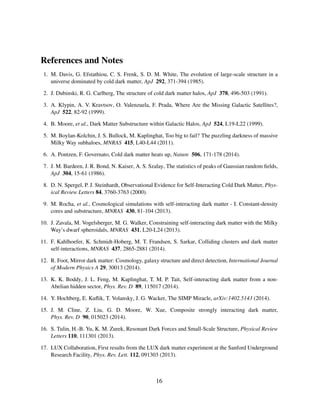
Figure 4: Constraints on the self-interaction cross-section of dark matter. These are derived
from the separations β = δSI/δSG, assuming a dynamical model to compare the forces acting
on dark matter and standard model particles (28). The hatched region denotes 68% confidence
limits, to be compared to the 68% confidence upper limits from previous studies of the most
constraining individual clusters in blue. Note that the tightest previous constraint is derived
from a measurement of dark matter mass loss, which is sensitive to short range self-interaction
forces; all other constraints are measurements of a drag force acting on dark matter, caused by
long range self-interactions.
10](https://image.slidesharecdn.com/thenongravitationalinteractionsofdarkmatterincollidinggalaxyclusters-150326215132-conversion-gate01/85/The-non-gravitational_interactions_of_dark_matter_in_colliding_galaxy_clusters-10-320.jpg)
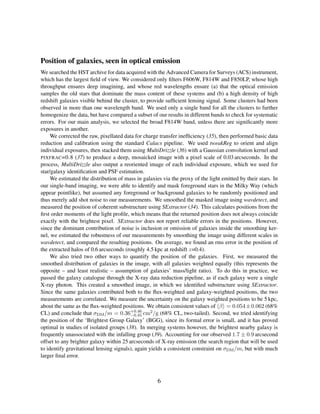
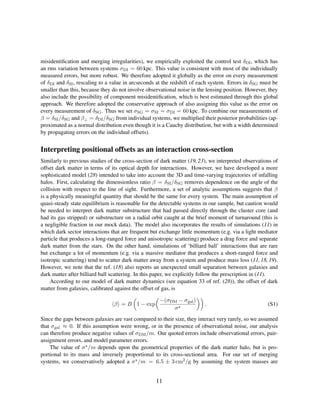
![−300 −200 −100 0 100 200 300
Offset [kpc]
ZWCL1358
ZWCL1234
SPTCL2332
RXJ1000
RXCJ0638
RXCJ0105
MS1054
MACSJ2243
MACSJ1731
MACSJ1354
MACSJ1226
MACSJ1006
MACSJ0717
MACSJ0553
MACSJ0417
MACSJ0416
MACSJ0358
MACSJ0152
MACSJ0025
DLSCLJ0916
ACTCLJ0102
A781
A520
A370
A2744
A2163
A2146
A209
A1758
1E0657
Figure S2: Observed offsets between galaxies, gas and dark matter in 72 components of sub-
structure. In each case, the green triangle, at the centre of the coordinate system, denotes the
position of the galaxies. The separation between galaxies and gas, δSG, is shown in red. The
separation of the dark matter with respect to the galaxies, projected onto the SG vector, δSI, is
shown in blue. The error bars show the locally estimated 1σ errors.
4](https://image.slidesharecdn.com/thenongravitationalinteractionsofdarkmatterincollidinggalaxyclusters-150326215132-conversion-gate01/85/The-non-gravitational_interactions_of_dark_matter_in_colliding_galaxy_clusters-15-320.jpg)
![0 2000 4000 6000 8000 10000
X [PIXELS]
0
2000
4000
6000
8000
10000
Y[PIXELS]
Ellipticity = 0.01
Figure S4: An example model of the Point Spread Function (PSF) of the Hubble Space Tele-
scope/Advanced Camera for Surveys (HST/ACS). Each tick mark represents the ellipticity of
the PSF at that particular position in the HST field. Its orientation shows the PSF’s major axis
and its length shows the ellipticity; a dot would indicate a circular PSF. The PSF tends to be
highly elliptical near the edge of the field and more circular in the centre. Tick marks are plot-
ted at the position of every “detected” source. The mosaic pattern of dithered exposures can be
seen: noisier regions with fewer exposures contain more spurious sources, which are removed
during analysis (but are shown here for clarity). The example shown is for observations of
galaxy cluster MACSJ0416.
8](https://image.slidesharecdn.com/thenongravitationalinteractionsofdarkmatterincollidinggalaxyclusters-150326215132-conversion-gate01/85/The-non-gravitational_interactions_of_dark_matter_in_colliding_galaxy_clusters-19-320.jpg)
![−2 −1 0 1 2 3 4
σDM/m [ cm2
/g ]
0.000
0.005
0.010
0.015
p(σDM/m)
σ*/m=9.5cm2
/g
σ*/m=7.9cm2
/g
σ*/m=6.5cm2
/g
σ*/m=5.4cm2
/g
σ*/m=4.4cm2
/g
1013
1014
1015
MH [ MSUN ]
4
5
6
7
8
9
10
σ*/m[cm2
/g]
82 104 133 169 214 272 346 440 559
Size [ kpc ]
Figure S6: The sensitivity of measurements of dark matter’s self-interaction cross-section to the
model parameter σ /m. This parameter is the characteristic value of cross-section at which an
appropriately-sized cloud of standard model particles becomes optically thick. The top panel
shows the value of σ /m for different various substructure masses, assuming an NFW mass pro-
file and a mass-concentration relation from cosmological simulations (45). The bottom panel
demonstrates how a few of those values affect our measurement of the cross-section. The re-
sulting variation is sub-dominant to statistical error in our sample of clusters. We adopted a
value of σ /m = 6.5 ± 3 cm2
/g, corresponding to dark matter halos of M = 1014±1
M , and
propagated the uncertainty through to our final constraints.
13](https://image.slidesharecdn.com/thenongravitationalinteractionsofdarkmatterincollidinggalaxyclusters-150326215132-conversion-gate01/85/The-non-gravitational_interactions_of_dark_matter_in_colliding_galaxy_clusters-24-320.jpg)
![−2 −1 0 1 2 3 4
0.000
0.002
0.004
0.006
0.008
0.010
0.012
0.014
−2 −1 0 1 2 3 4
σDM/m [ cm2
/g]
0.000
0.002
0.004
0.006
0.008
0.010
0.012
0.014
p(σDM/m)
Total Sample
Cold Gas
Hot Gas
Figure S7: The sensitivity of measurements of dark matter’s self-interaction cross-section to
the temperature of the gas against which dark matter’s trajectory is calibrated. We measured
the gas temperature from the X-ray spectra of our 72 systems, and split the sample in two: blue
data show substructures with gas temperature < 8 keV, and red data show substructures with
gas temperature > 8 keV. The constraining power of each sample is approximately
√
2 less than
that of the full sample, shown in grey, and no statistically significant difference is measured.
14](https://image.slidesharecdn.com/thenongravitationalinteractionsofdarkmatterincollidinggalaxyclusters-150326215132-conversion-gate01/85/The-non-gravitational_interactions_of_dark_matter_in_colliding_galaxy_clusters-25-320.jpg)


1) The document analyzes 72 galaxy cluster collisions observed with Hubble and Chandra telescopes to test theories of non-gravitational dark matter interactions. 2) It detects the existence of dark matter at 7.6 sigma significance by comparing the positions of dark mass concentrations to stars and gas. 3) Combining measurements from all collisions, it constrains the dark matter self-interaction cross-section to be less than 0.47 cm^2/g (95% confidence level), ruling out some proposed dark matter models with stronger interactions.


![谷歌留痕技术 [ 𝙩𝙤𝙥 𝟮𝟯𝟯. 𝙘 𝙤𝙢 ]](https://cdn.slidesharecdn.com/ss_thumbnails/top233-260130174328-3833018c-thumbnail.jpg?width=640&height=640&fit=bounds)


