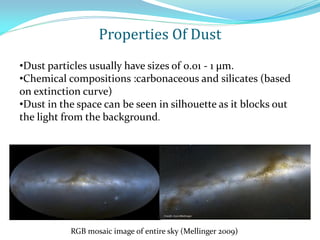
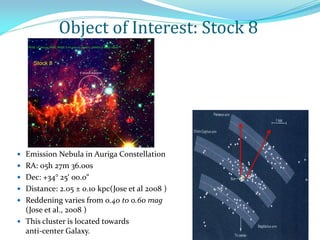
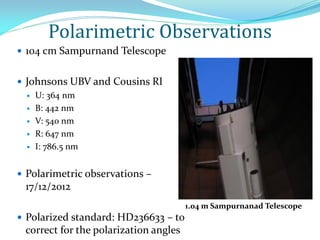
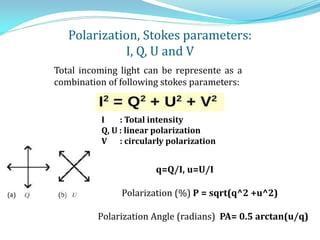
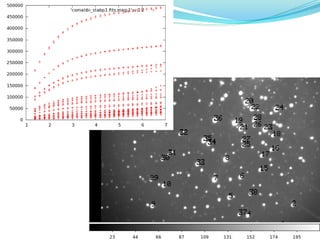
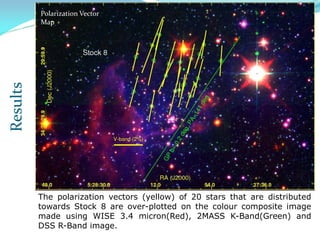
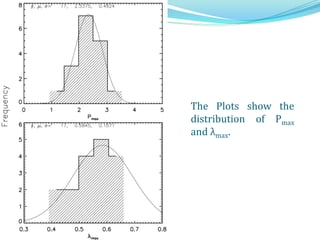
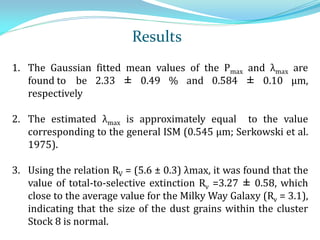
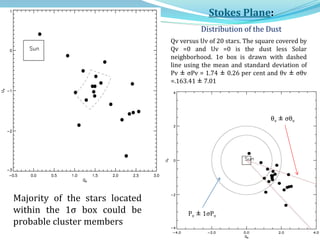
Group 4 studied the properties of dust and magnetic fields in the star cluster Stock 8 using multiband polarimetry observations. Their aims were to characterize dust properties from the polarization data, identify probable cluster members using the Stokes plane, and map the magnetic field structure. They observed 20 stars in Stock 8 in UBVRI bands and analyzed the data to determine the polarization, Stokes parameters, peak polarization Pmax, and wavelength of maximum polarization λmax. They found average values of Pmax = 2.33% and λmax = 0.584 μm, consistent with typical interstellar dust. Polarization vectors were overlaid on images and aligned with the Galactic plane, and the Stokes plane helped identify stars likely belonging to the cluster

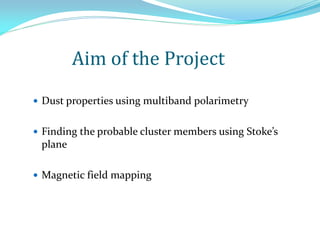
![• The space between stars is not perfect vacuum:
filled with gas (ions, atoms and molecules) and dust
termed as ISM, which makes 10% of the visible mass
in the Milky-Way.
• ISM components : Gas 99% of ISM [90%H, 10%He,
0.1% Metals], Dust ~1%.
• The presence of ISM Dust can be studied by
observing the Extinction, Polarizations and dust
emission.
Inter Stellar Medium (ISM)](https://image.slidesharecdn.com/polarimetryatsoa-140322072107-phpapp02/85/Polarimetric-Study-of-emission-nebulea-Stock-8-in-Auriga-4-320.jpg)

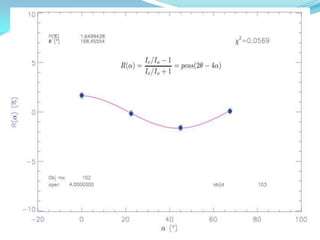
![To find P (polarization) and position angle:
R() {q, u, q1, u1} at => 0, 22.5, 45, 67.5 degree
FLAT FIELDING:
(Ramaprakash et al. 1998 & Medhi et al 2007, 2010, Eswaraiah et al. 2011, 2012)
σ R(α) {σ q , σ u , σq1 and σu1}
σR(α) = [(Ne + No + 2Nb )/(Ne + No )]^(1/2), (Ramaprakash et al. 1998)
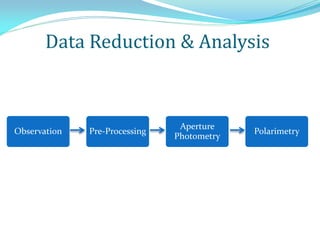
Data Reduction & Analysis](https://image.slidesharecdn.com/polarimetryatsoa-140322072107-phpapp02/85/Polarimetric-Study-of-emission-nebulea-Stock-8-in-Auriga-19-320.jpg)
![Fit using Serkowski law:- P/Pmax = exp[-K * ln2 (λmax/ λ)]
K = 1.66 λmax ( Whittet, 1992)](https://image.slidesharecdn.com/polarimetryatsoa-140322072107-phpapp02/85/Polarimetric-Study-of-emission-nebulea-Stock-8-in-Auriga-21-320.jpg)


![[APS2020] Phonon-limited carrier mobilityin semiconductors : importance ofthe...](https://cdn.slidesharecdn.com/ss_thumbnails/2020t096aps-200306114830-thumbnail.jpg?width=640&height=640&fit=bounds)


