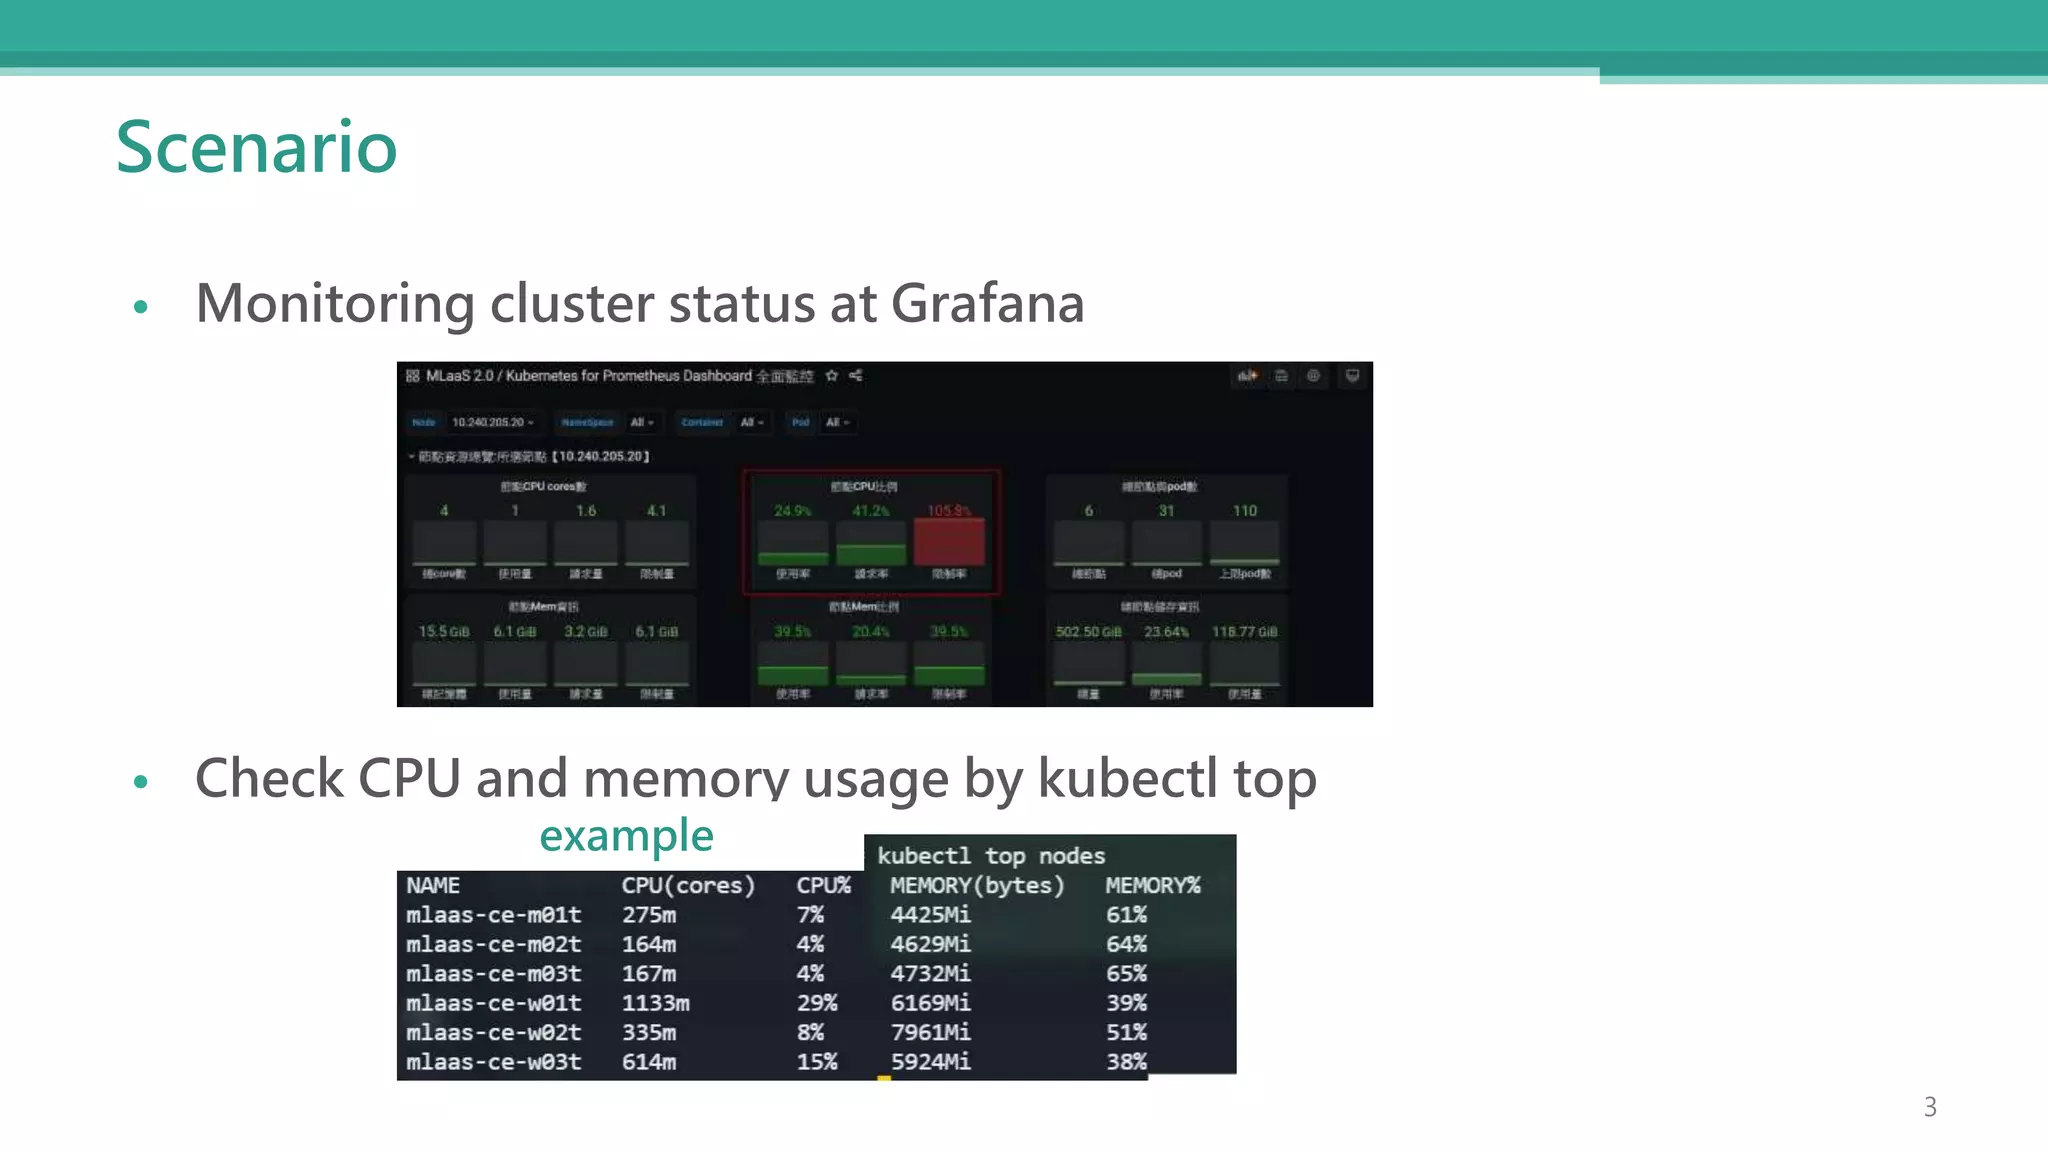
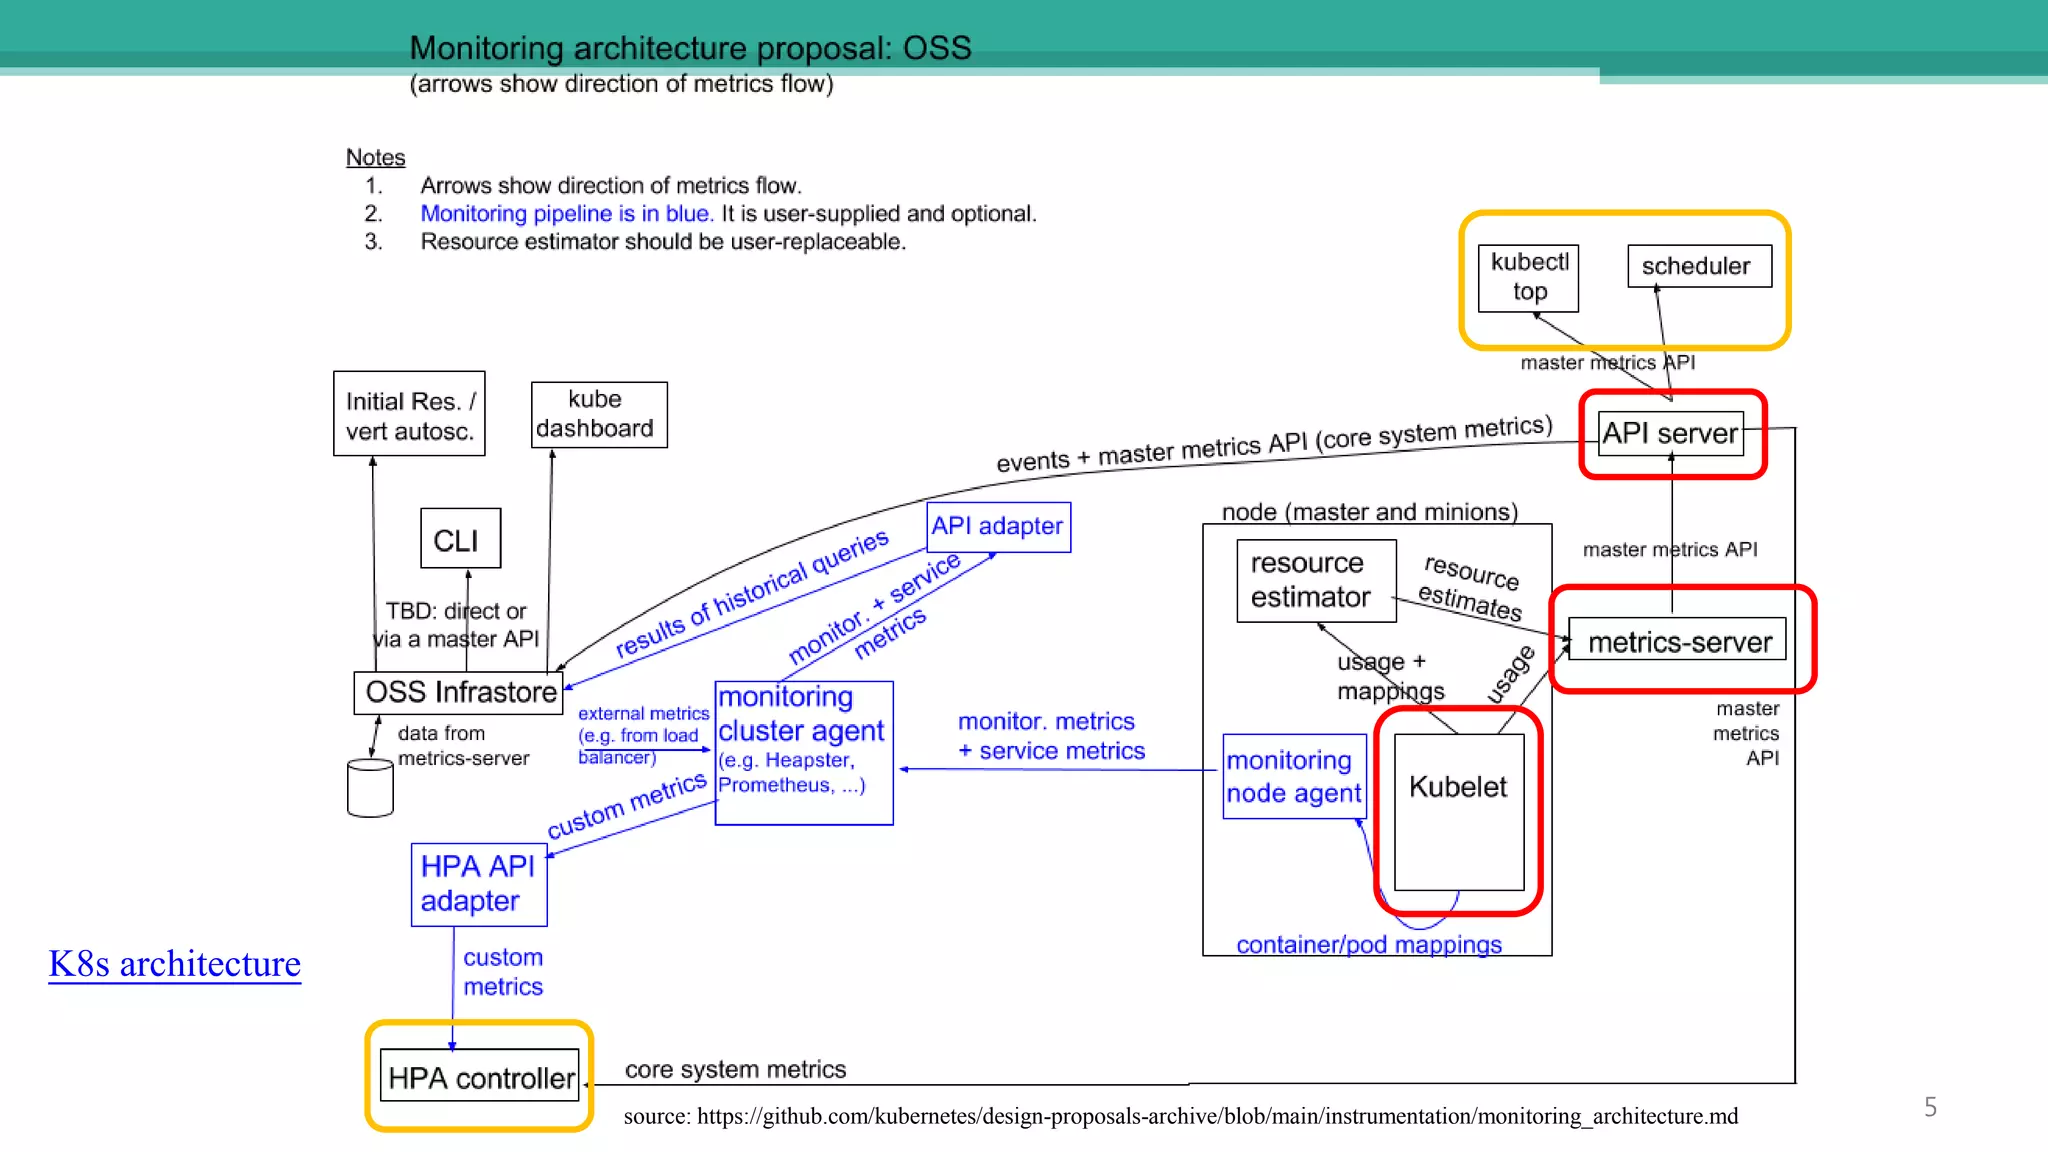
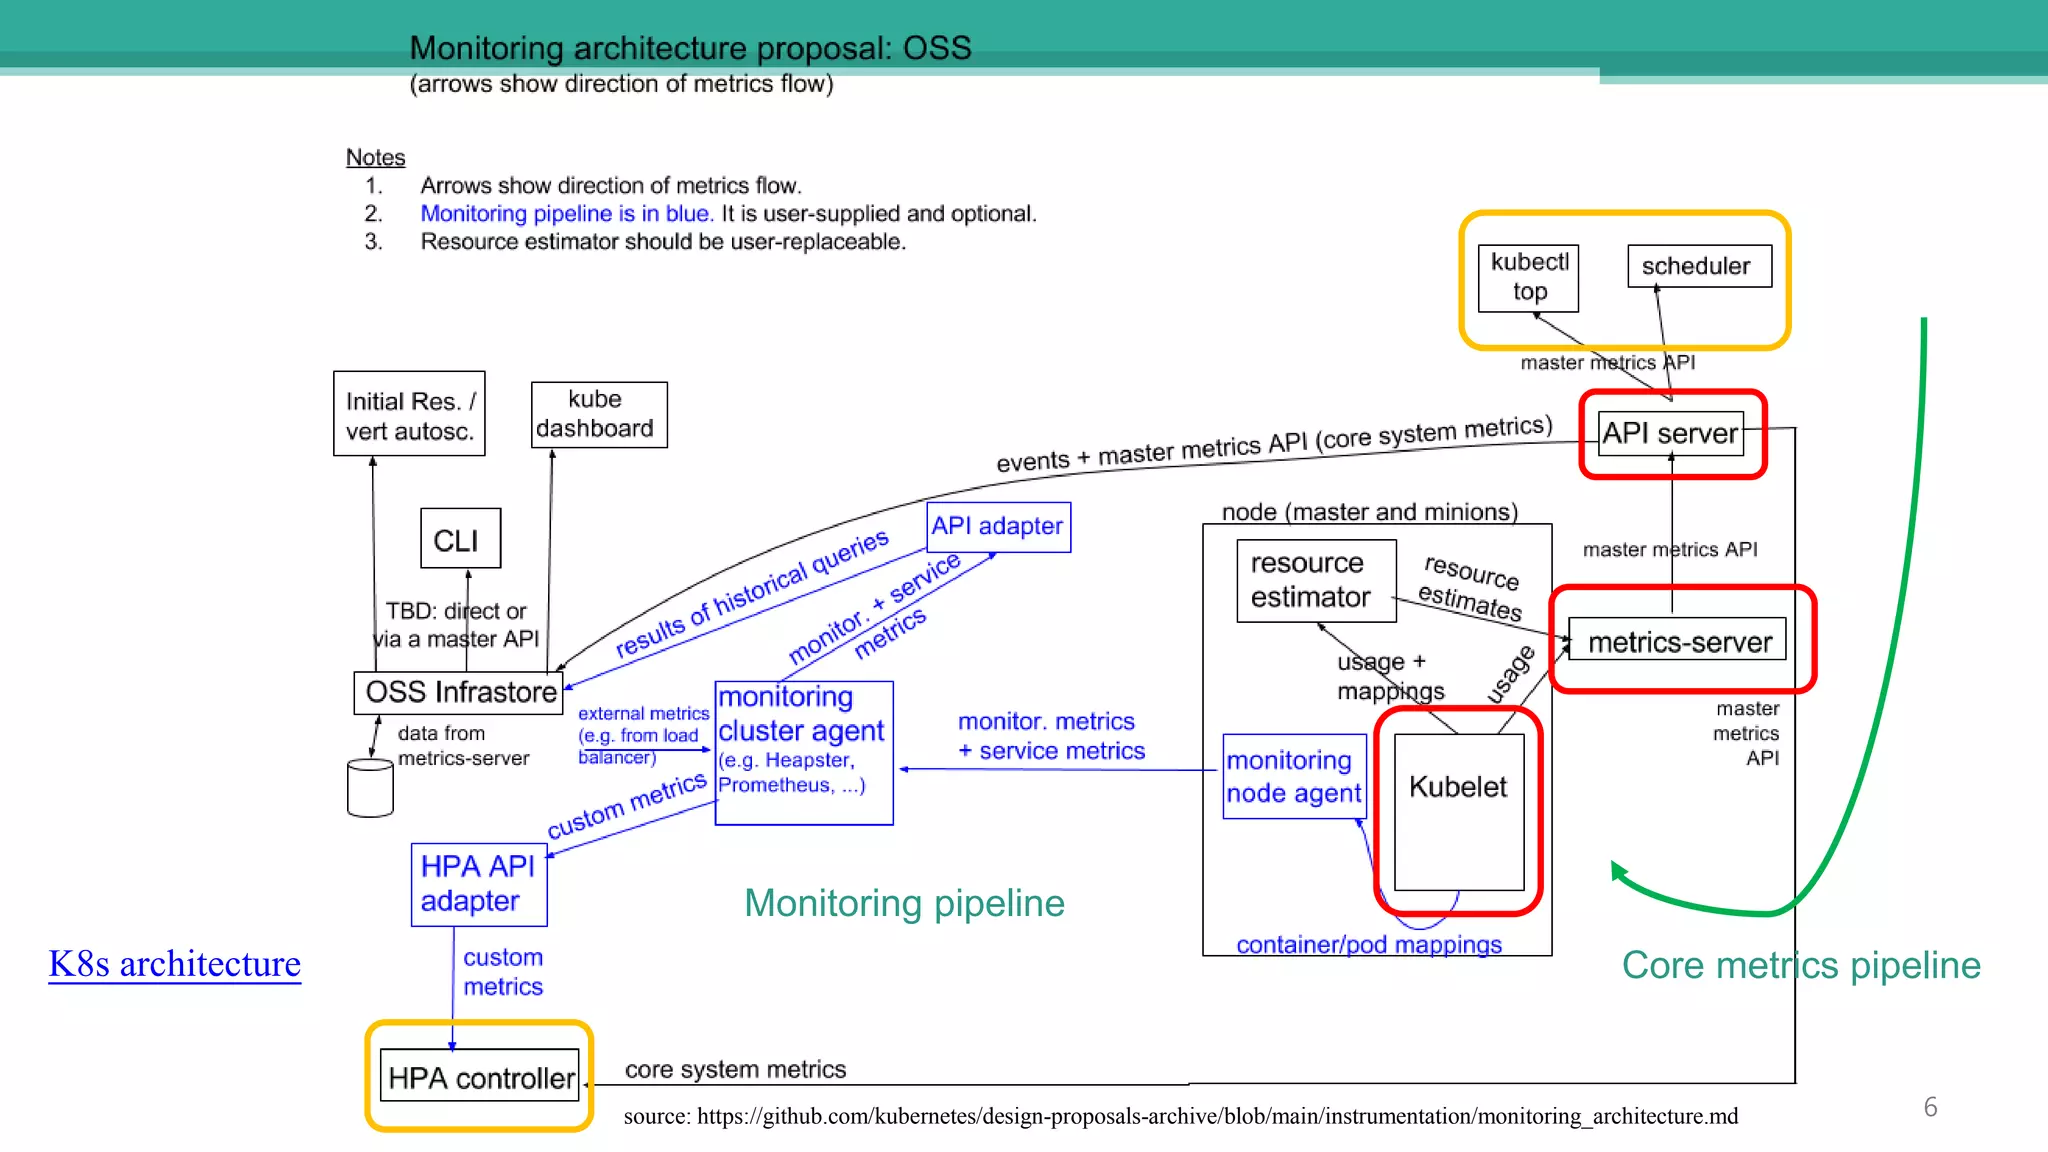
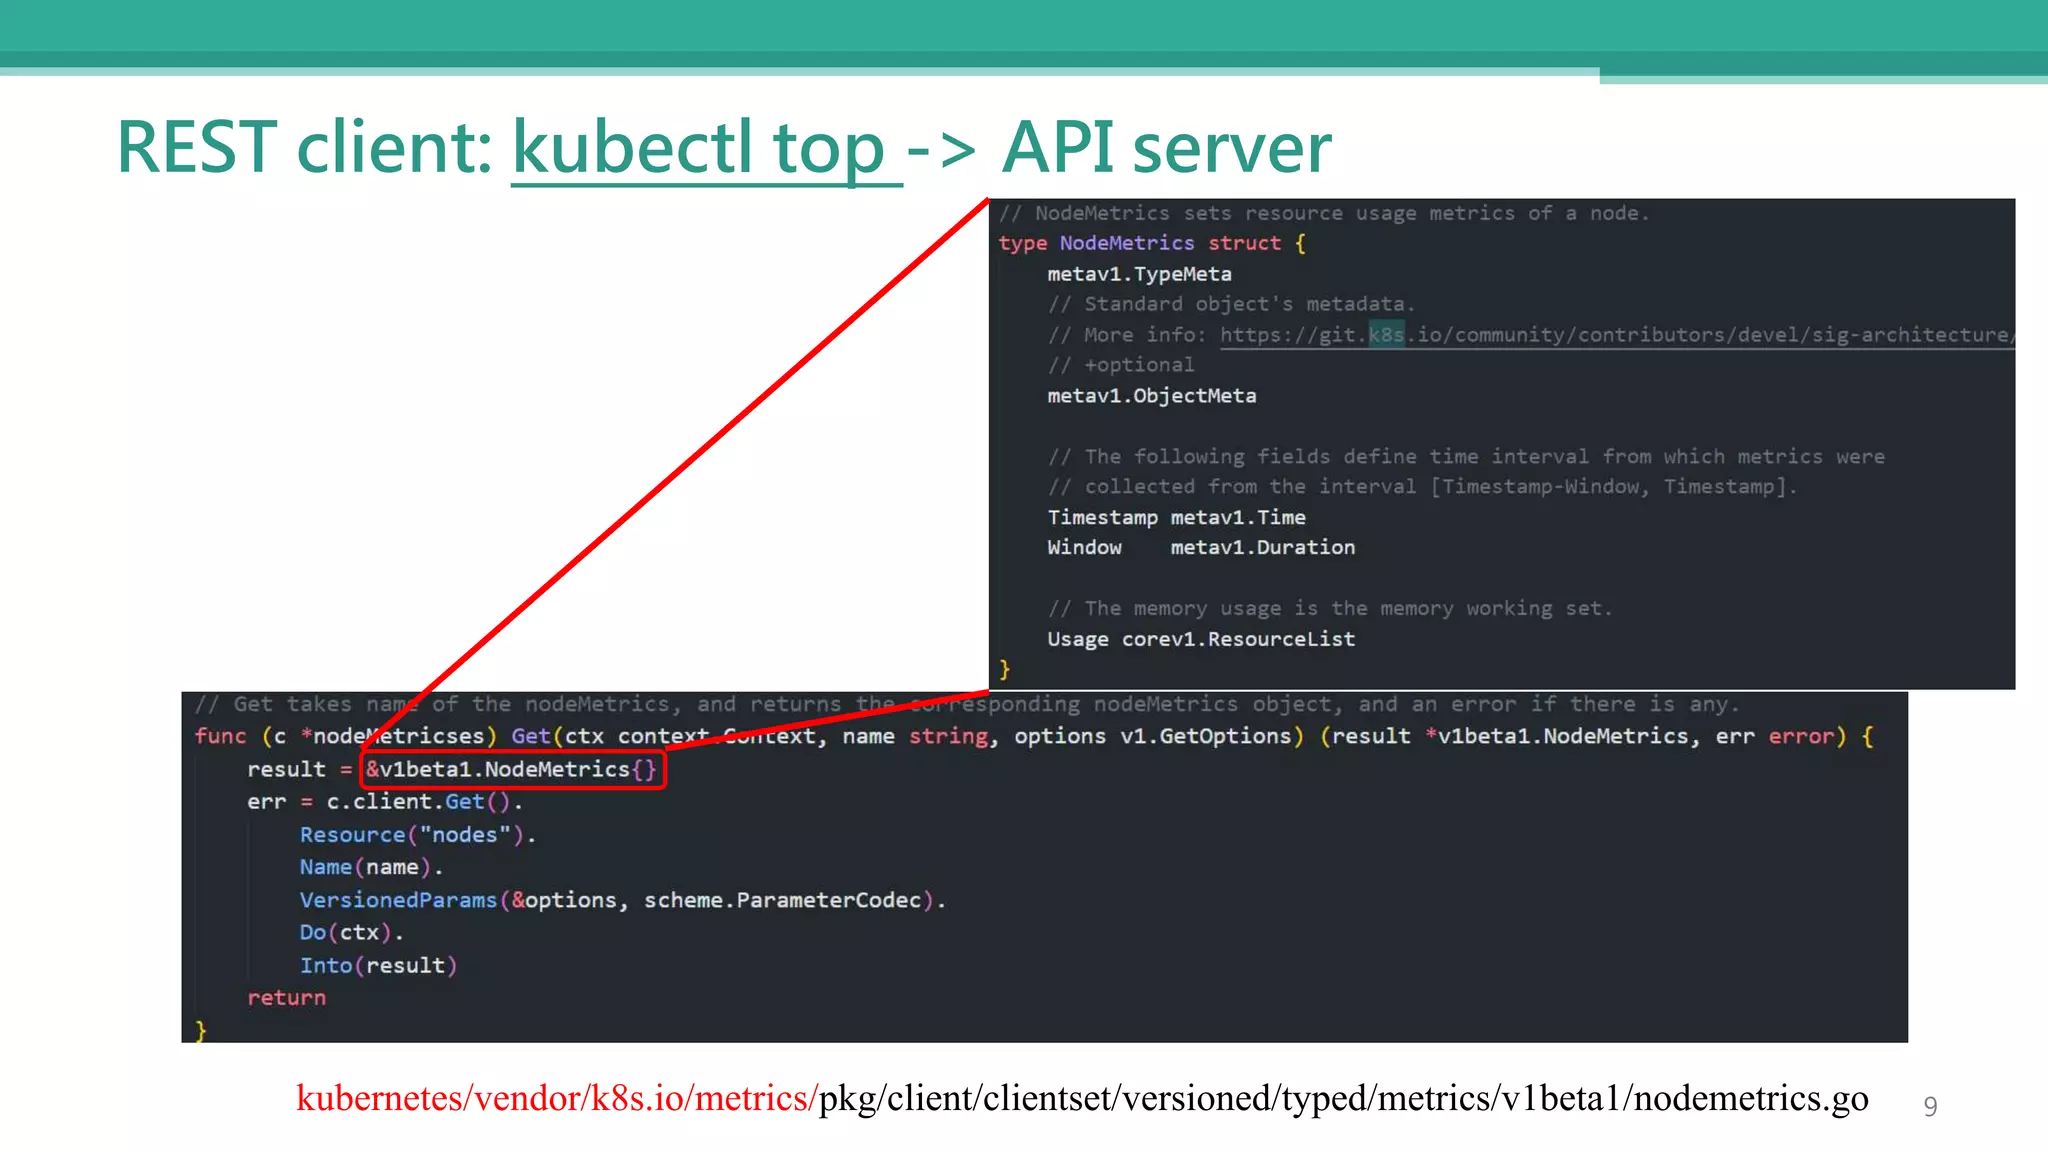
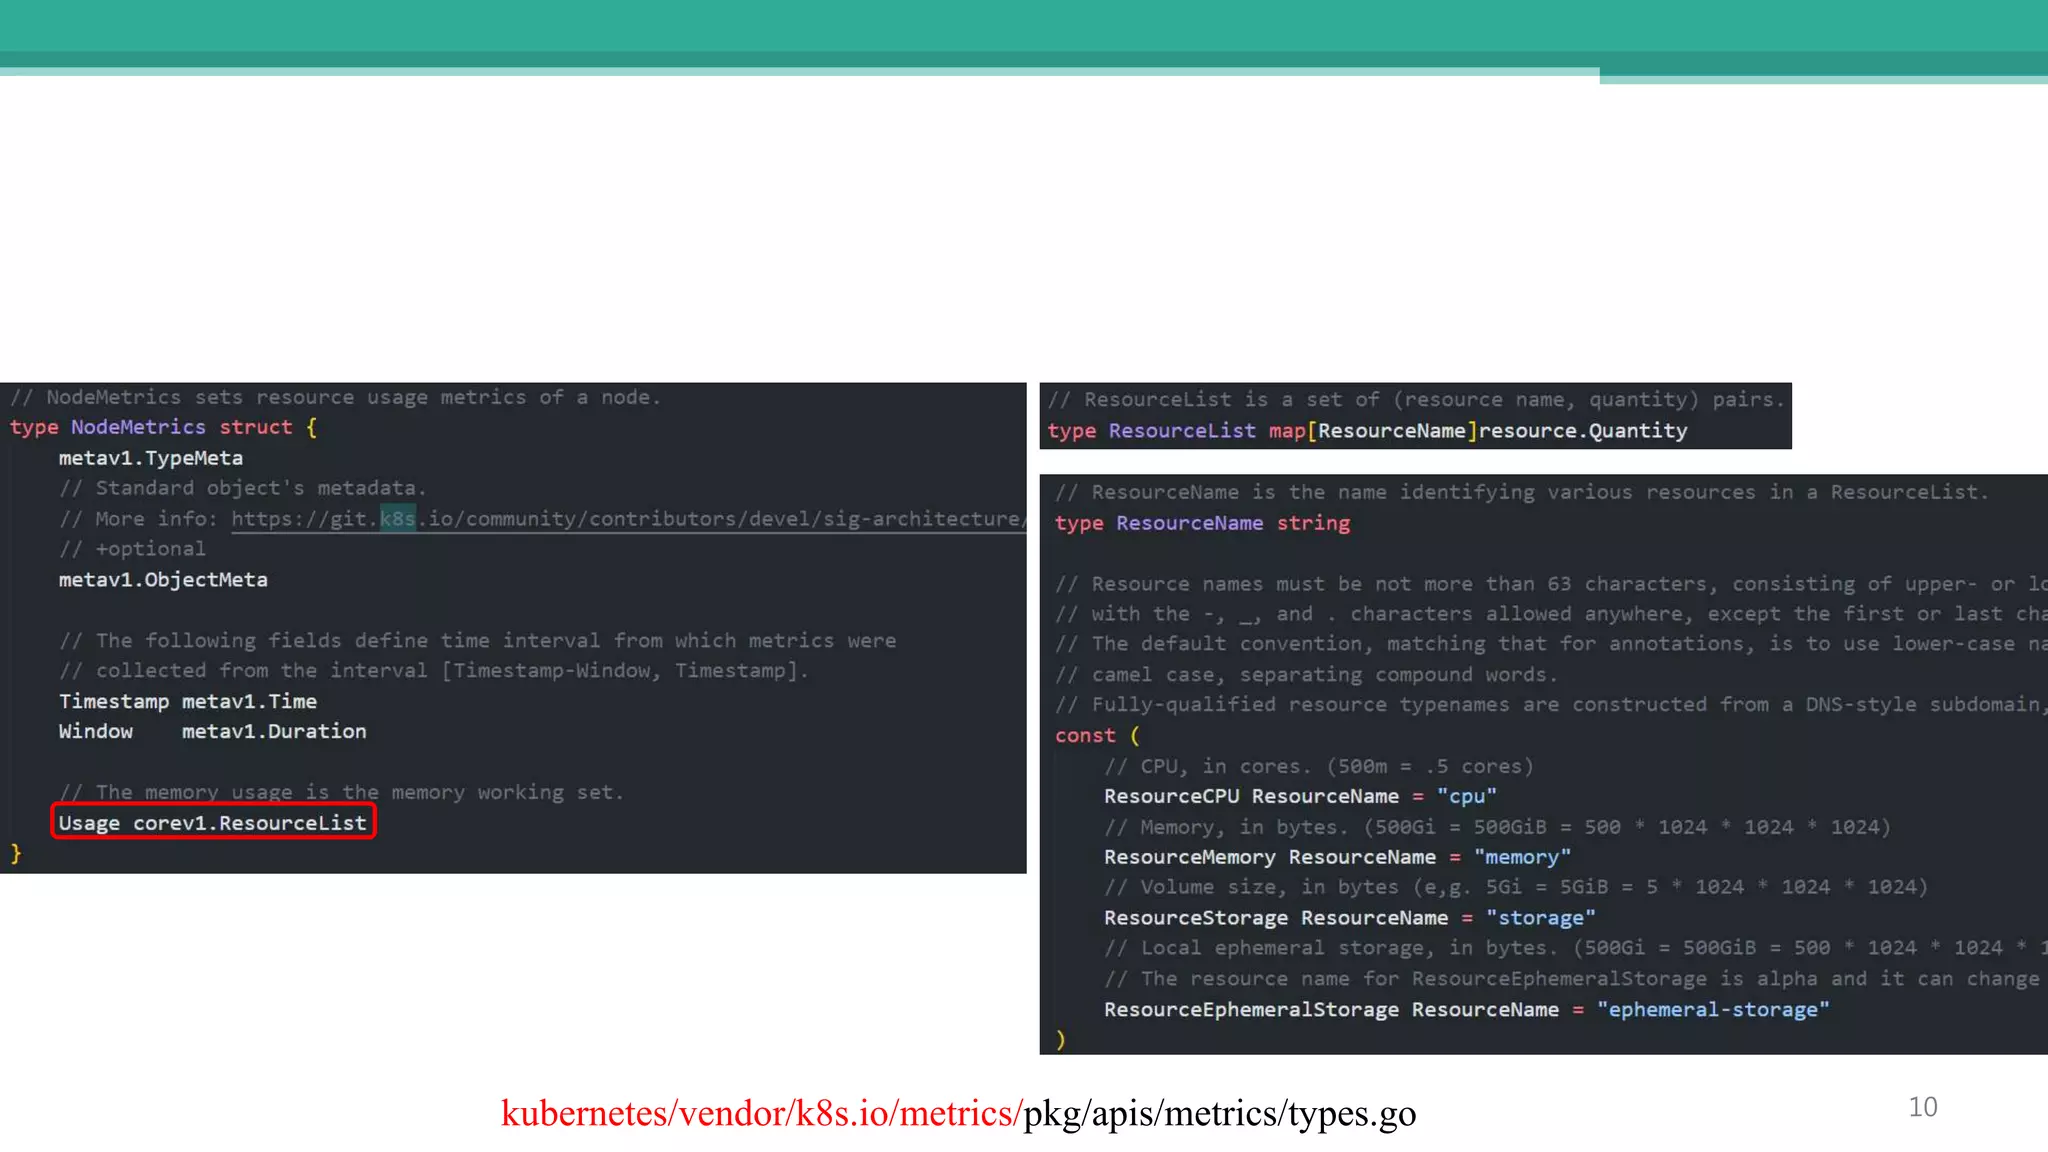
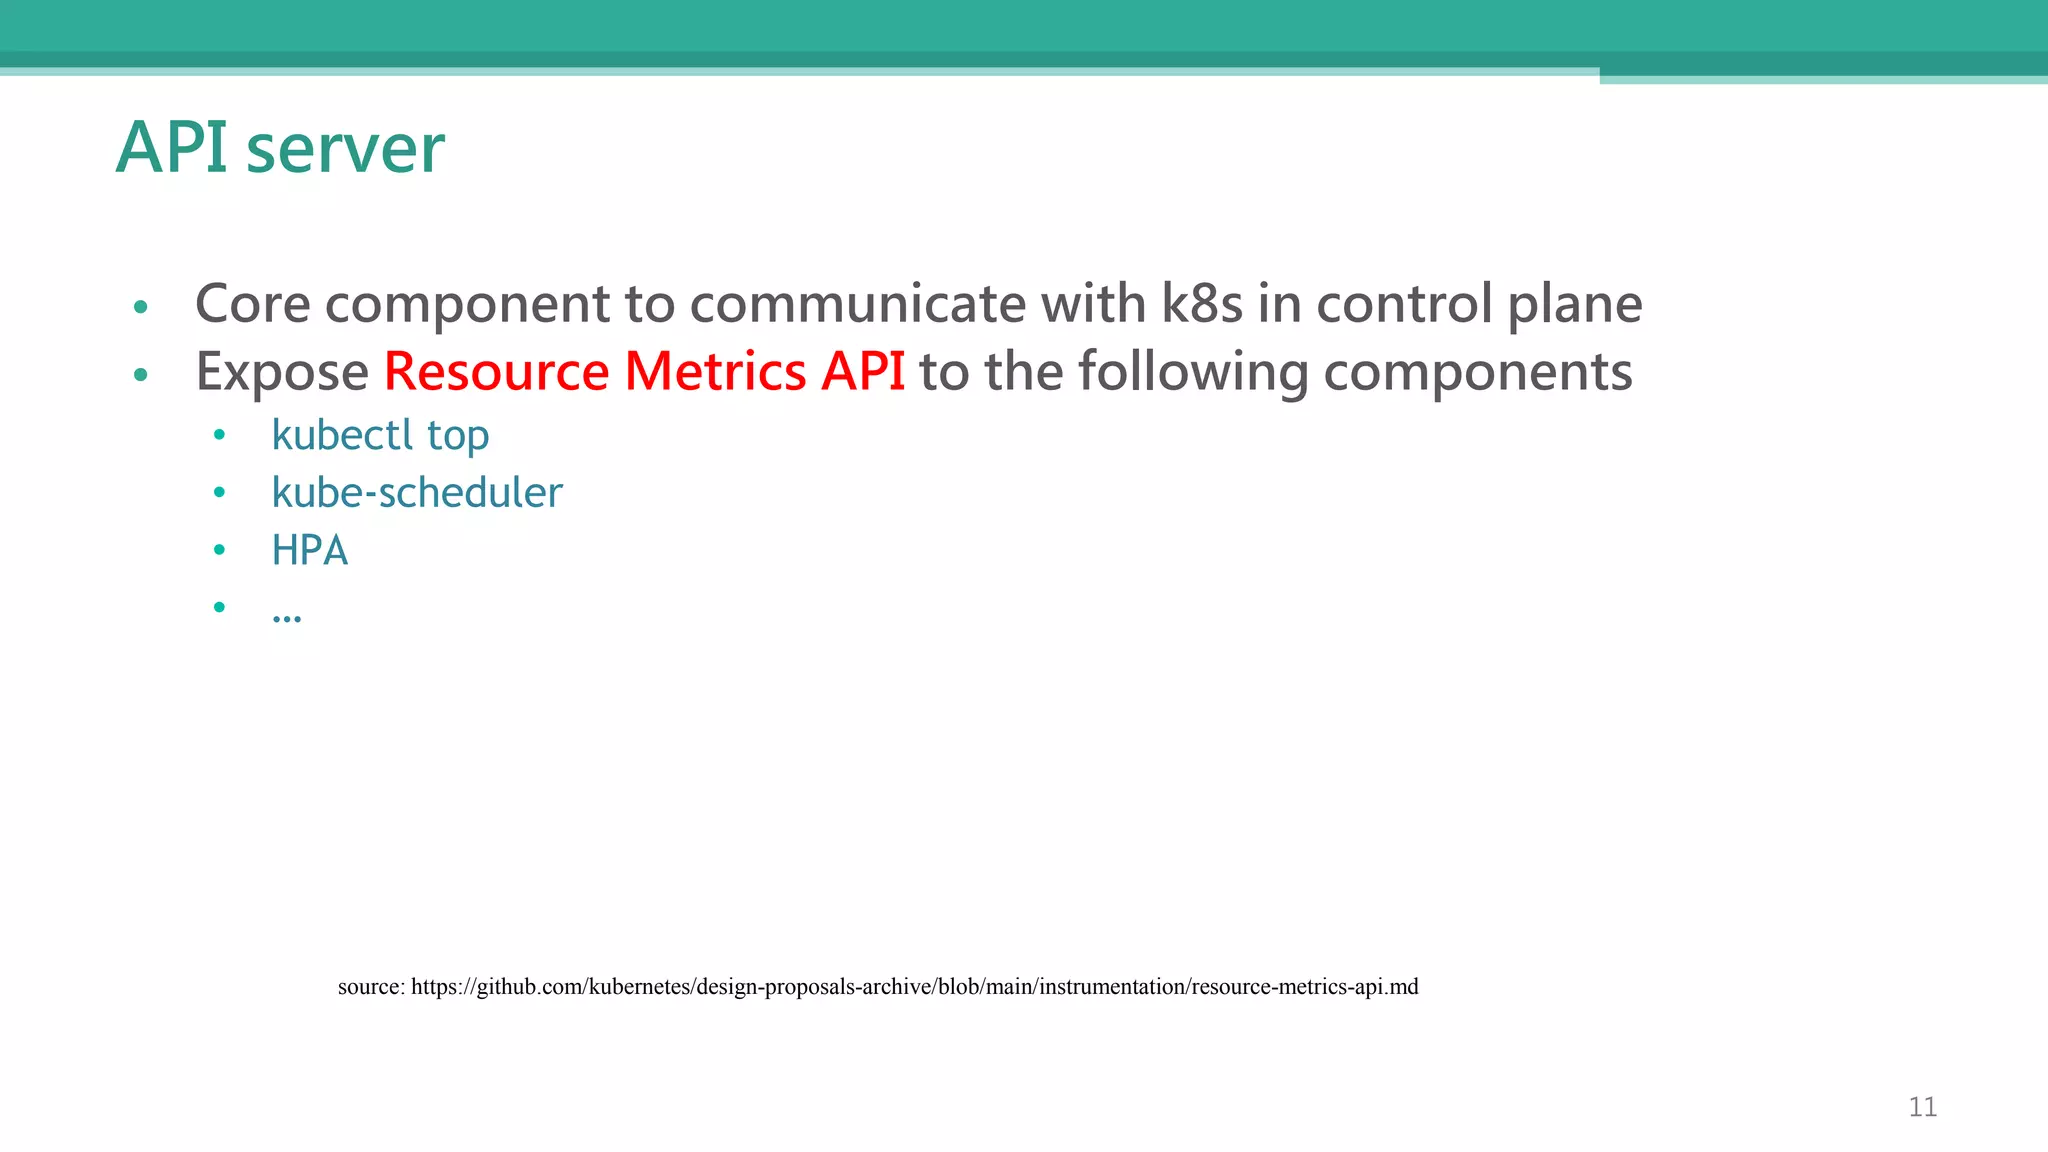
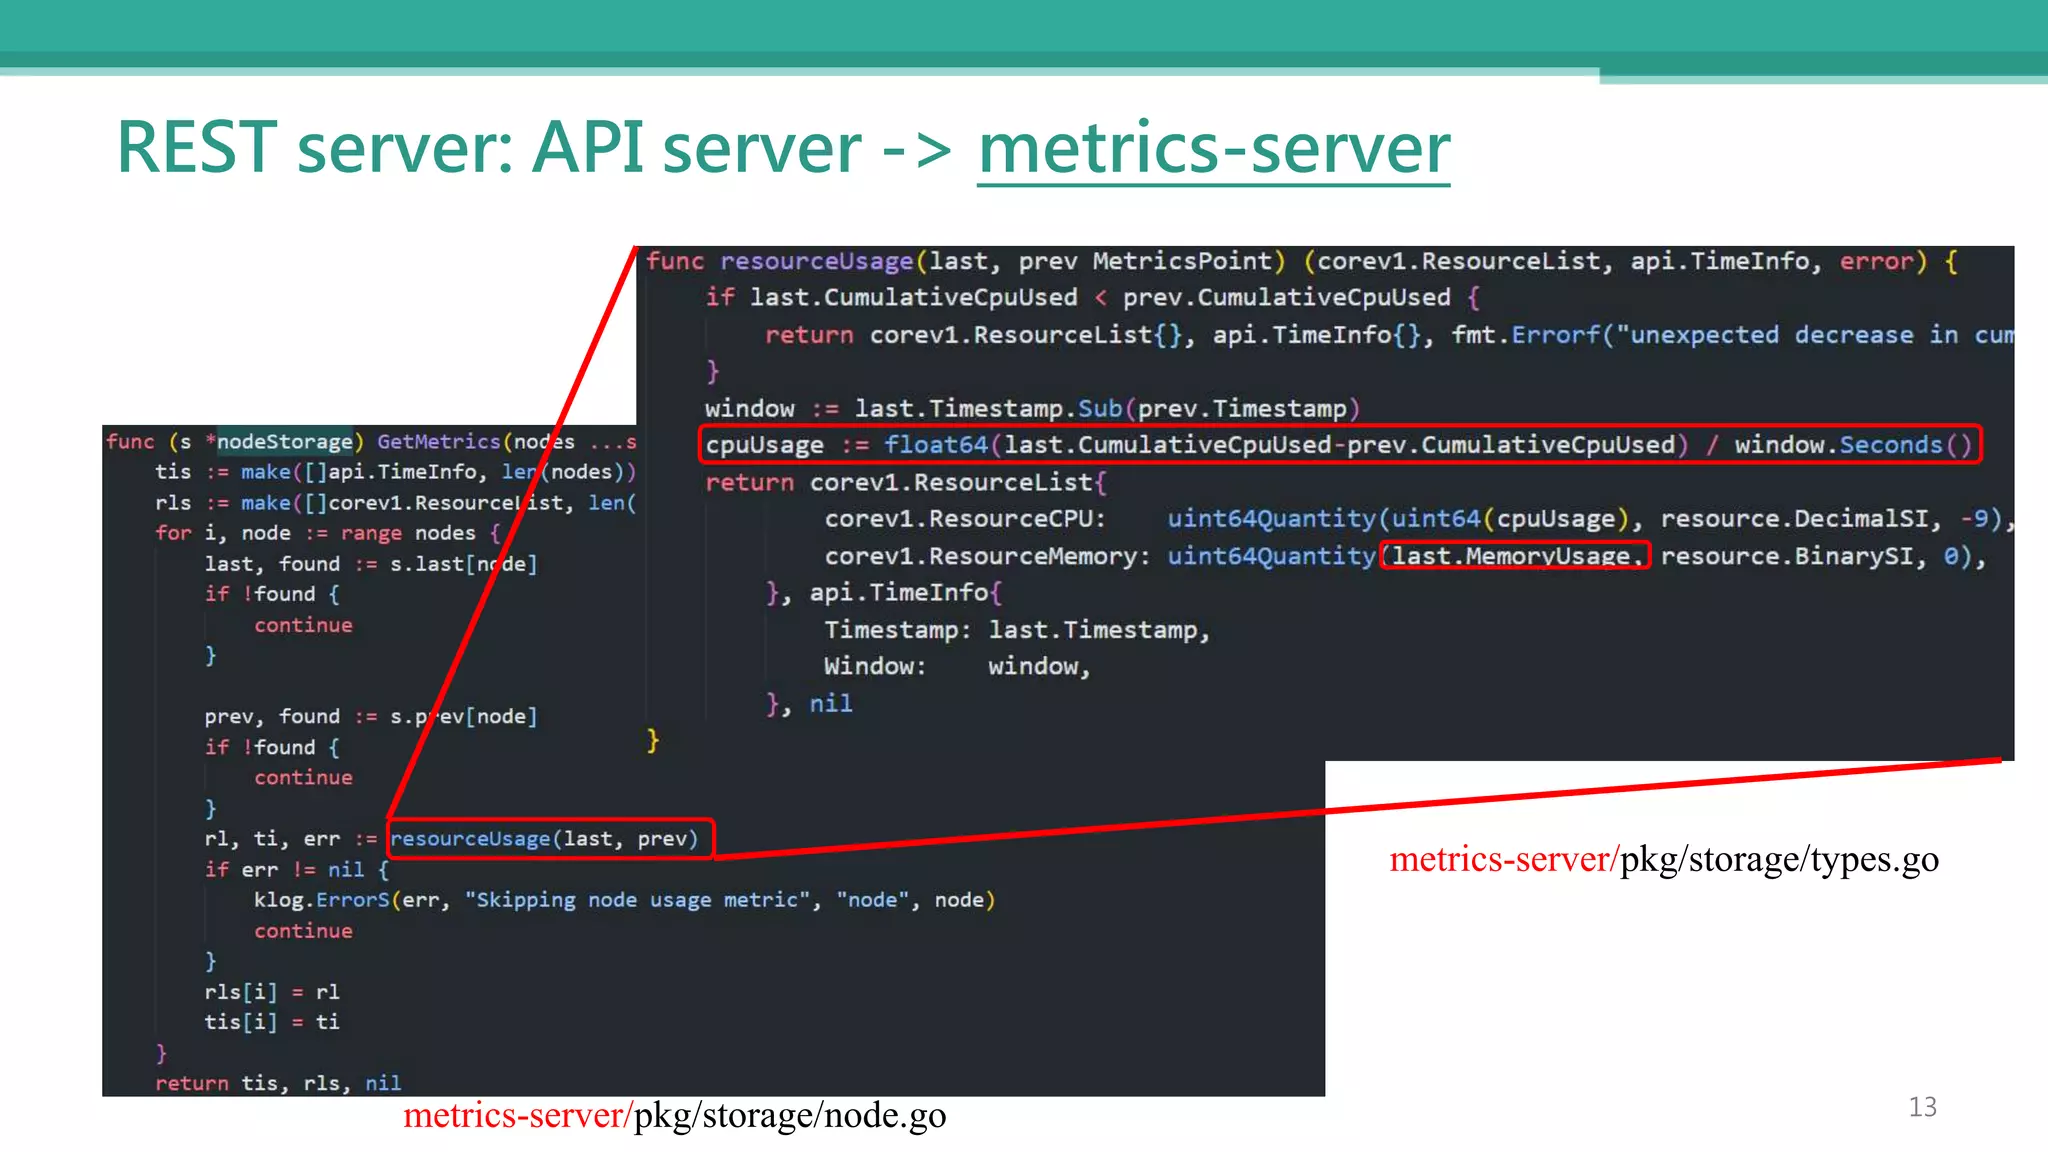
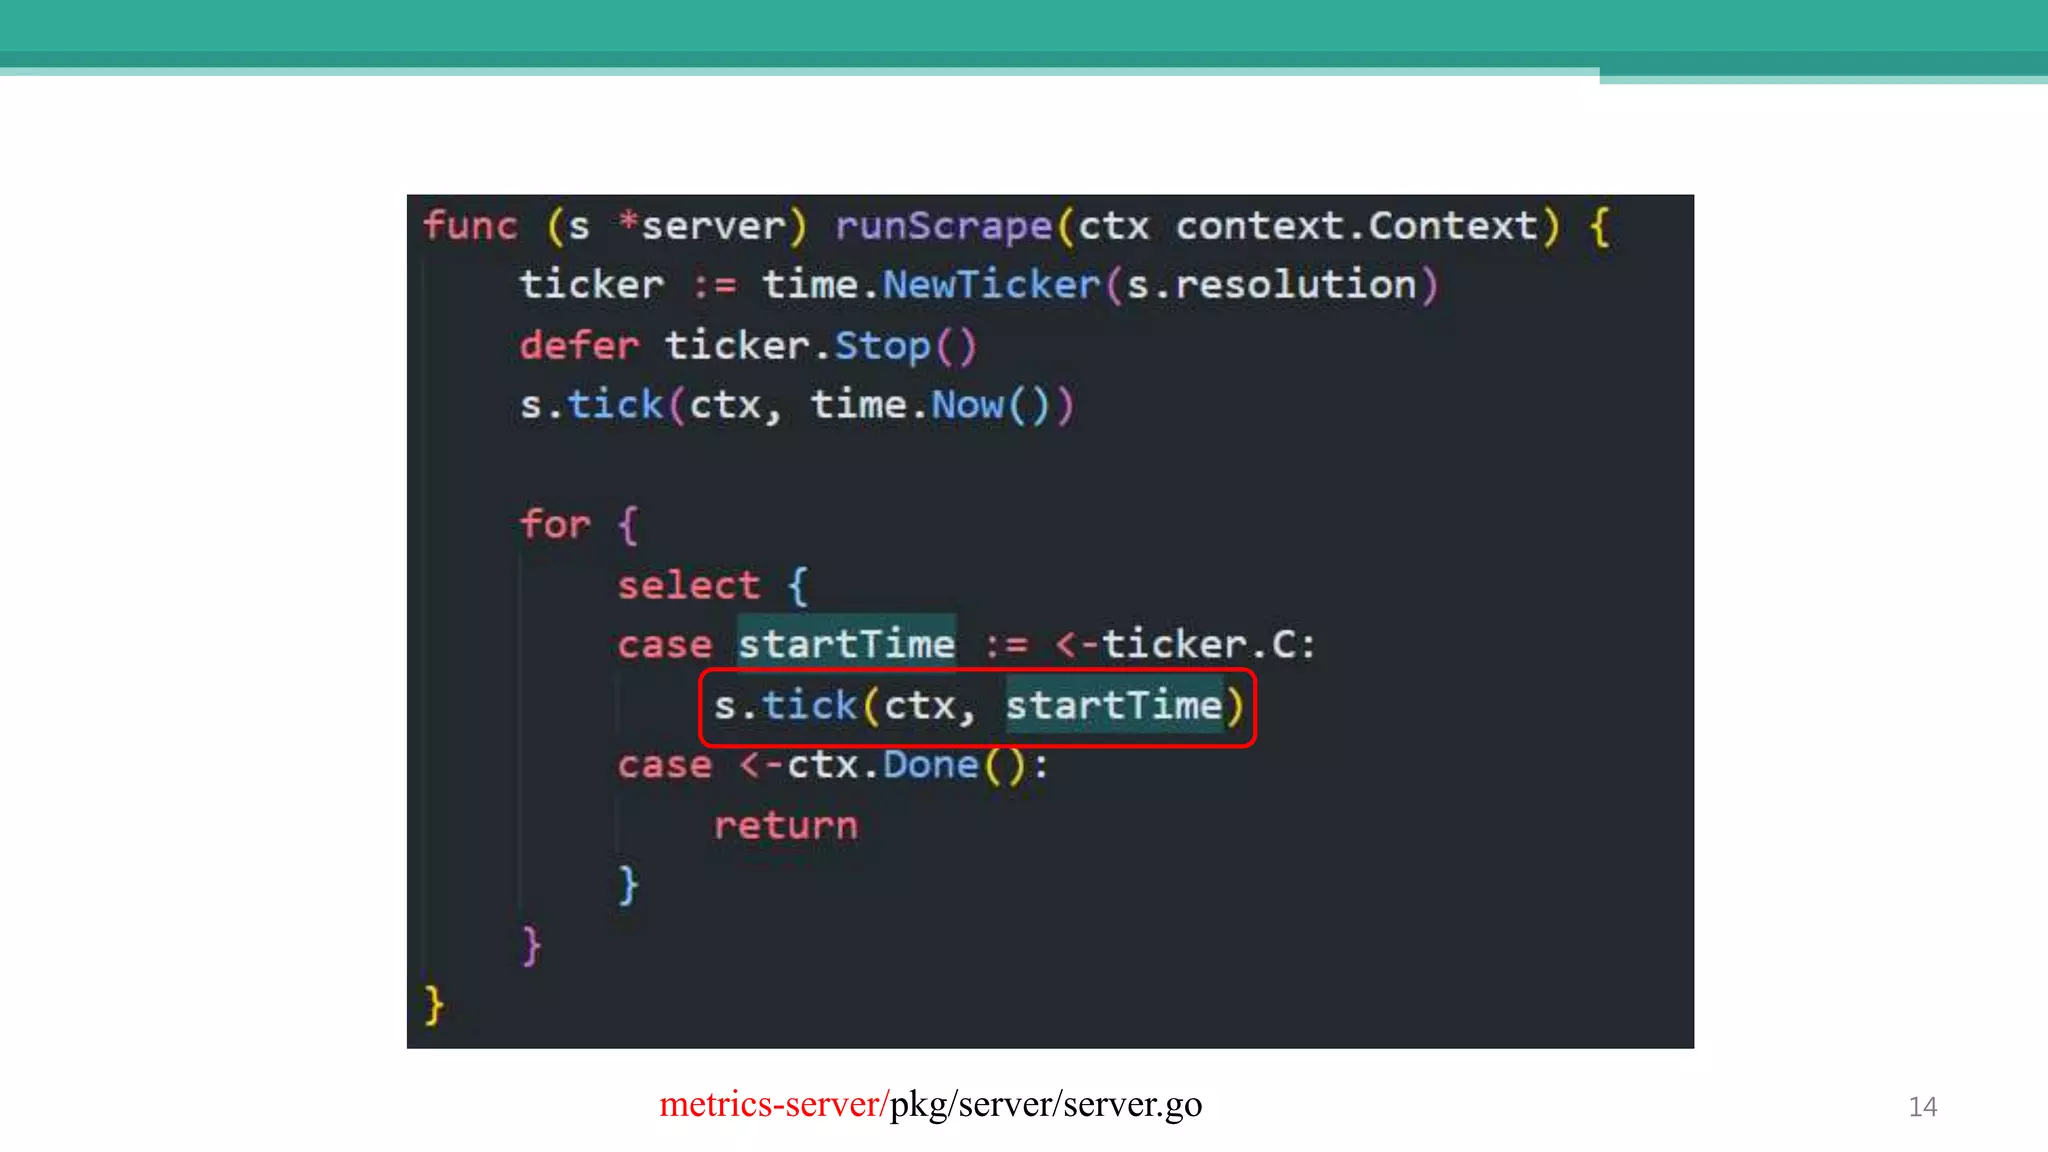
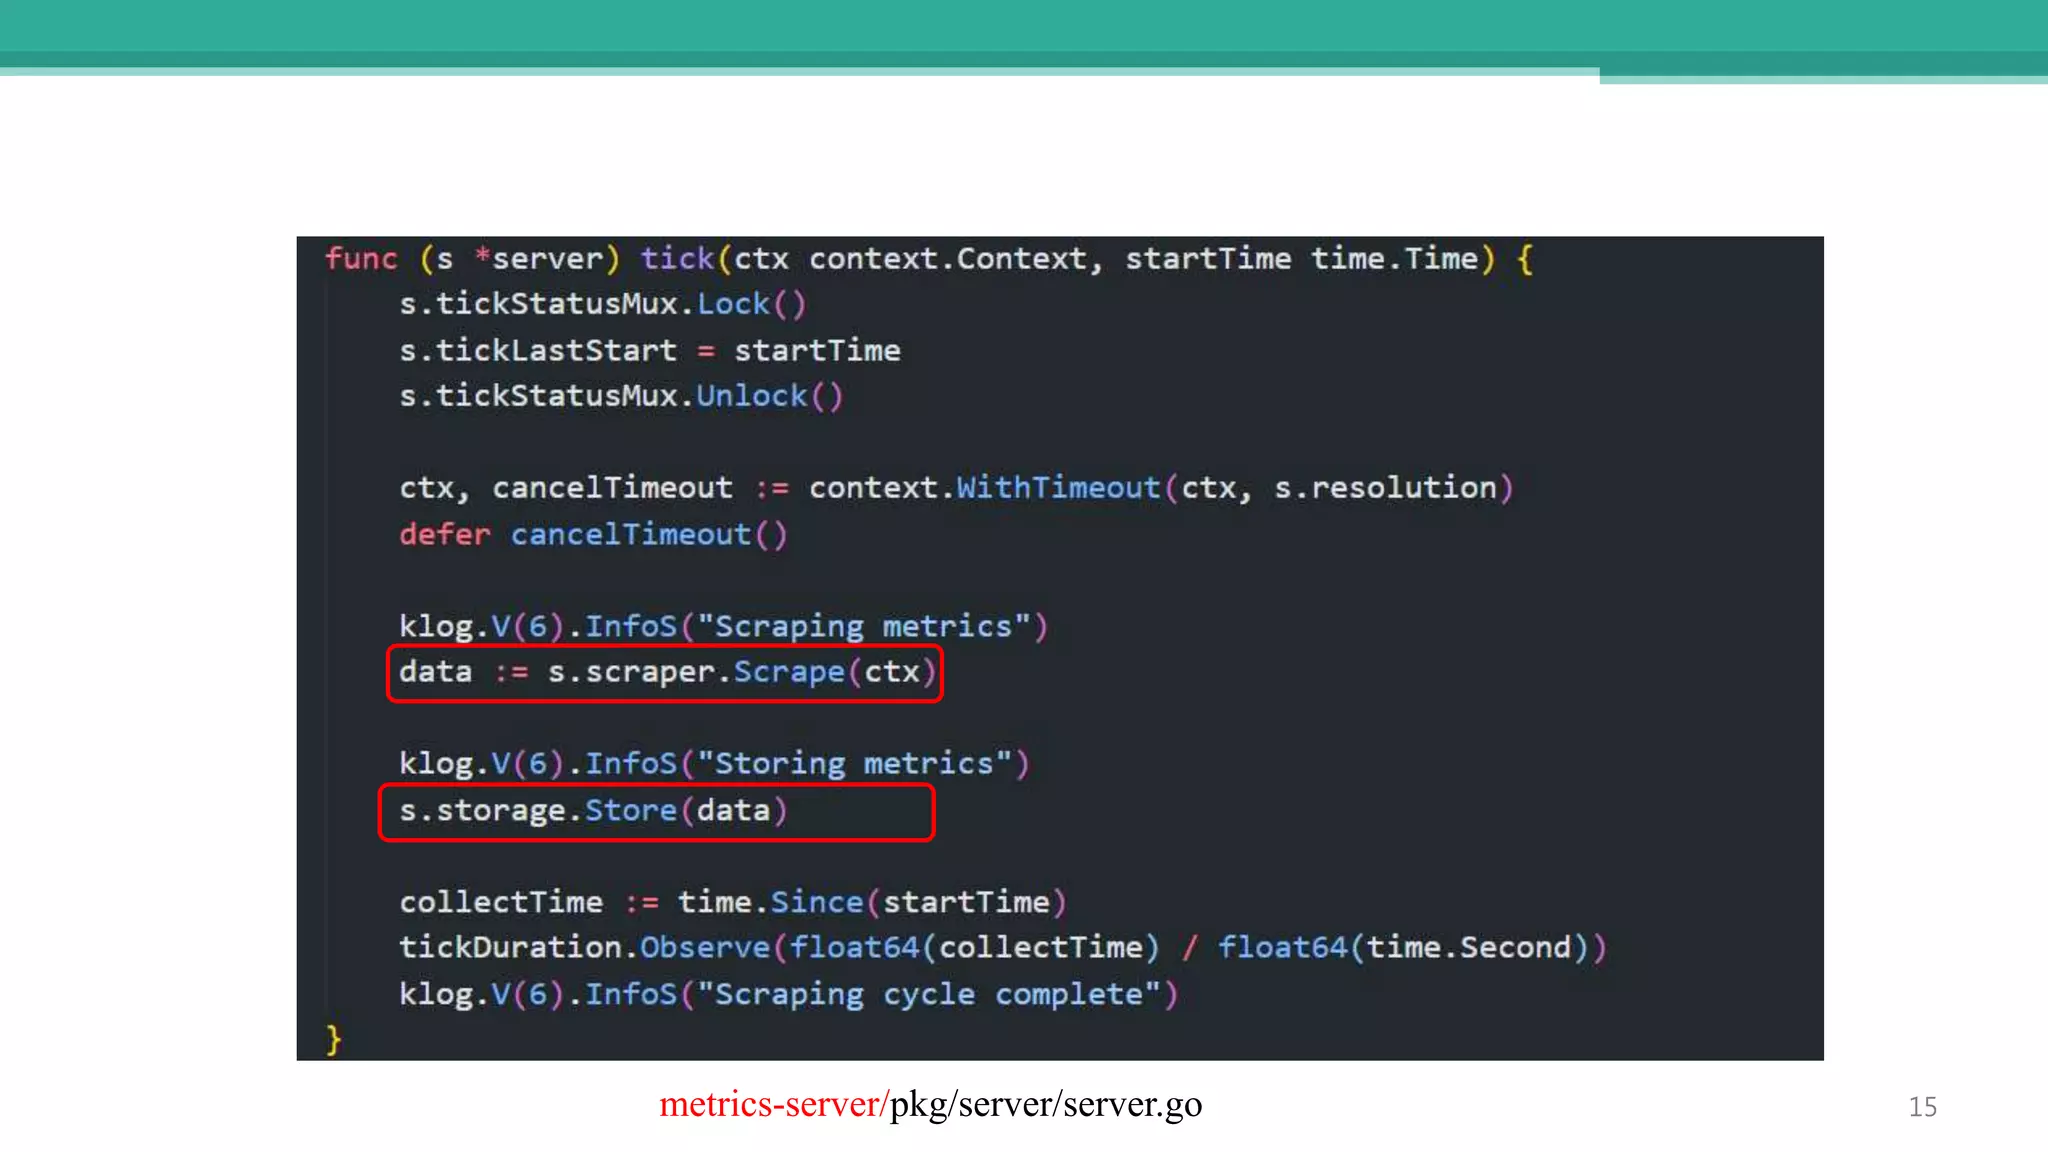
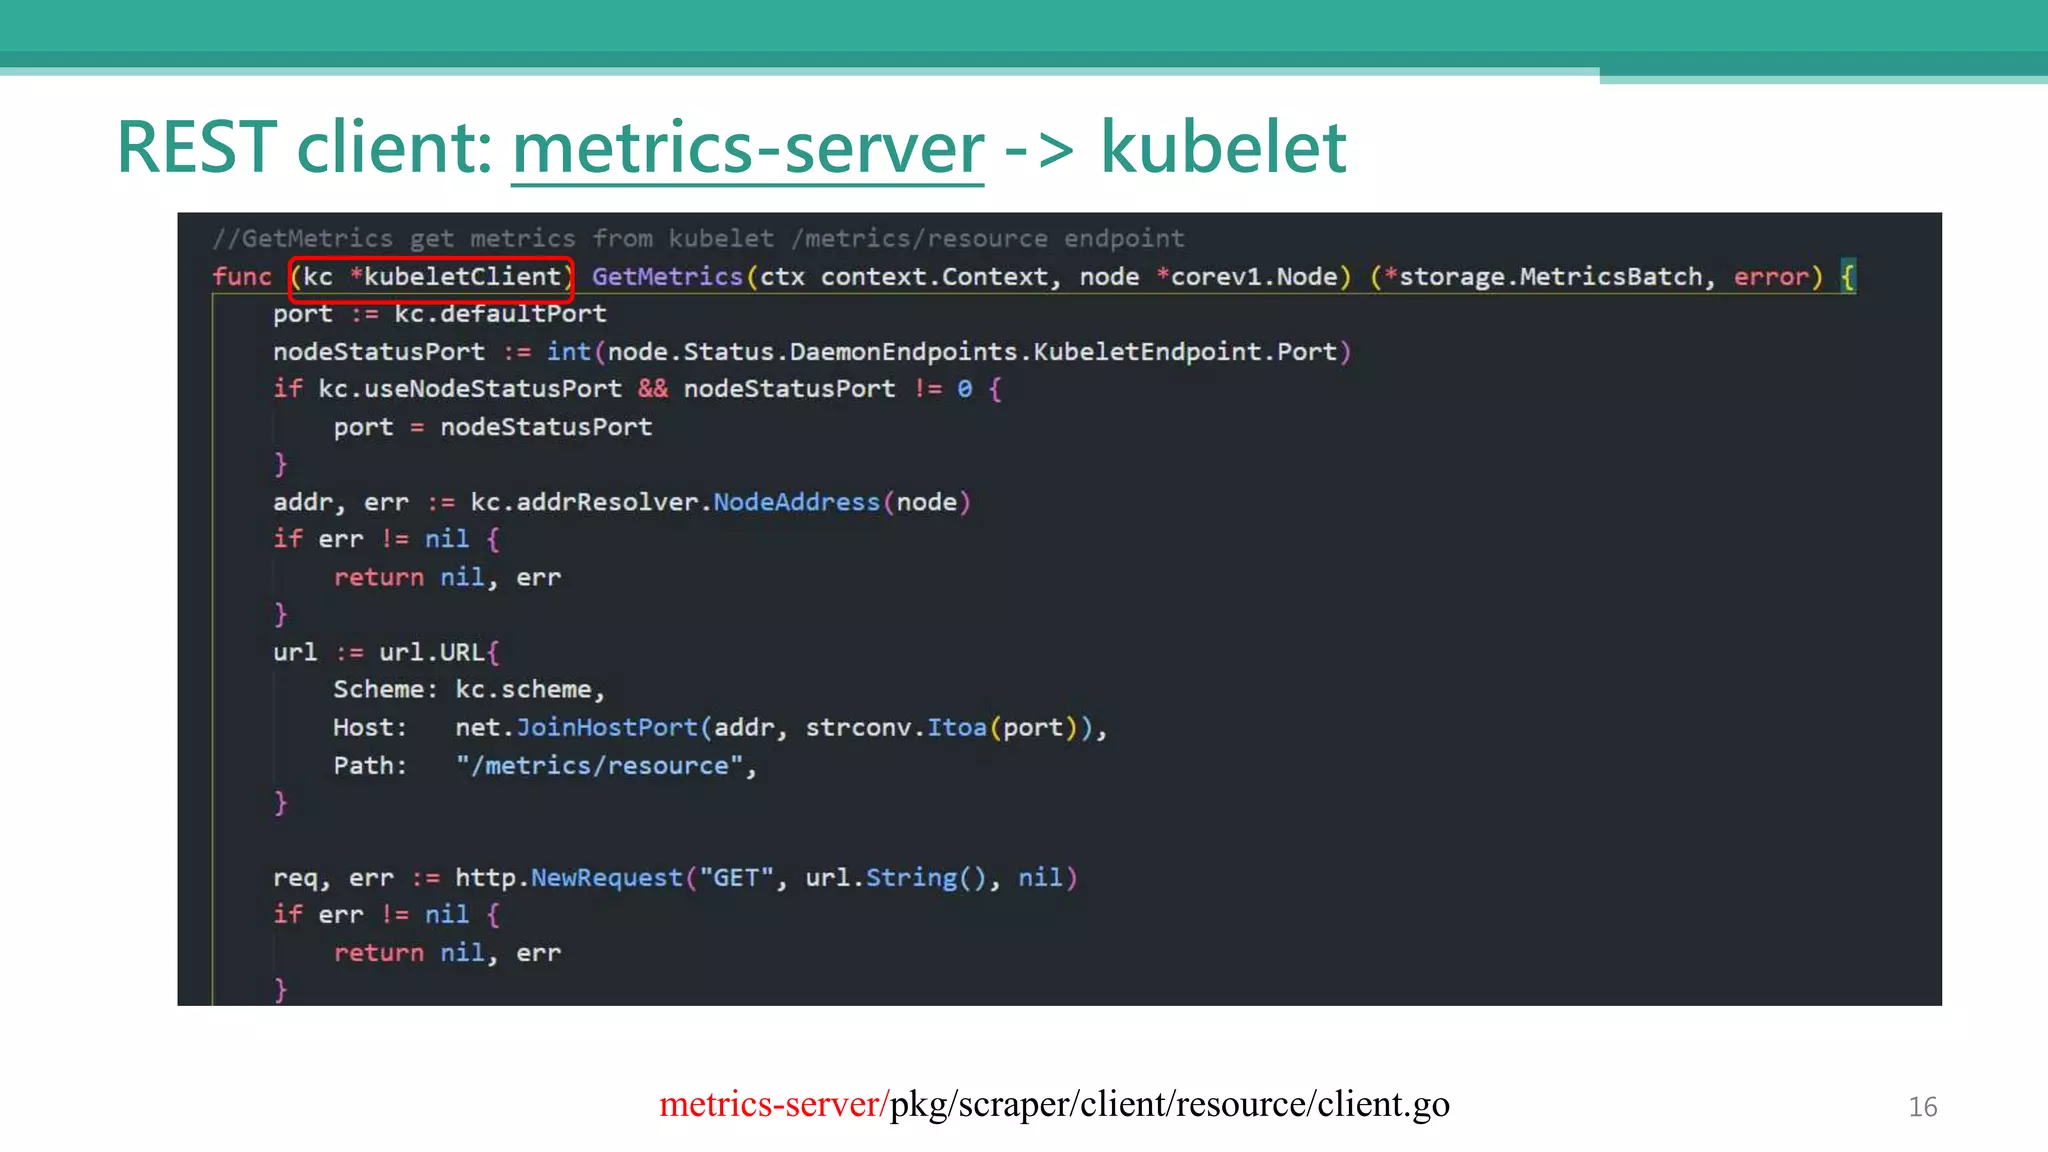
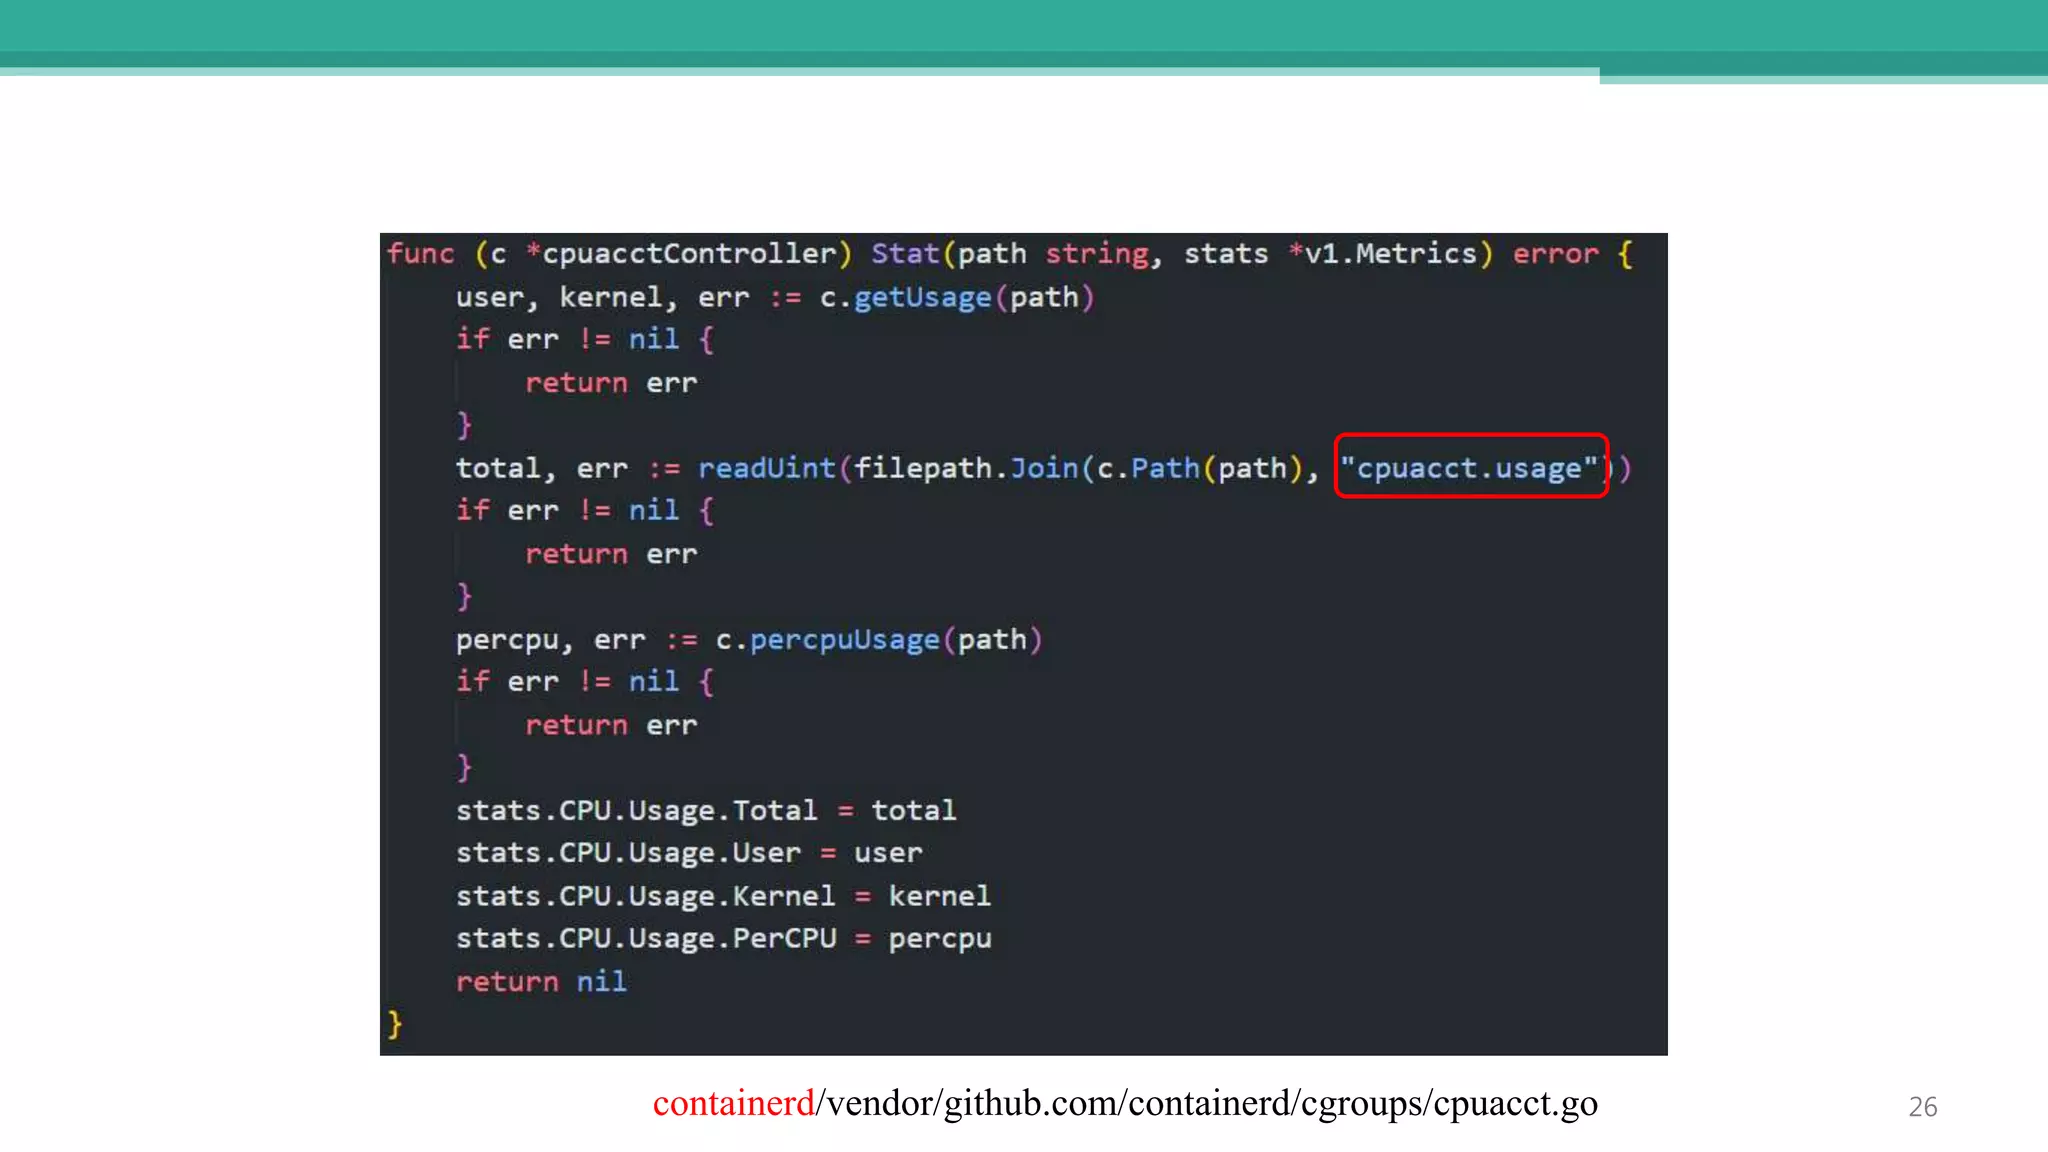
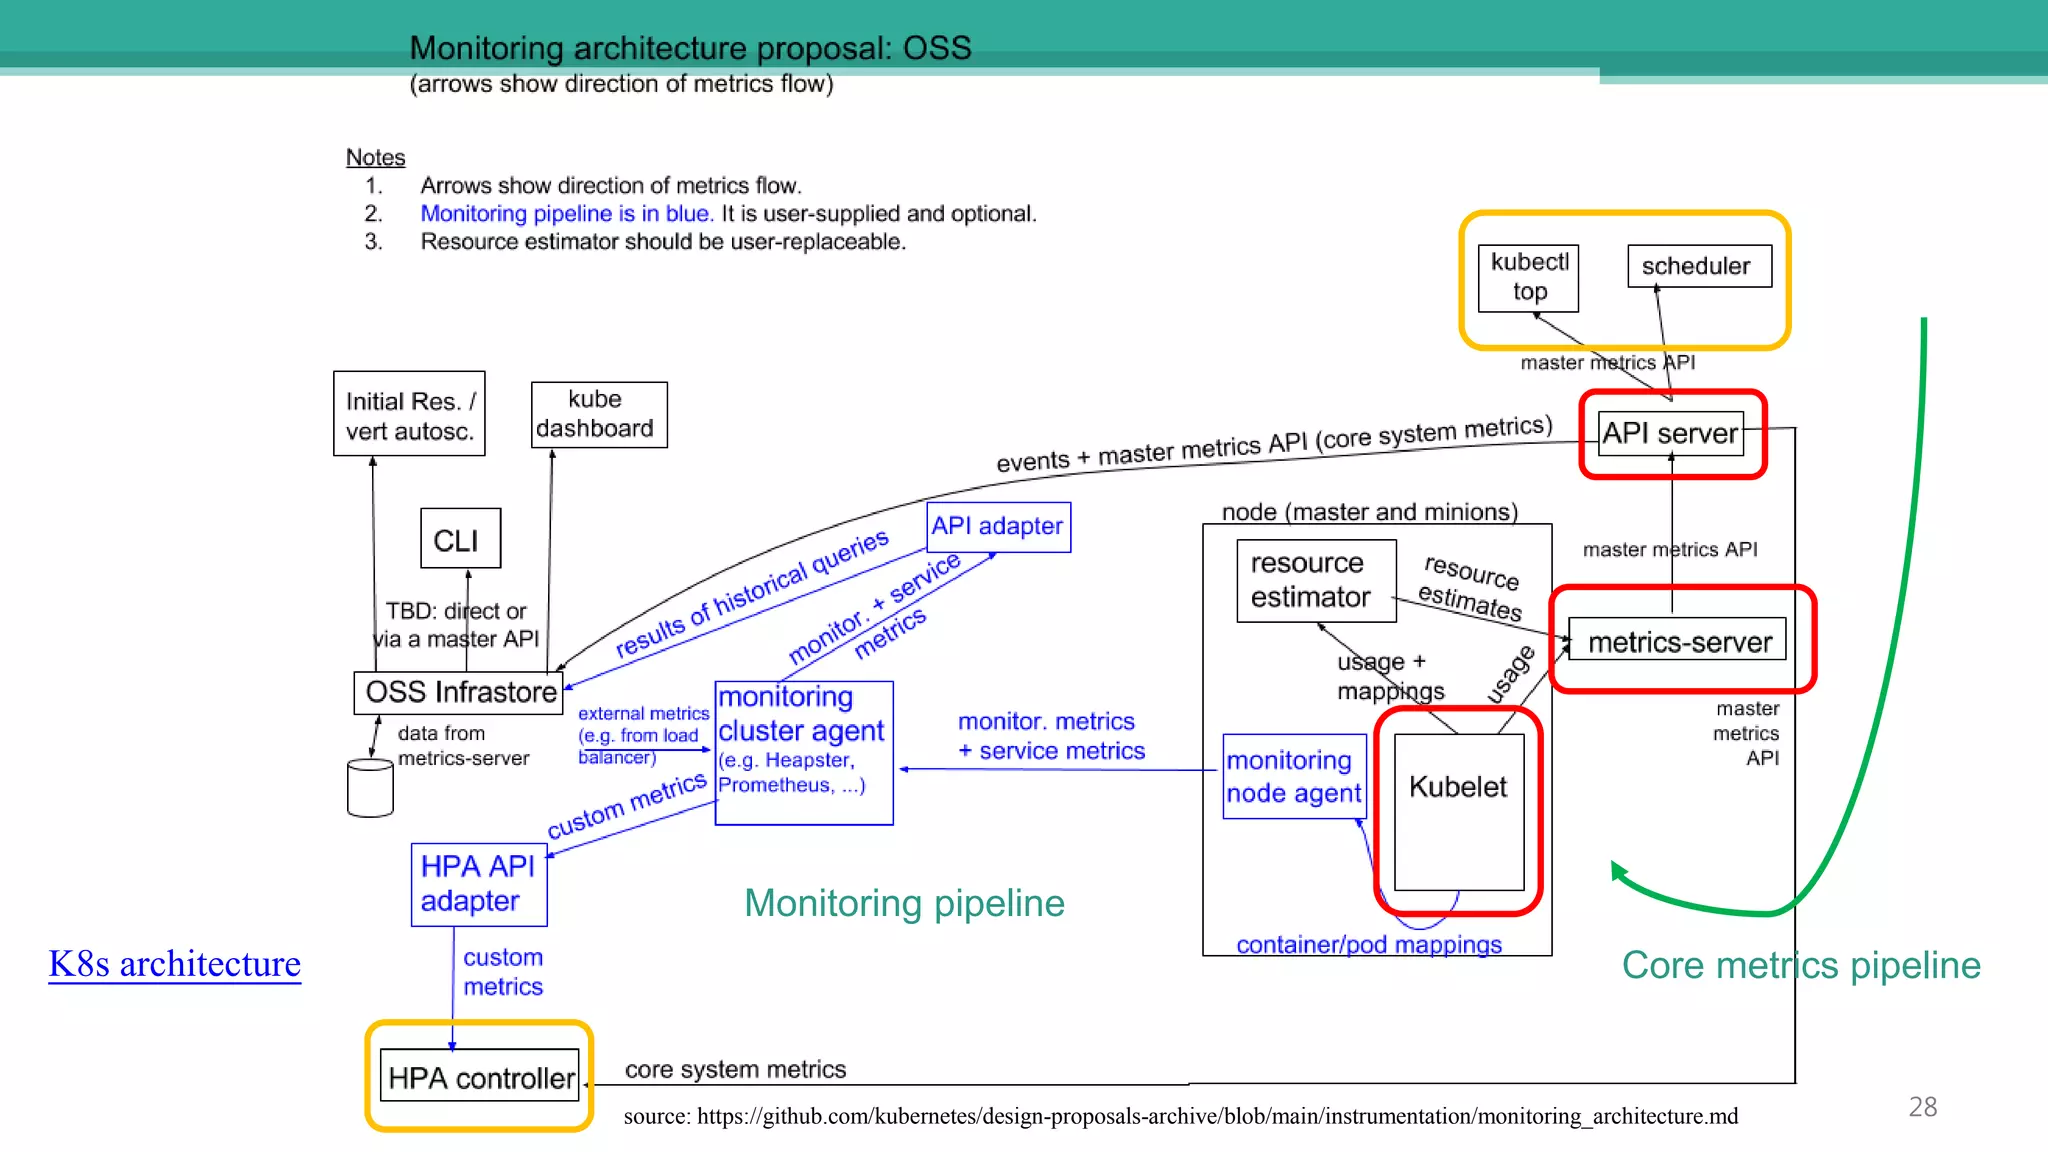
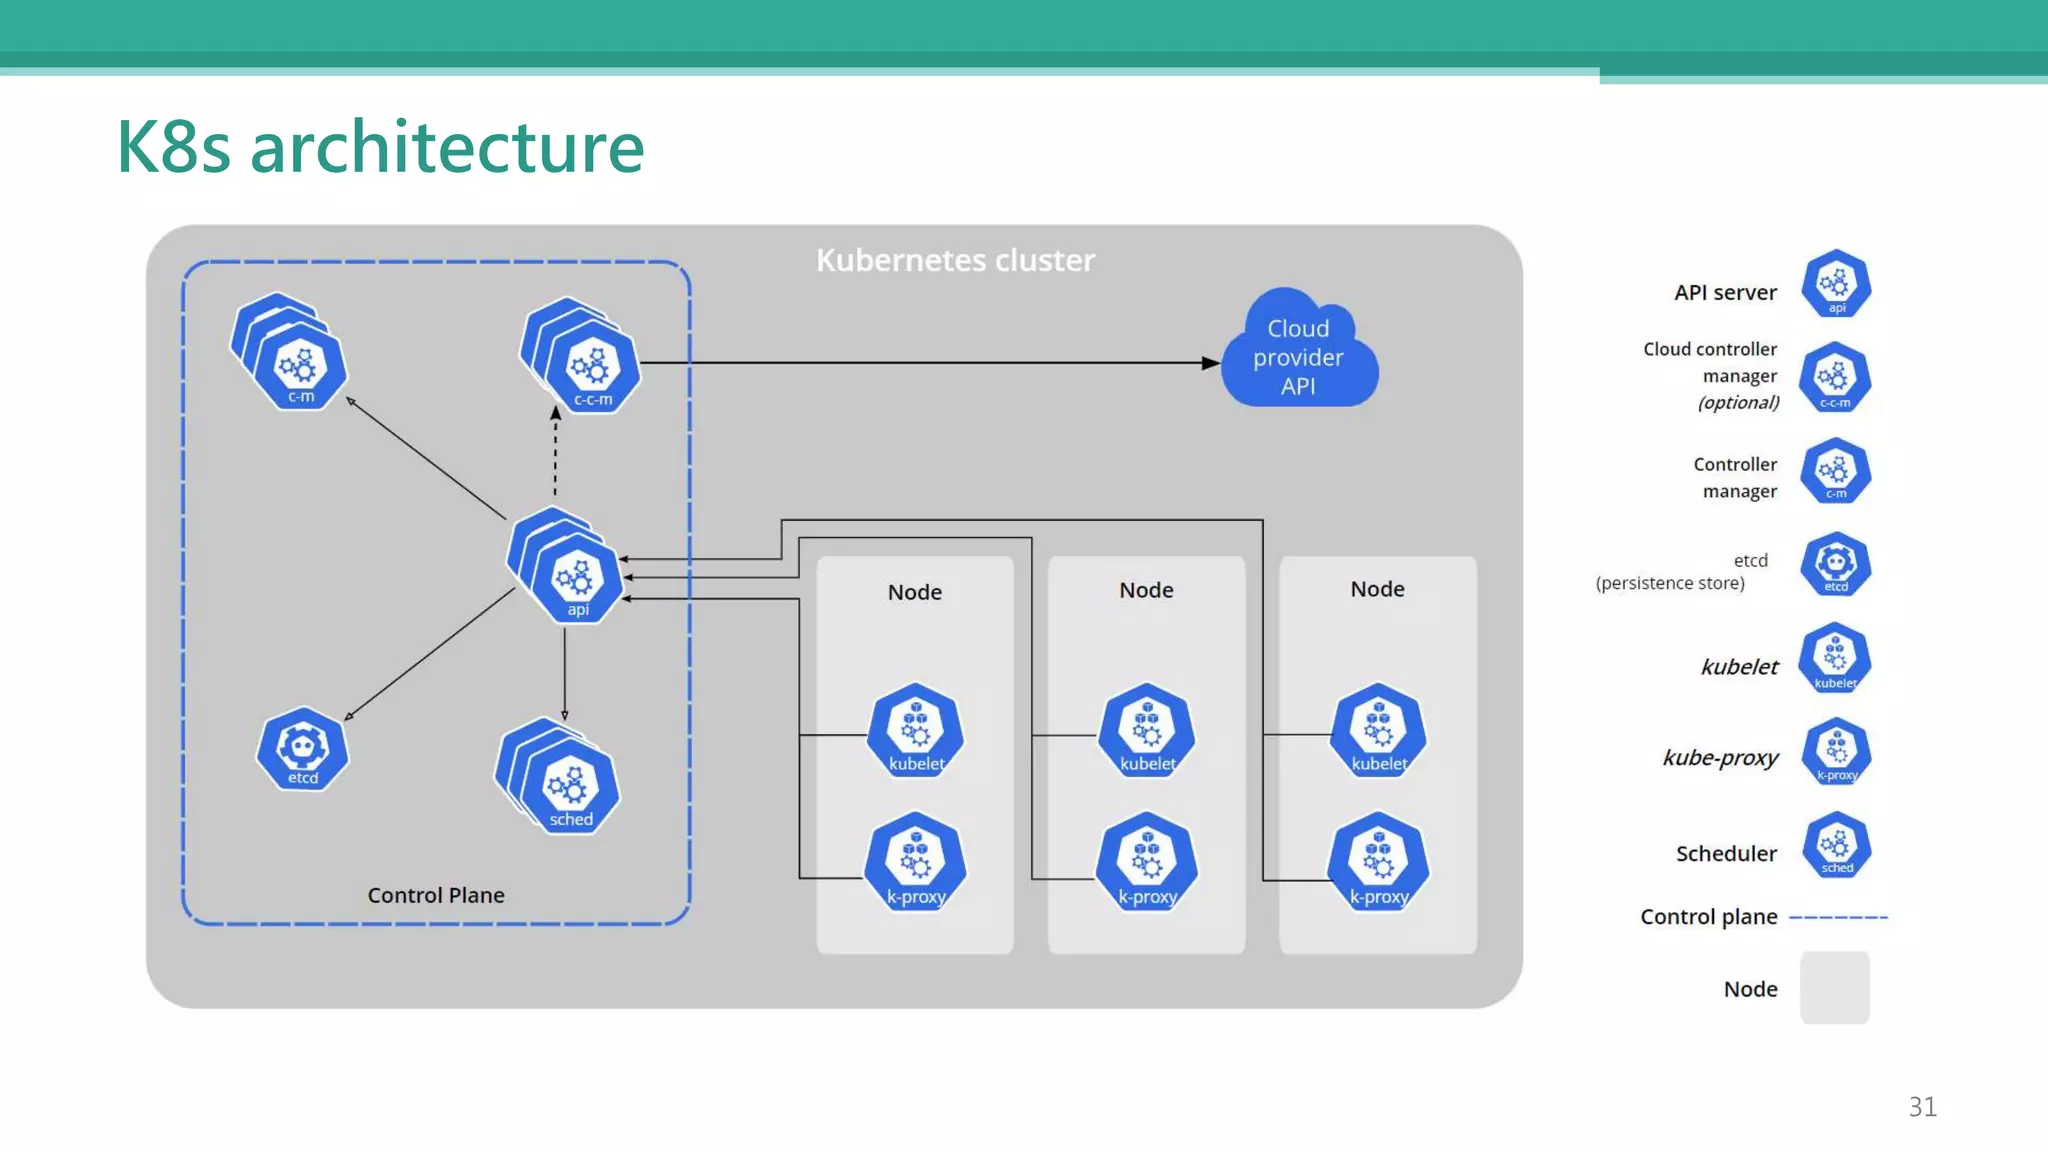
The Journey to the Kubernetes Metrics
智金處 智能系統部 黃晨懿
2021/12/22
1
Outline
• Scenario
• Kubernetes Monitoring Architecture
• Components details
• Conclusion
2
Scenario
• Monitoring cluster status at Grafana
• Check CPU and memory usage by kubectl top
3
example
Kubernetes Monitoring Architecture
4
source: https://github.com/kubernetes/design-proposals-archive/blob/main/instrumentation/monitoring_architecture.md
K8s architecture
5
source: https://github.com/kubernetes/design-proposals-archive/blob/main/instrumentation/monitoring_architecture.md
K8s architecture
6
Core metrics pipeline
Monitoring pipeline
Component details
7
kubectl top
• Check node and pod CPU and memory usage through CLI tool
provided by k8s
8
example
REST client: kubectl top -> API server
9
kubernetes/vendor/k8s.io/metrics/pkg/client/clientset/versioned/typed/metrics/v1beta1/nodemetrics.go
10
kubernetes/vendor/k8s.io/metrics/pkg/apis/metrics/types.go
API server
• Core component to communicate with k8s in control plane
• Expose Resource Metrics API to the following components
• kubectl top
• kube-scheduler
• HPA
• …
source: https://github.com/kubernetes/design-proposals-archive/blob/main/instrumentation/resource-metrics-api.md
11
metrics-server
• Store locally only latest values
• Expose the master metrics API
source: https://github.com/kubernetes-sigs/metrics-server
12
REST server: API server -> metrics-server
13
metrics-server/pkg/storage/node.go
metrics-server/pkg/storage/types.go
14
metrics-server/pkg/server/server.go
15
metrics-server/pkg/server/server.go
REST client: metrics-server -> kubelet
16
metrics-server/pkg/scraper/client/resource/client.go
Kubelet
• The daemon that runs on every kubernetes node and controls pod
and container lifecycle, among many other things.
• Combine container-level metrics form cAdvisor/CRI with the kubelets
knowledge of kubernetes constructs to produce the kubelet Summary
statistics.
source: https://github.com/kubernetes/design-proposals-archive/blob/main/instrumentation/core-metrics-pipeline.md
17
18
kubernetes/pkg/kubelet/kubelet.go
19
kubernetes/pkg/kubelet/stats/cri_stats_provider.go
gRPC client: kubelet -> CRI
20
kubernetes/pkg/kubelet/cri/remote/remote_runtime.go
Container Runtime Interface (CRI)
• The Container Runtime Interface designed to provide an abstraction
over runtimes (docker, rkt, etc).
• Consist of specs, protobuf API and libraries for container runtimes to
integrate with kubelet on a node
source:https://github.com/kubernetes/design-proposals-archive/blob/main/instrumentation/core-metrics-pipeline.md
21
gRPC client: kubelet -> CRI
22
kubernetes/pkg/kubelet/cri/remote/remote_runtime.go
23
containerd/vendor/k8s.io/cri-api/pkg/apis/runtime/v1/api.proto
gRPC server: kubelet -> containerd CRI
24
containerd/pkg/cri/server/container_stats_list.go
and it goes to Stats method…
25
containerd/runtime/v2/runc/v1/service.go
26
containerd/vendor/github.com/containerd/cgroups/cpuacct.go
Conclusion
27
source: https://github.com/kubernetes/design-proposals-archive/blob/main/instrumentation/monitoring_architecture.md
K8s architecture
28
Core metrics pipeline
Monitoring pipeline
• In Kubernetes Monitoring Architecture,
• Each component is responsible for producing, scraping and leveraging the
metrics
• Each component is communicated with API, such as RESTful API and gRPC
29
Backups
30
K8s architecture
31
32
cgroup
• cgroup core organizes processes hierarchically
• cgroup controller distributes system resources along the hierarchy in
a controlled and configurable manner.
• cgroup controllers:
• cpu
• memory
• …
source:https://www.kernel.org/doc/Documentation/cgroup-v1/cgroups.txt
33
source:https://www.kernel.org/doc/Documentation/cgroup-v1/cpuacct.txt
34
container = namespace + cgroup
example
35
container ID = cgroup ID
example
36
example

The journey to the kubernetes metrics