SlideShare a Scribd company logo
The Flu
                      (Graphing Data and Seeing Patterns)
Every year, the elementary and high school schools in Hometown have been hit by a
severe outbreak of influenza. The board of education is interested in taking action to
lessen the annual impacts of the flu. Several policies have been proposed:
•Closing the school before the flu virus reaches a peak
•Providing free vaccinations to teachers residing in the school district
•Provide free vaccinations to children residing in the school district
•Or doing nothing

Any of these options could prove costly both in real dollars and in terms of teacher or
student time missed from school. In addition, the vaccinations are known to have some
adverse side effects for some portion of the population. It has proven medically that this
particular flu strain last for 5 days.

Before making a decision on how to deal with their annual flu crises, the Board decided
to gather some data concerning the severity and timing of the problem. Unfortunately, the
board discovered that no systematic records of the severity of the flu have been kept on a
system-wide basis. The only available records are those of Mrs. Stewart, the school
nurse at the Maplewood School. Early in September, she began to notice that many
students were staying home from school. When they returned, they said that they had the
flu. Being a conscientious nurse, Mrs. Stewart had kept a careful record of recoveries
shown in the table below.

          Date Number of Recoveries            Date    Number of Recoveries
          Sept 4        0                     Sept. 25         18
               5        0                           26          4
               6        1                           27          3
               7        3                           28          3
               8        6                           29          2
             11        55                       Oct. 2          5
             12        37                            3          1
             13        39                            4          1
             14        38                            5          1
             15        38                            6          1
             18        74                            9          3
             19        17                           10          0
             20        14                           11          0
             21        11                           12          0
             22         9                           13          0
While it looks as if a large number of students recovered from the flu between September
11 and September 18, it is hard to see a clear pattern in these figures. Previously,
converting data from a table into a graph made it clearer. However, in this case, the graph
will show peaks. Why do these peaks occur? Why was the number of students returning
to school on September 18 so high?

The number of students recorded on that day, as having recovered from flu is 74, which is
significantly higher than the number recorded just before or after September 18. Only 17
students are marked as having recovered on September 19. How many are listed as
recovered for the day before the peak?

The table above does not show any information for either September 16 and 17. This
seems odd, but it does not explain the peak at September 18. There could be other
missing information in table above.

Guide Questions:

   1. How should data have been collected?
   2. Why is the data, when graphed appears distorted? Give explanations and cases
      where this can happen.
   3. How should the data appear when the missing information is supplied? Perform
      an adjustment on the data of recoveries.
   4. When did the students contract the flu?
   5. What was the total number of students sick with the flu? Compute the total
      number of sick persons for each day of the flu epidemic. Plot the total number of
      persons sick for each day.
   6. When did the maximum number of sick persons occur? What happened on the
      same day that the maximum number of persons was sick? Explain why.
   7. How many students got sick with the flu each day?
   8. How should the board address the problem? Give recommendations and their
      justifications.
   9. State the problem of the system (following SD approach)

More Related Content

What's hot

Mob programming and the power of flow agilejapan 2018
Mob programming and the power of flow agilejapan 2018Mob programming and the power of flow agilejapan 2018
Mob programming and the power of flow agilejapan 2018
Kenji Hiranabe
 
ปฏิทินรายเดือน
ปฏิทินรายเดือนปฏิทินรายเดือน
ปฏิทินรายเดือน
Pattaraporn Losukpul
 
ลัดดาวัลย์ No.36 d2
ลัดดาวัลย์ No.36 d2ลัดดาวัลย์ No.36 d2
งานปฏิทิน
งานปฏิทินงานปฏิทิน
งานปฏิทิน
atoy sukanya
 
ปฏิทินรายเดือน
ปฏิทินรายเดือนปฏิทินรายเดือน
ปฏิทินรายเดือน
siriporn srichai
 

What's hot (6)

Mob programming and the power of flow agilejapan 2018
Mob programming and the power of flow agilejapan 2018Mob programming and the power of flow agilejapan 2018
Mob programming and the power of flow agilejapan 2018
 
ปฏิทินรายเดือน
ปฏิทินรายเดือนปฏิทินรายเดือน
ปฏิทินรายเดือน
 
ลัดดาวัลย์ No.36 d2
ลัดดาวัลย์ No.36 d2ลัดดาวัลย์ No.36 d2
ลัดดาวัลย์ No.36 d2
 
งานปฏิทิน
งานปฏิทินงานปฏิทิน
งานปฏิทิน
 
ปฏิทินรายเดือน
ปฏิทินรายเดือนปฏิทินรายเดือน
ปฏิทินรายเดือน
 
E task week 4
E task week 4E task week 4
E task week 4
 

Viewers also liked

Verfication and validation of simulation models
Verfication and validation of simulation modelsVerfication and validation of simulation models
Verfication and validation of simulation models
De La Salle University-Manila
 
241233316 solution-manual-of-chapter-8-om
241233316 solution-manual-of-chapter-8-om241233316 solution-manual-of-chapter-8-om
241233316 solution-manual-of-chapter-8-om
Hashem Yahya Almahdi
 

Viewers also liked (13)

An Analysis Of The Dynamics Of Work In Process
An Analysis Of The Dynamics Of Work In ProcessAn Analysis Of The Dynamics Of Work In Process
An Analysis Of The Dynamics Of Work In Process
 
Sequential decisionmaking
Sequential decisionmakingSequential decisionmaking
Sequential decisionmaking
 
Going Down The Dogs
Going Down The DogsGoing Down The Dogs
Going Down The Dogs
 
Decision theory handouts
Decision theory handoutsDecision theory handouts
Decision theory handouts
 
Game theory problem set
Game theory problem setGame theory problem set
Game theory problem set
 
Verfication and validation of simulation models
Verfication and validation of simulation modelsVerfication and validation of simulation models
Verfication and validation of simulation models
 
Queuing problems
Queuing problemsQueuing problems
Queuing problems
 
Markov exercises
Markov exercisesMarkov exercises
Markov exercises
 
Decision theory Problems
Decision theory ProblemsDecision theory Problems
Decision theory Problems
 
Decision theory
Decision theoryDecision theory
Decision theory
 
Queueing theory
Queueing theoryQueueing theory
Queueing theory
 
241233316 solution-manual-of-chapter-8-om
241233316 solution-manual-of-chapter-8-om241233316 solution-manual-of-chapter-8-om
241233316 solution-manual-of-chapter-8-om
 
Game theory
Game theoryGame theory
Game theory
 

More from De La Salle University-Manila

Random variate generation
Random variate generationRandom variate generation
Random variate generation
De La Salle University-Manila
 
Random number generation
Random number generationRandom number generation
Random number generation
De La Salle University-Manila
 
Chapter3 general principles of discrete event simulation
Chapter3   general principles of discrete event simulationChapter3   general principles of discrete event simulation
Chapter3 general principles of discrete event simulationDe La Salle University-Manila
 
Validation and verification
Validation and verificationValidation and verification
Validation and verification
De La Salle University-Manila
 
Output analysis of a single model
Output analysis of a single modelOutput analysis of a single model
Output analysis of a single model
De La Salle University-Manila
 
Leverage Points In Increasing Order Of Effectiveness
Leverage Points In Increasing Order Of EffectivenessLeverage Points In Increasing Order Of Effectiveness
Leverage Points In Increasing Order Of EffectivenessDe La Salle University-Manila
 

More from De La Salle University-Manila (20)

Queueing theory
Queueing theoryQueueing theory
Queueing theory
 
Markov theory
Markov theoryMarkov theory
Markov theory
 
Decision theory blockwood
Decision theory blockwoodDecision theory blockwood
Decision theory blockwood
 
Decision theory
Decision theoryDecision theory
Decision theory
 
Random variate generation
Random variate generationRandom variate generation
Random variate generation
 
Random number generation
Random number generationRandom number generation
Random number generation
 
Monte carlo simulation
Monte carlo simulationMonte carlo simulation
Monte carlo simulation
 
Input modeling
Input modelingInput modeling
Input modeling
 
Conceptual modeling
Conceptual modelingConceptual modeling
Conceptual modeling
 
Chapter3 general principles of discrete event simulation
Chapter3   general principles of discrete event simulationChapter3   general principles of discrete event simulation
Chapter3 general principles of discrete event simulation
 
Comparison and evaluation of alternative designs
Comparison and evaluation of alternative designsComparison and evaluation of alternative designs
Comparison and evaluation of alternative designs
 
Chapter2
Chapter2Chapter2
Chapter2
 
Chapter1
Chapter1Chapter1
Chapter1
 
Variance reduction techniques (vrt)
Variance reduction techniques (vrt)Variance reduction techniques (vrt)
Variance reduction techniques (vrt)
 
Validation and verification
Validation and verificationValidation and verification
Validation and verification
 
Output analysis of a single model
Output analysis of a single modelOutput analysis of a single model
Output analysis of a single model
 
Building and simulating a model using dynamo
Building and simulating a model using dynamoBuilding and simulating a model using dynamo
Building and simulating a model using dynamo
 
Dynamo exercise population
Dynamo exercise  populationDynamo exercise  population
Dynamo exercise population
 
Leverage Points In Increasing Order Of Effectiveness
Leverage Points In Increasing Order Of EffectivenessLeverage Points In Increasing Order Of Effectiveness
Leverage Points In Increasing Order Of Effectiveness
 
Modeling Complex Sd
Modeling Complex SdModeling Complex Sd
Modeling Complex Sd
 

Recently uploaded

Ozempic: Preoperative Management of Patients on GLP-1 Receptor Agonists
Ozempic: Preoperative Management of Patients on GLP-1 Receptor Agonists  Ozempic: Preoperative Management of Patients on GLP-1 Receptor Agonists
Ozempic: Preoperative Management of Patients on GLP-1 Receptor Agonists
Saeid Safari
 
basicmodesofventilation2022-220313203758.pdf
basicmodesofventilation2022-220313203758.pdfbasicmodesofventilation2022-220313203758.pdf
basicmodesofventilation2022-220313203758.pdf
aljamhori teaching hospital
 
Sex determination from mandible pelvis and skull
Sex determination from mandible pelvis and skullSex determination from mandible pelvis and skull
Sex determination from mandible pelvis and skull
ShashankRoodkee
 
SURGICAL ANATOMY OF THE RETROPERITONEUM, ADRENALS, KIDNEYS AND URETERS.pptx
SURGICAL ANATOMY OF THE RETROPERITONEUM, ADRENALS, KIDNEYS AND URETERS.pptxSURGICAL ANATOMY OF THE RETROPERITONEUM, ADRENALS, KIDNEYS AND URETERS.pptx
SURGICAL ANATOMY OF THE RETROPERITONEUM, ADRENALS, KIDNEYS AND URETERS.pptx
Bright Chipili
 
Pharynx and Clinical Correlations BY Dr.Rabia Inam Gandapore.pptx
Pharynx and Clinical Correlations BY Dr.Rabia Inam Gandapore.pptxPharynx and Clinical Correlations BY Dr.Rabia Inam Gandapore.pptx
Pharynx and Clinical Correlations BY Dr.Rabia Inam Gandapore.pptx
Dr. Rabia Inam Gandapore
 
Identification and nursing management of congenital malformations .pptx
Identification and nursing management of congenital malformations .pptxIdentification and nursing management of congenital malformations .pptx
Identification and nursing management of congenital malformations .pptx
MGM SCHOOL/COLLEGE OF NURSING
 
Non-respiratory Functions of the Lungs.pdf
Non-respiratory Functions of the Lungs.pdfNon-respiratory Functions of the Lungs.pdf
Non-respiratory Functions of the Lungs.pdf
MedicoseAcademics
 
Pictures of Superficial & Deep Fascia.ppt.pdf
Pictures of Superficial & Deep Fascia.ppt.pdfPictures of Superficial & Deep Fascia.ppt.pdf
Pictures of Superficial & Deep Fascia.ppt.pdf
Dr. Rabia Inam Gandapore
 
Dehradun #ℂall #gIRLS Oyo Hotel 8107221448 #ℂall #gIRL in Dehradun
Dehradun #ℂall #gIRLS Oyo Hotel 8107221448 #ℂall #gIRL in DehradunDehradun #ℂall #gIRLS Oyo Hotel 8107221448 #ℂall #gIRL in Dehradun
Dehradun #ℂall #gIRLS Oyo Hotel 8107221448 #ℂall #gIRL in Dehradun
chandankumarsmartiso
 
Top-Vitamin-Supplement-Brands-in-India List
Top-Vitamin-Supplement-Brands-in-India ListTop-Vitamin-Supplement-Brands-in-India List
Top-Vitamin-Supplement-Brands-in-India List
SwisschemDerma
 
Knee anatomy and clinical tests 2024.pdf
Knee anatomy and clinical tests 2024.pdfKnee anatomy and clinical tests 2024.pdf
Knee anatomy and clinical tests 2024.pdf
vimalpl1234
 
Role of Mukta Pishti in the Management of Hyperthyroidism
Role of Mukta Pishti in the Management of HyperthyroidismRole of Mukta Pishti in the Management of Hyperthyroidism
Role of Mukta Pishti in the Management of Hyperthyroidism
Dr. Jyothirmai Paindla
 
Integrating Ayurveda into Parkinson’s Management: A Holistic Approach
Integrating Ayurveda into Parkinson’s Management: A Holistic ApproachIntegrating Ayurveda into Parkinson’s Management: A Holistic Approach
Integrating Ayurveda into Parkinson’s Management: A Holistic Approach
Ayurveda ForAll
 
263778731218 Abortion Clinic /Pills In Harare ,
263778731218 Abortion Clinic /Pills In Harare ,263778731218 Abortion Clinic /Pills In Harare ,
263778731218 Abortion Clinic /Pills In Harare ,
sisternakatoto
 
Vision-1.pptx, Eye structure, basics of optics
Vision-1.pptx, Eye structure, basics of opticsVision-1.pptx, Eye structure, basics of optics
Vision-1.pptx, Eye structure, basics of optics
Sai Sailesh Kumar Goothy
 
Ophthalmology Clinical Tests for OSCE exam
Ophthalmology Clinical Tests for OSCE examOphthalmology Clinical Tests for OSCE exam
Ophthalmology Clinical Tests for OSCE exam
KafrELShiekh University
 
Superficial & Deep Fascia of the NECK.pptx
Superficial & Deep Fascia of the NECK.pptxSuperficial & Deep Fascia of the NECK.pptx
Superficial & Deep Fascia of the NECK.pptx
Dr. Rabia Inam Gandapore
 
A Classical Text Review on Basavarajeeyam
A Classical Text Review on BasavarajeeyamA Classical Text Review on Basavarajeeyam
A Classical Text Review on Basavarajeeyam
Dr. Jyothirmai Paindla
 
Cervical & Brachial Plexus By Dr. RIG.pptx
Cervical & Brachial Plexus By Dr. RIG.pptxCervical & Brachial Plexus By Dr. RIG.pptx
Cervical & Brachial Plexus By Dr. RIG.pptx
Dr. Rabia Inam Gandapore
 
Thyroid Gland- Gross Anatomy by Dr. Rabia Inam Gandapore.pptx
Thyroid Gland- Gross Anatomy by Dr. Rabia Inam Gandapore.pptxThyroid Gland- Gross Anatomy by Dr. Rabia Inam Gandapore.pptx
Thyroid Gland- Gross Anatomy by Dr. Rabia Inam Gandapore.pptx
Dr. Rabia Inam Gandapore
 

Recently uploaded (20)

Ozempic: Preoperative Management of Patients on GLP-1 Receptor Agonists
Ozempic: Preoperative Management of Patients on GLP-1 Receptor Agonists  Ozempic: Preoperative Management of Patients on GLP-1 Receptor Agonists
Ozempic: Preoperative Management of Patients on GLP-1 Receptor Agonists
 
basicmodesofventilation2022-220313203758.pdf
basicmodesofventilation2022-220313203758.pdfbasicmodesofventilation2022-220313203758.pdf
basicmodesofventilation2022-220313203758.pdf
 
Sex determination from mandible pelvis and skull
Sex determination from mandible pelvis and skullSex determination from mandible pelvis and skull
Sex determination from mandible pelvis and skull
 
SURGICAL ANATOMY OF THE RETROPERITONEUM, ADRENALS, KIDNEYS AND URETERS.pptx
SURGICAL ANATOMY OF THE RETROPERITONEUM, ADRENALS, KIDNEYS AND URETERS.pptxSURGICAL ANATOMY OF THE RETROPERITONEUM, ADRENALS, KIDNEYS AND URETERS.pptx
SURGICAL ANATOMY OF THE RETROPERITONEUM, ADRENALS, KIDNEYS AND URETERS.pptx
 
Pharynx and Clinical Correlations BY Dr.Rabia Inam Gandapore.pptx
Pharynx and Clinical Correlations BY Dr.Rabia Inam Gandapore.pptxPharynx and Clinical Correlations BY Dr.Rabia Inam Gandapore.pptx
Pharynx and Clinical Correlations BY Dr.Rabia Inam Gandapore.pptx
 
Identification and nursing management of congenital malformations .pptx
Identification and nursing management of congenital malformations .pptxIdentification and nursing management of congenital malformations .pptx
Identification and nursing management of congenital malformations .pptx
 
Non-respiratory Functions of the Lungs.pdf
Non-respiratory Functions of the Lungs.pdfNon-respiratory Functions of the Lungs.pdf
Non-respiratory Functions of the Lungs.pdf
 
Pictures of Superficial & Deep Fascia.ppt.pdf
Pictures of Superficial & Deep Fascia.ppt.pdfPictures of Superficial & Deep Fascia.ppt.pdf
Pictures of Superficial & Deep Fascia.ppt.pdf
 
Dehradun #ℂall #gIRLS Oyo Hotel 8107221448 #ℂall #gIRL in Dehradun
Dehradun #ℂall #gIRLS Oyo Hotel 8107221448 #ℂall #gIRL in DehradunDehradun #ℂall #gIRLS Oyo Hotel 8107221448 #ℂall #gIRL in Dehradun
Dehradun #ℂall #gIRLS Oyo Hotel 8107221448 #ℂall #gIRL in Dehradun
 
Top-Vitamin-Supplement-Brands-in-India List
Top-Vitamin-Supplement-Brands-in-India ListTop-Vitamin-Supplement-Brands-in-India List
Top-Vitamin-Supplement-Brands-in-India List
 
Knee anatomy and clinical tests 2024.pdf
Knee anatomy and clinical tests 2024.pdfKnee anatomy and clinical tests 2024.pdf
Knee anatomy and clinical tests 2024.pdf
 
Role of Mukta Pishti in the Management of Hyperthyroidism
Role of Mukta Pishti in the Management of HyperthyroidismRole of Mukta Pishti in the Management of Hyperthyroidism
Role of Mukta Pishti in the Management of Hyperthyroidism
 
Integrating Ayurveda into Parkinson’s Management: A Holistic Approach
Integrating Ayurveda into Parkinson’s Management: A Holistic ApproachIntegrating Ayurveda into Parkinson’s Management: A Holistic Approach
Integrating Ayurveda into Parkinson’s Management: A Holistic Approach
 
263778731218 Abortion Clinic /Pills In Harare ,
263778731218 Abortion Clinic /Pills In Harare ,263778731218 Abortion Clinic /Pills In Harare ,
263778731218 Abortion Clinic /Pills In Harare ,
 
Vision-1.pptx, Eye structure, basics of optics
Vision-1.pptx, Eye structure, basics of opticsVision-1.pptx, Eye structure, basics of optics
Vision-1.pptx, Eye structure, basics of optics
 
Ophthalmology Clinical Tests for OSCE exam
Ophthalmology Clinical Tests for OSCE examOphthalmology Clinical Tests for OSCE exam
Ophthalmology Clinical Tests for OSCE exam
 
Superficial & Deep Fascia of the NECK.pptx
Superficial & Deep Fascia of the NECK.pptxSuperficial & Deep Fascia of the NECK.pptx
Superficial & Deep Fascia of the NECK.pptx
 
A Classical Text Review on Basavarajeeyam
A Classical Text Review on BasavarajeeyamA Classical Text Review on Basavarajeeyam
A Classical Text Review on Basavarajeeyam
 
Cervical & Brachial Plexus By Dr. RIG.pptx
Cervical & Brachial Plexus By Dr. RIG.pptxCervical & Brachial Plexus By Dr. RIG.pptx
Cervical & Brachial Plexus By Dr. RIG.pptx
 
Thyroid Gland- Gross Anatomy by Dr. Rabia Inam Gandapore.pptx
Thyroid Gland- Gross Anatomy by Dr. Rabia Inam Gandapore.pptxThyroid Gland- Gross Anatomy by Dr. Rabia Inam Gandapore.pptx
Thyroid Gland- Gross Anatomy by Dr. Rabia Inam Gandapore.pptx
 

The Flu

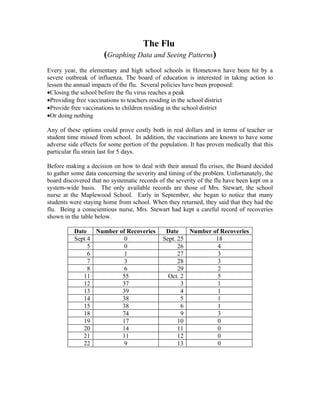
  • 1. The Flu (Graphing Data and Seeing Patterns) Every year, the elementary and high school schools in Hometown have been hit by a severe outbreak of influenza. The board of education is interested in taking action to lessen the annual impacts of the flu. Several policies have been proposed: •Closing the school before the flu virus reaches a peak •Providing free vaccinations to teachers residing in the school district •Provide free vaccinations to children residing in the school district •Or doing nothing Any of these options could prove costly both in real dollars and in terms of teacher or student time missed from school. In addition, the vaccinations are known to have some adverse side effects for some portion of the population. It has proven medically that this particular flu strain last for 5 days. Before making a decision on how to deal with their annual flu crises, the Board decided to gather some data concerning the severity and timing of the problem. Unfortunately, the board discovered that no systematic records of the severity of the flu have been kept on a system-wide basis. The only available records are those of Mrs. Stewart, the school nurse at the Maplewood School. Early in September, she began to notice that many students were staying home from school. When they returned, they said that they had the flu. Being a conscientious nurse, Mrs. Stewart had kept a careful record of recoveries shown in the table below. Date Number of Recoveries Date Number of Recoveries Sept 4 0 Sept. 25 18 5 0 26 4 6 1 27 3 7 3 28 3 8 6 29 2 11 55 Oct. 2 5 12 37 3 1 13 39 4 1 14 38 5 1 15 38 6 1 18 74 9 3 19 17 10 0 20 14 11 0 21 11 12 0 22 9 13 0
  • 2. While it looks as if a large number of students recovered from the flu between September 11 and September 18, it is hard to see a clear pattern in these figures. Previously, converting data from a table into a graph made it clearer. However, in this case, the graph will show peaks. Why do these peaks occur? Why was the number of students returning to school on September 18 so high? The number of students recorded on that day, as having recovered from flu is 74, which is significantly higher than the number recorded just before or after September 18. Only 17 students are marked as having recovered on September 19. How many are listed as recovered for the day before the peak? The table above does not show any information for either September 16 and 17. This seems odd, but it does not explain the peak at September 18. There could be other missing information in table above. Guide Questions: 1. How should data have been collected? 2. Why is the data, when graphed appears distorted? Give explanations and cases where this can happen. 3. How should the data appear when the missing information is supplied? Perform an adjustment on the data of recoveries. 4. When did the students contract the flu? 5. What was the total number of students sick with the flu? Compute the total number of sick persons for each day of the flu epidemic. Plot the total number of persons sick for each day. 6. When did the maximum number of sick persons occur? What happened on the same day that the maximum number of persons was sick? Explain why. 7. How many students got sick with the flu each day? 8. How should the board address the problem? Give recommendations and their justifications. 9. State the problem of the system (following SD approach)