Download to read offline


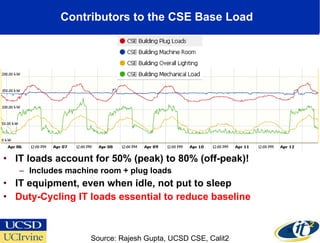


The document discusses the importance of energy-efficient cyberinfrastructure for mitigating climate change, highlighting its role in reducing greenhouse gas emissions. It reviews various projects aimed at improving energy efficiency in data centers, personal computers, and smart buildings, emphasizing the need for innovative approaches in university campuses as testbeds for greener solutions. Additionally, it outlines the significant growth of the ICT carbon footprint and the necessity for the sector to enhance energy efficiency to achieve substantial emissions reductions.


