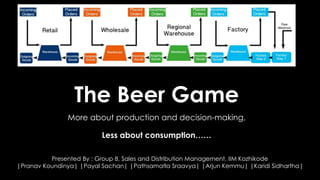
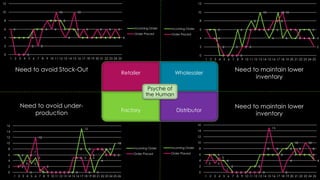
The Beer Game
More about production and decision-making,
Less about consumption……
Presented By : Group 8, Sales and Distribution Management, IIM Kozhikode
|Pranav Koundinya| |Payal Sachan| |Pathsamatla Sraavya| |Arjun Kemmu| |Karidi Sidhartha|
The Market
4 4 4 4 4
6 6 6
8 8 8 8
6 6 6
4 4 4 4 4 4 4 4 4 4
1 2 3 4 5 6 7 8 9 10 11 12 13 14 15 16 17 18 19 20 21 22 23 24 25
The Market
Mean 5.12
Median 4
Mode 4
Standard Deviation 1.53622915
Sample Variance 2.36
Kurtosis -0.509030956
Skewness 0.981453618
Range 4
Minimum 4
Maximum 8
Confidence Level(95.0%) 0.634124226
The receiver of market
information
RETAILER
The first point of contact
for market information
WHOLESALER
The factory-contact for
production information
DISTRIBUTOR
The manufacturer who
receives information, the last
FACTORY
6
4
4 1 0
Week 1
Week 3 Week 5
Week 7
Information Flow
Week 1
Week 1Week 3Week 5Week 7
Goods Flow
6600
Retailer Wholesaler
Factory Distributor
Psyche of
the Human
4 4 4 4 4
6 6 6
8 8 8 8
6 6 6
4 4 4 4 4 4 4 4 4 4
6
0 0 0
2
6
2
6
8
6
10
6
4
6
10
4
6
4 4
6
4
6
4
6
4
0
2
4
6
8
10
12
1 2 3 4 5 6 7 8 9 10 11 12 13 14 15 16 17 18 19 20 21 22 23 24 25
Incoming Order
Order Placed
6 6 6
0 0 0
2
6
2
6
8
6
10
6
4
6
10
4
6
4 4
6 6 6
4
6
4 4
2
0 0 0 0
2 2
6 6 6 6 6
8 8
10
6 6 6
4 4 4
2
0
2
4
6
8
10
12
1 2 3 4 5 6 7 8 9 10 11 12 13 14 15 16 17 18 19 20 21 22 23 24 25
Incoming Order
Order Placed
6 6 6
4 4
2
0 0 0 0
2 2
6 6 6 6 6
8 8
10
6 6 6 6
4
3
6
3
5
1
0 0 0 0 0 0 0 0
8
15
8
6
0
4
6
8
6
10
8
4
0
2
4
6
8
10
12
14
16
1 2 3 4 5 6 7 8 9 10 11 12 13 14 15 16 17 18 19 20 21 22 23 24 25
Incoming Order
Order Placed
6 6
3
6
3
5
1
0 0 0 0 0 0 0 0
8
15
8
6
0
4
6
8
6
10
2 2
3
0
7
12
0
2
0 0 0 0 0 0
5 5 5
0
5
8 8 8
6 6 6
0
2
4
6
8
10
12
14
16
1 2 3 4 5 6 7 8 9 10 11 12 13 14 15 16 17 18 19 20 21 22 23 24 25 26
Incoming Order
Order Placed
Need to avoid Stock-Out Need to maintain lower
inventory
Need to maintain lower
inventory
Need to avoid under-
production
4 4 4 4 4
6 6 6
8 8 8 8
6 6 6
4 4 4 4 4 4 4 4 4 4
6 6 6
0 0 0
2
6
2
6
8
6
10
6
4
6
10
4
6
4 4
6 6 6
4
6 6 6
4 4
2
0 0 0 0
2 2
6 6 6 6 6
8 8
10
6 6 6 6
4
6 6
3
6
3
5
1
0 0 0 0 0 0 0 0
8
15
8
6
0
4
6
8
6
10
1 2 3 4 5 6 7 8 9 10 11 12 13 14 15 16 17 18 19 20 21 22 23 24 25
Retailer Wholesaler Distributor Factory
Factory has
the biggest
incoming
order
The next
biggest order
is to the
distributor
Wholesaler is
also pressured
with bigger
orders
Evidence of Bull-Whip Effect
Incoming Orders
14
16
18
20
22
16
10
4
-2
-4
-10
-12
-10 -10 -10
-12
-10
-4
-6 -6
-10
-6
-2
0 0
12 12 12
18
24
28
30
26
24
18
10
4 4
-4
2 2
-6
-8 -8
-4
0
4 4 4 4
12 12 12
14
13
17
20
25
26 26
24
22
16
10
4
-2
-6
-2
7
5
4
-2
-4 -4
0
12 12
15
11
8
6
5
12
24 24
26 26 26 26 26
18
3
0
-1
5
1
0 0
2
0
1 2 3 4 5 6 7 8 9 10 11 12 13 14 15 16 17 18 19 20 21 22 23 24 25
Retailer Wholesaler Distributor Factory
Evidence of Bull-Whip Effect Factory
suffered highest
inventory for
long periods
Retailer was
most affected
by stock-outs
Inventory
Performance
14
16
18
20
22
16
10
4 4
8
20
24
20 20 20
24
20
8
12 12
20
12
4
0 0
12 12 12
18
24
28
30
26
24
18
10
4
10
14 14
2
18
16 16
8
0
4 4 4 4
12 12 12
14
13
17
20
25
26 26
24
22
16
10
4 4
12
4
7
5
4 4
8 8
0
12 12
15
11
8
6
5
12
24 24
26 26 26 26 26
18
3
0
2
5
1
0 0
2
0
1 2 3 4 5 6 7 8 9 10 11 12 13 14 15 16 17 18 19 20 21 22 23 24 25
Retailer Wholesaler Distributor Factory
Cost
Cost – Performance of stages
Week 5 – 9 : Retailer
Wholesaler and
Distributor reduced their
costs, causing factory
inventory to pile up
What clicked for Group 8 ?
Over ordering due to
fear of stock-outs
avoided
The team suffered severe stock-
outs which added to cost but
saved on the cost due to over
ordering that could have
multiplied
Bull-whip effect
reduced by ordering
‘Just-Enough’
The Maximum order(10) in the
Retailer stage was 2 Standard
Deviations(2.06) from the
mean(5.12)
Zero Stock Out
Performance of Factory
A Stock out in the factory would
have caused a further 2 week
delay down the chain and been
catastrophic for all stages
-5
0
5
10
15
20
25
30
0 10 20 30
6 6 6
0 0 0
2
6
2
6
8
6
10
6
4
6
10
4
6
4 4
6 6 6
4
1 2 3 4 5 6 7 8 9 10 11 12 13 14 15 16 17 18 19 20 21 22 23 24 25
What did not click for Group 8 ?
Unprecedented
Pressure on Factory
The Factory underwent long
periods of heavy inventory was
almost pushed to a stock-out at
the end!
Batch Ordering
The retailer, in anticipation of
smaller/bigger orders started
ordering Zeros followed by huge
quantities!
Severe Stock-outs
A stock out here has just twice
the cost of inventory, however in
a real scenario the cost of losing
a customer may be much higher
14
16
18
20
22
16
10
4
-2
-4
-10
-12
-10-10-10
-12
-10
-4
-6 -6
-10
-6
-2
0 0
1 2 3 4 5 6 7 8 9 10111213141516171819202122232425
6 6 6
0 0 0
2
6
2
6
8
6
10
6
4
6
10
4
6
4 4
6 6 6
4
1 2 3 4 5 6 7 8 9 10111213141516171819202122232425
1212
15
11
8
6 5
12
2424
2626262626
18
3
0 -1
5
1 0 0
2
0
1 2 3 4 5 6 7 8 9 10111213141516171819202122232425
Cost Breakup
348, 27%
332, 26%
309, 24%
290, 23%
Retailer Wholesaler Distributor Factory
120
228
Retailer
Inventory Stock-Outs
252
80
Wholesaler
Inventory Stock-Outs
252
80
Wholesaler
Inventory Stock-Outs
288
2
Factory
Inventory Stock-Outs
Total Cost = 1279 Units
Major Problems What IF ? ….
High Inventory Levels
Low Service Levels (Stock-Outs)
High Cost
Demand Fluctuations
We could bring the market
data directly to the factory
Introduce
consumer
bidding for
future
consumption
Maintain constant
inventory and order
levels among all stages
(except factory)
Develop a
separate channel
for spike orders
fulfilled directly
from factory
IS THIS WHAT THE
E-COMMERCE GIANTS
ARE DOING???

The Beer Game

  • 1.
    The Beer Game Moreabout production and decision-making, Less about consumption…… Presented By : Group 8, Sales and Distribution Management, IIM Kozhikode |Pranav Koundinya| |Payal Sachan| |Pathsamatla Sraavya| |Arjun Kemmu| |Karidi Sidhartha|
  • 2.
    The Market 4 44 4 4 6 6 6 8 8 8 8 6 6 6 4 4 4 4 4 4 4 4 4 4 1 2 3 4 5 6 7 8 9 10 11 12 13 14 15 16 17 18 19 20 21 22 23 24 25 The Market Mean 5.12 Median 4 Mode 4 Standard Deviation 1.53622915 Sample Variance 2.36 Kurtosis -0.509030956 Skewness 0.981453618 Range 4 Minimum 4 Maximum 8 Confidence Level(95.0%) 0.634124226
  • 3.
    The receiver ofmarket information RETAILER The first point of contact for market information WHOLESALER The factory-contact for production information DISTRIBUTOR The manufacturer who receives information, the last FACTORY 6 4 4 1 0 Week 1 Week 3 Week 5 Week 7 Information Flow Week 1 Week 1Week 3Week 5Week 7 Goods Flow 6600
  • 4.
    Retailer Wholesaler Factory Distributor Psycheof the Human 4 4 4 4 4 6 6 6 8 8 8 8 6 6 6 4 4 4 4 4 4 4 4 4 4 6 0 0 0 2 6 2 6 8 6 10 6 4 6 10 4 6 4 4 6 4 6 4 6 4 0 2 4 6 8 10 12 1 2 3 4 5 6 7 8 9 10 11 12 13 14 15 16 17 18 19 20 21 22 23 24 25 Incoming Order Order Placed 6 6 6 0 0 0 2 6 2 6 8 6 10 6 4 6 10 4 6 4 4 6 6 6 4 6 4 4 2 0 0 0 0 2 2 6 6 6 6 6 8 8 10 6 6 6 4 4 4 2 0 2 4 6 8 10 12 1 2 3 4 5 6 7 8 9 10 11 12 13 14 15 16 17 18 19 20 21 22 23 24 25 Incoming Order Order Placed 6 6 6 4 4 2 0 0 0 0 2 2 6 6 6 6 6 8 8 10 6 6 6 6 4 3 6 3 5 1 0 0 0 0 0 0 0 0 8 15 8 6 0 4 6 8 6 10 8 4 0 2 4 6 8 10 12 14 16 1 2 3 4 5 6 7 8 9 10 11 12 13 14 15 16 17 18 19 20 21 22 23 24 25 Incoming Order Order Placed 6 6 3 6 3 5 1 0 0 0 0 0 0 0 0 8 15 8 6 0 4 6 8 6 10 2 2 3 0 7 12 0 2 0 0 0 0 0 0 5 5 5 0 5 8 8 8 6 6 6 0 2 4 6 8 10 12 14 16 1 2 3 4 5 6 7 8 9 10 11 12 13 14 15 16 17 18 19 20 21 22 23 24 25 26 Incoming Order Order Placed Need to avoid Stock-Out Need to maintain lower inventory Need to maintain lower inventory Need to avoid under- production
  • 5.
    4 4 44 4 6 6 6 8 8 8 8 6 6 6 4 4 4 4 4 4 4 4 4 4 6 6 6 0 0 0 2 6 2 6 8 6 10 6 4 6 10 4 6 4 4 6 6 6 4 6 6 6 4 4 2 0 0 0 0 2 2 6 6 6 6 6 8 8 10 6 6 6 6 4 6 6 3 6 3 5 1 0 0 0 0 0 0 0 0 8 15 8 6 0 4 6 8 6 10 1 2 3 4 5 6 7 8 9 10 11 12 13 14 15 16 17 18 19 20 21 22 23 24 25 Retailer Wholesaler Distributor Factory Factory has the biggest incoming order The next biggest order is to the distributor Wholesaler is also pressured with bigger orders Evidence of Bull-Whip Effect Incoming Orders
  • 6.
    14 16 18 20 22 16 10 4 -2 -4 -10 -12 -10 -10 -10 -12 -10 -4 -6-6 -10 -6 -2 0 0 12 12 12 18 24 28 30 26 24 18 10 4 4 -4 2 2 -6 -8 -8 -4 0 4 4 4 4 12 12 12 14 13 17 20 25 26 26 24 22 16 10 4 -2 -6 -2 7 5 4 -2 -4 -4 0 12 12 15 11 8 6 5 12 24 24 26 26 26 26 26 18 3 0 -1 5 1 0 0 2 0 1 2 3 4 5 6 7 8 9 10 11 12 13 14 15 16 17 18 19 20 21 22 23 24 25 Retailer Wholesaler Distributor Factory Evidence of Bull-Whip Effect Factory suffered highest inventory for long periods Retailer was most affected by stock-outs Inventory Performance
  • 7.
    14 16 18 20 22 16 10 4 4 8 20 24 20 2020 24 20 8 12 12 20 12 4 0 0 12 12 12 18 24 28 30 26 24 18 10 4 10 14 14 2 18 16 16 8 0 4 4 4 4 12 12 12 14 13 17 20 25 26 26 24 22 16 10 4 4 12 4 7 5 4 4 8 8 0 12 12 15 11 8 6 5 12 24 24 26 26 26 26 26 18 3 0 2 5 1 0 0 2 0 1 2 3 4 5 6 7 8 9 10 11 12 13 14 15 16 17 18 19 20 21 22 23 24 25 Retailer Wholesaler Distributor Factory Cost Cost – Performance of stages Week 5 – 9 : Retailer Wholesaler and Distributor reduced their costs, causing factory inventory to pile up
  • 8.
    What clicked forGroup 8 ? Over ordering due to fear of stock-outs avoided The team suffered severe stock- outs which added to cost but saved on the cost due to over ordering that could have multiplied Bull-whip effect reduced by ordering ‘Just-Enough’ The Maximum order(10) in the Retailer stage was 2 Standard Deviations(2.06) from the mean(5.12) Zero Stock Out Performance of Factory A Stock out in the factory would have caused a further 2 week delay down the chain and been catastrophic for all stages -5 0 5 10 15 20 25 30 0 10 20 30 6 6 6 0 0 0 2 6 2 6 8 6 10 6 4 6 10 4 6 4 4 6 6 6 4 1 2 3 4 5 6 7 8 9 10 11 12 13 14 15 16 17 18 19 20 21 22 23 24 25
  • 9.
    What did notclick for Group 8 ? Unprecedented Pressure on Factory The Factory underwent long periods of heavy inventory was almost pushed to a stock-out at the end! Batch Ordering The retailer, in anticipation of smaller/bigger orders started ordering Zeros followed by huge quantities! Severe Stock-outs A stock out here has just twice the cost of inventory, however in a real scenario the cost of losing a customer may be much higher 14 16 18 20 22 16 10 4 -2 -4 -10 -12 -10-10-10 -12 -10 -4 -6 -6 -10 -6 -2 0 0 1 2 3 4 5 6 7 8 9 10111213141516171819202122232425 6 6 6 0 0 0 2 6 2 6 8 6 10 6 4 6 10 4 6 4 4 6 6 6 4 1 2 3 4 5 6 7 8 9 10111213141516171819202122232425 1212 15 11 8 6 5 12 2424 2626262626 18 3 0 -1 5 1 0 0 2 0 1 2 3 4 5 6 7 8 9 10111213141516171819202122232425
  • 10.
    Cost Breakup 348, 27% 332,26% 309, 24% 290, 23% Retailer Wholesaler Distributor Factory 120 228 Retailer Inventory Stock-Outs 252 80 Wholesaler Inventory Stock-Outs 252 80 Wholesaler Inventory Stock-Outs 288 2 Factory Inventory Stock-Outs Total Cost = 1279 Units
  • 11.
    Major Problems WhatIF ? …. High Inventory Levels Low Service Levels (Stock-Outs) High Cost Demand Fluctuations We could bring the market data directly to the factory Introduce consumer bidding for future consumption Maintain constant inventory and order levels among all stages (except factory) Develop a separate channel for spike orders fulfilled directly from factory IS THIS WHAT THE E-COMMERCE GIANTS ARE DOING???