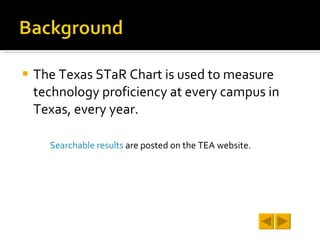
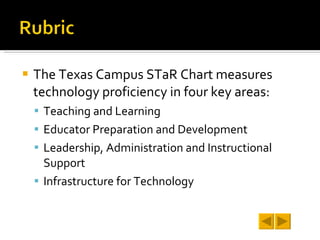
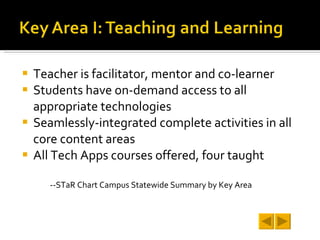
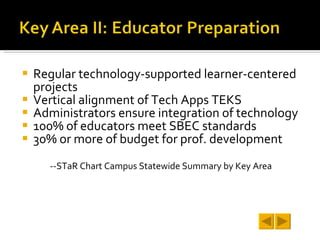
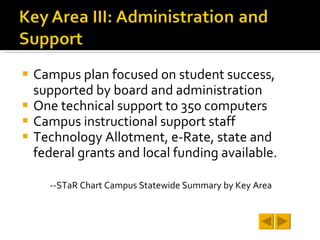
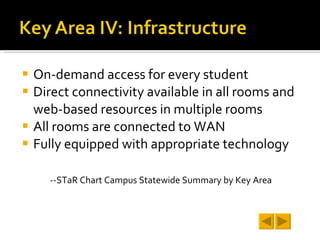
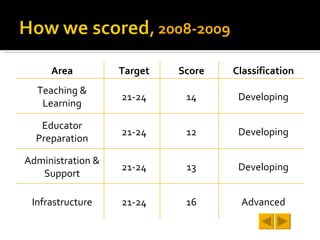
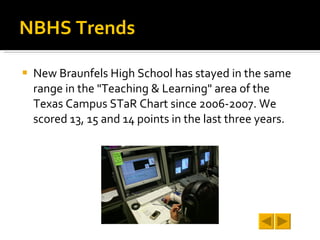
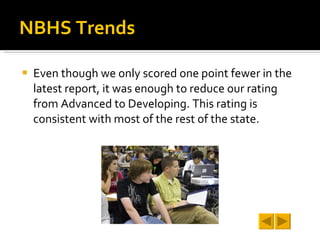
How does technology at NBHS compare with other high schools?
Background and purpose STaR Chart Rubric Goals of each Key Area How we scored Where we rank Trends Conclusion
“The goal [of education] must be to prepare young citizens to work and thrive in the 21 st  Century and to effectively interact in a global marketplace.”  --  Texas Long-Range Plan for Technology, 2006-2020
The Texas STaR Chart is used to measure technology proficiency at every campus in Texas, every year. Searchable results  are posted on the TEA website.
The Texas Campus STaR Chart measures technology proficiency in four key areas: Teaching and Learning Educator Preparation and Development Leadership, Administration and Instructional Support Infrastructure for Technology
Teacher is facilitator, mentor and co-learner Students have on-demand access to all appropriate technologies Seamlessly-integrated complete activities in all core content areas All Tech Apps courses offered, four taught --STaR Chart Campus Statewide Summary by Key Area
Regular technology-supported learner-centered projects Vertical alignment of Tech Apps TEKS Administrators ensure integration of technology 100% of educators meet SBEC standards 30% or more of budget for prof. development --STaR Chart Campus Statewide Summary by Key Area
Campus plan focused on student success, supported by board and administration One technical support to 350 computers Campus instructional support staff Technology Allotment, e-Rate, state and federal grants and local funding available. --STaR Chart Campus Statewide Summary by Key Area
On-demand access for every student Direct connectivity available in all rooms and web-based resources in multiple rooms All rooms are connected to WAN Fully equipped with appropriate technology --STaR Chart Campus Statewide Summary by Key Area
, 2008-2009 Classification Score Target Area Advanced 16 21-24 Infrastructure Developing 13 21-24 Administration & Support Developing 12 21-24 Educator Preparation Developing 14 21-24 Teaching & Learning
 
National Data collected by ATRL suggest a slightly inverse relationship between technology proficiency and learner-centered approaches.
National Two percent of students produce media, Web, or presentation products on a weekly basis.
State Texas reported that 29 percent of their districts met state definitions of “fully integrating technology” in school year 2005–06.
State In 2008, when last reported, .9 percent of schools met target in Teaching in Learning, .6 percent in Educator Preparation, 3.6 percent in Administration & Support and 6.7 percent in Infrastructure.
NBHS Trends New Braunfels High School has stayed in the same range in the "Teaching & Learning" area of the Texas Campus STaR Chart since 2006-2007. We scored 13, 15 and 14 points in the last three years.
NBHS Trends Even though we only scored one point fewer in the latest report, it was enough to reduce our rating from Advanced to Developing. This rating is consistent with most of the rest of the state.
New Braunfels High School should offer more professional development focusing on technology integration. The entire nation is lacking in this area, and it can't improve until education leaders make it a known, funded priority by offering a variety of learner-centered professional development. Based on data primarily from the Texas Campus STaR Chart and research conducted by ATRL and presented by Mary Burns.

Texas_STaR_Chart_Hearnsberger

  • 1.
    How does technologyat NBHS compare with other high schools?
  • 2.
    Background and purposeSTaR Chart Rubric Goals of each Key Area How we scored Where we rank Trends Conclusion
  • 3.
    “The goal [ofeducation] must be to prepare young citizens to work and thrive in the 21 st Century and to effectively interact in a global marketplace.” -- Texas Long-Range Plan for Technology, 2006-2020
  • 4.
    The Texas STaRChart is used to measure technology proficiency at every campus in Texas, every year. Searchable results are posted on the TEA website.
  • 5.
    The Texas CampusSTaR Chart measures technology proficiency in four key areas: Teaching and Learning Educator Preparation and Development Leadership, Administration and Instructional Support Infrastructure for Technology
  • 6.
    Teacher is facilitator,mentor and co-learner Students have on-demand access to all appropriate technologies Seamlessly-integrated complete activities in all core content areas All Tech Apps courses offered, four taught --STaR Chart Campus Statewide Summary by Key Area
  • 7.
    Regular technology-supported learner-centeredprojects Vertical alignment of Tech Apps TEKS Administrators ensure integration of technology 100% of educators meet SBEC standards 30% or more of budget for prof. development --STaR Chart Campus Statewide Summary by Key Area
  • 8.
    Campus plan focusedon student success, supported by board and administration One technical support to 350 computers Campus instructional support staff Technology Allotment, e-Rate, state and federal grants and local funding available. --STaR Chart Campus Statewide Summary by Key Area
  • 9.
    On-demand access forevery student Direct connectivity available in all rooms and web-based resources in multiple rooms All rooms are connected to WAN Fully equipped with appropriate technology --STaR Chart Campus Statewide Summary by Key Area
  • 10.
    , 2008-2009 ClassificationScore Target Area Advanced 16 21-24 Infrastructure Developing 13 21-24 Administration & Support Developing 12 21-24 Educator Preparation Developing 14 21-24 Teaching & Learning
  • 11.
  • 12.
    National Data collectedby ATRL suggest a slightly inverse relationship between technology proficiency and learner-centered approaches.
  • 13.
    National Two percentof students produce media, Web, or presentation products on a weekly basis.
  • 14.
    State Texas reportedthat 29 percent of their districts met state definitions of “fully integrating technology” in school year 2005–06.
  • 15.
    State In 2008,when last reported, .9 percent of schools met target in Teaching in Learning, .6 percent in Educator Preparation, 3.6 percent in Administration & Support and 6.7 percent in Infrastructure.
  • 16.
    NBHS Trends NewBraunfels High School has stayed in the same range in the "Teaching & Learning" area of the Texas Campus STaR Chart since 2006-2007. We scored 13, 15 and 14 points in the last three years.
  • 17.
    NBHS Trends Eventhough we only scored one point fewer in the latest report, it was enough to reduce our rating from Advanced to Developing. This rating is consistent with most of the rest of the state.
  • 18.
    New Braunfels HighSchool should offer more professional development focusing on technology integration. The entire nation is lacking in this area, and it can't improve until education leaders make it a known, funded priority by offering a variety of learner-centered professional development. Based on data primarily from the Texas Campus STaR Chart and research conducted by ATRL and presented by Mary Burns.