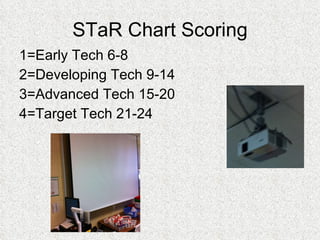
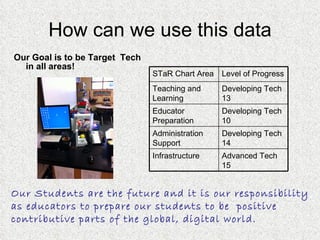
Texas STaR Chart Campus Summary  Hutchins Elementary 2009-2010 Working towards meaningful technology integration
Agenda Overview of each area of the STaR Chart Explanation of the scoring of the STaR Chart Review Hutchins results from the 2009-2010 STaR Chart Discuss how we use these results to boost technology integration as a campus For additional information:  STaR  Chart
Teaching and Learning The area of teaching and learning includes: * Using digital content in the instructional setting * Connecting content areas * Implementing the Technology Application TEKS  * Student mastery of Technology Application TEKS * Online learning
Educator Preparation and Development The area of Educator Preparation and Development includes: *Professional Development Experiences *Models of Professional Development *Capabilities of Educators *Technology Professional Development Participation *Levels of Understanding and Patterns of Use *Capabilities of Educators with Online Learning
Leadership, Administration, and Instructional Support The area of Leadership, Administration, and Instructional Support includes: *Leadership and Vision *Planning *Instructional Support *Communication and Collaboration *Budget *Leadership and Support for Online Learning
Infrastructure for Technology The area of infrastructure includes: *Students per classroom computers *Internet Connectivity Speed *Classroom Technology *Local Area Network Wide Network *Distance Learning Capacity
STaR Chart Scoring 1=Early Tech 6-8 2=Developing Tech 9-14 3=Advanced Tech 15-20 4=Target Tech 21-24
How can we use this data Our Goal is to be Target  Tech in all areas! Our Students are the future and it is our responsibility as educators to prepare our students to be  positive contributive parts of the global, digital world.  Advanced Tech 15 Infrastructure Developing Tech 14 Administration Support Developing Tech 10 Educator Preparation Developing Tech 13 Teaching and Learning Level of Progress STaR Chart Area

S ta r chart

  • 1.
    Texas STaR ChartCampus Summary Hutchins Elementary 2009-2010 Working towards meaningful technology integration
  • 2.
    Agenda Overview ofeach area of the STaR Chart Explanation of the scoring of the STaR Chart Review Hutchins results from the 2009-2010 STaR Chart Discuss how we use these results to boost technology integration as a campus For additional information: STaR Chart
  • 3.
    Teaching and LearningThe area of teaching and learning includes: * Using digital content in the instructional setting * Connecting content areas * Implementing the Technology Application TEKS * Student mastery of Technology Application TEKS * Online learning
  • 4.
    Educator Preparation andDevelopment The area of Educator Preparation and Development includes: *Professional Development Experiences *Models of Professional Development *Capabilities of Educators *Technology Professional Development Participation *Levels of Understanding and Patterns of Use *Capabilities of Educators with Online Learning
  • 5.
    Leadership, Administration, andInstructional Support The area of Leadership, Administration, and Instructional Support includes: *Leadership and Vision *Planning *Instructional Support *Communication and Collaboration *Budget *Leadership and Support for Online Learning
  • 6.
    Infrastructure for TechnologyThe area of infrastructure includes: *Students per classroom computers *Internet Connectivity Speed *Classroom Technology *Local Area Network Wide Network *Distance Learning Capacity
  • 7.
    STaR Chart Scoring1=Early Tech 6-8 2=Developing Tech 9-14 3=Advanced Tech 15-20 4=Target Tech 21-24
  • 8.
    How can weuse this data Our Goal is to be Target Tech in all areas! Our Students are the future and it is our responsibility as educators to prepare our students to be positive contributive parts of the global, digital world. Advanced Tech 15 Infrastructure Developing Tech 14 Administration Support Developing Tech 10 Educator Preparation Developing Tech 13 Teaching and Learning Level of Progress STaR Chart Area