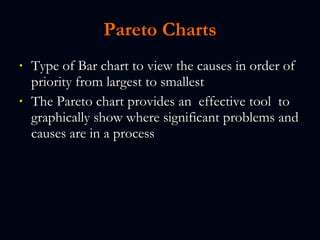
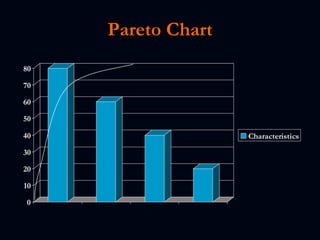
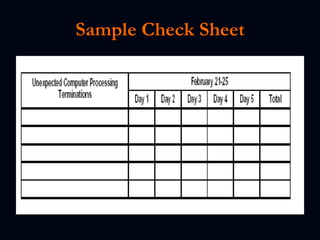
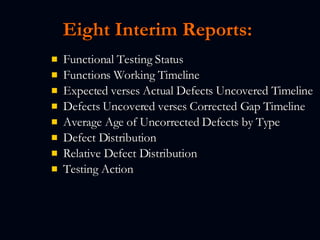
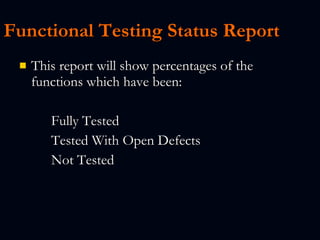
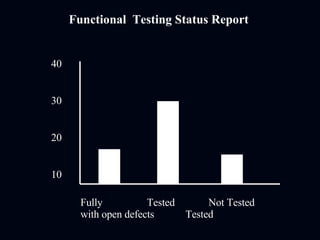
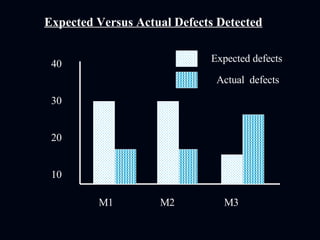
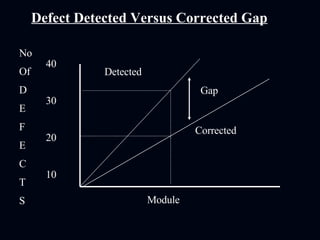
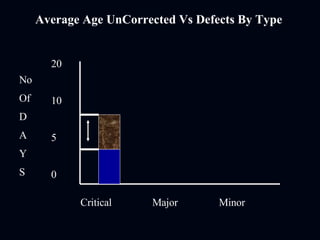
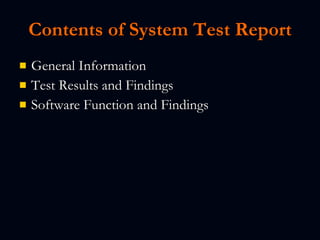
Test Reporting
Test Tools  To Build Test Reports
Test Tools Testers use many different tools to help in analyzing the results of testing and to create the information contained in the test reports.
Test Tools Pareto Charts Cause Effect Diagram Check Sheet
Pareto Charts Type of Bar chart to view the causes in order of priority from largest to smallest The Pareto chart provides an  effective tool  to graphically show where significant problems and causes are in a process
Pareto Chart
Cause Effect Diagram A team tool used to help identify the causes of problems related to processes, products and  services. This technique keeps teams focused on a problem and potential causes. By better understanding problems within the work processes, teams can reach probable and root causes of a problem.
Cause Effect Diagram(Fishbone Diagram)
Check Sheet A check sheet is a technique or tool to record the number of occurrences over a specified interval of time; a data sample to determine the frequency of an event. The recording of data, survey, or sample is to support or validate objectively the significance of the event. This usually follows the Pareto analysis and cause and effect diagram to validate and verify a problem or cause.
Sample Check Sheet
Reporting Test Results
Eight Interim Reports:   Functional Testing Status  Functions Working Timeline Expected verses Actual Defects Uncovered Timeline Defects Uncovered verses Corrected Gap Timeline Average Age of Uncorrected Defects by Type Defect Distribution Relative Defect Distribution Testing Action
Functional Testing Status Report   This report will show percentages of the functions which have been: Fully Tested Tested With Open Defects Not Tested
Functional  Testing Status Report 40 30 20 10 Fully  Tested Not Tested  with open defects  Tested
Functions Working Timeline   This report will show the actual plan to have all functions working verses the current status of functions working. An ideal format could be a line graph.
40 30 20 10 Functions Working Timeline Jan Feb Mar Timeline Actual Status Current Status
Expected verses Actual Defects Detected   This report will provide an analysis between the number of defects being generated against the expected number of defects expected from the planning stage.
Expected Versus Actual Defects Detected 40 30 20 10 M1   M2   M3 Expected defects Actual  defects
Defects Detected verses Corrected Gap   This report, ideally in a line graph format, will show the number of defects uncovered verses the number of defects being corrected and accepted by the testing group. If the gap grows too large, the project may not be ready when originally planned.
40 30 20 10 Defect Detected Versus Corrected Gap Module Detected Corrected No Of  D E F E C T S Gap
Average Age Uncorrected Defects by Type   This report will show the average days of outstanding defects by type (Sev 1, Sev 2, etc.).  In the planning stage, it is beneficial to determine the acceptable open days by defect type.
Average Age UnCorrected Vs Defects By Type 20 10 5 0 Critical   Major    Minor No Of  D A Y S
Defect Distribution   This report will show the defect distribution by function or module.  It can also show items such as numbers of tests completed.
Defect Distribution  40 30 20 10 M1   M2   M3 No Of  D E F E C T S 15 30 20
Relative Defect Distribution   This report will take the previous report (Defect Distribution) and normalize the level of defects.   An example would be one application might be more in depth than another, and would probably have a higher level of defects. However, when normalized over the number of functions or lines of code, would show a more accurate level of defects.
Testing Action   This report can show many different things, including possible shortfalls in testing.   Examples of data to show might be number of Sev 1 defects, tests that are behind schedule, and other information that would present an accurate testing picture.
Final Test Report s Test reports should be prepared at the conclusion of each level of testing. This might include: Unit Test Report Integration Test Report System Test Report Acceptance Test Report  
Unit Test Report
Integration Test Report
Contents of System Test Report General Information Test Results and Findings Software Function and Findings

Test Reports

  • 1.
  • 2.
    Test Tools To Build Test Reports
  • 3.
    Test Tools Testersuse many different tools to help in analyzing the results of testing and to create the information contained in the test reports.
  • 4.
    Test Tools ParetoCharts Cause Effect Diagram Check Sheet
  • 5.
    Pareto Charts Typeof Bar chart to view the causes in order of priority from largest to smallest The Pareto chart provides an effective tool to graphically show where significant problems and causes are in a process
  • 6.
  • 7.
    Cause Effect DiagramA team tool used to help identify the causes of problems related to processes, products and services. This technique keeps teams focused on a problem and potential causes. By better understanding problems within the work processes, teams can reach probable and root causes of a problem.
  • 8.
  • 9.
    Check Sheet Acheck sheet is a technique or tool to record the number of occurrences over a specified interval of time; a data sample to determine the frequency of an event. The recording of data, survey, or sample is to support or validate objectively the significance of the event. This usually follows the Pareto analysis and cause and effect diagram to validate and verify a problem or cause.
  • 10.
  • 11.
  • 12.
    Eight Interim Reports: Functional Testing Status  Functions Working Timeline Expected verses Actual Defects Uncovered Timeline Defects Uncovered verses Corrected Gap Timeline Average Age of Uncorrected Defects by Type Defect Distribution Relative Defect Distribution Testing Action
  • 13.
    Functional Testing StatusReport This report will show percentages of the functions which have been: Fully Tested Tested With Open Defects Not Tested
  • 14.
    Functional TestingStatus Report 40 30 20 10 Fully Tested Not Tested with open defects Tested
  • 15.
    Functions Working Timeline This report will show the actual plan to have all functions working verses the current status of functions working. An ideal format could be a line graph.
  • 16.
    40 30 2010 Functions Working Timeline Jan Feb Mar Timeline Actual Status Current Status
  • 17.
    Expected verses ActualDefects Detected This report will provide an analysis between the number of defects being generated against the expected number of defects expected from the planning stage.
  • 18.
    Expected Versus ActualDefects Detected 40 30 20 10 M1 M2 M3 Expected defects Actual defects
  • 19.
    Defects Detected versesCorrected Gap This report, ideally in a line graph format, will show the number of defects uncovered verses the number of defects being corrected and accepted by the testing group. If the gap grows too large, the project may not be ready when originally planned.
  • 20.
    40 30 2010 Defect Detected Versus Corrected Gap Module Detected Corrected No Of D E F E C T S Gap
  • 21.
    Average Age UncorrectedDefects by Type This report will show the average days of outstanding defects by type (Sev 1, Sev 2, etc.). In the planning stage, it is beneficial to determine the acceptable open days by defect type.
  • 22.
    Average Age UnCorrectedVs Defects By Type 20 10 5 0 Critical Major Minor No Of D A Y S
  • 23.
    Defect Distribution This report will show the defect distribution by function or module. It can also show items such as numbers of tests completed.
  • 24.
    Defect Distribution 40 30 20 10 M1 M2 M3 No Of D E F E C T S 15 30 20
  • 25.
    Relative Defect Distribution This report will take the previous report (Defect Distribution) and normalize the level of defects.   An example would be one application might be more in depth than another, and would probably have a higher level of defects. However, when normalized over the number of functions or lines of code, would show a more accurate level of defects.
  • 26.
    Testing Action This report can show many different things, including possible shortfalls in testing.   Examples of data to show might be number of Sev 1 defects, tests that are behind schedule, and other information that would present an accurate testing picture.
  • 27.
    Final Test Reports Test reports should be prepared at the conclusion of each level of testing. This might include: Unit Test Report Integration Test Report System Test Report Acceptance Test Report  
  • 28.
  • 29.
  • 30.
    Contents of SystemTest Report General Information Test Results and Findings Software Function and Findings