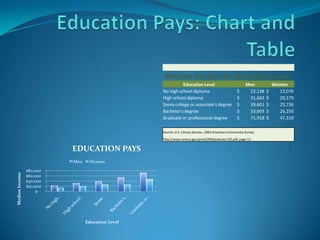
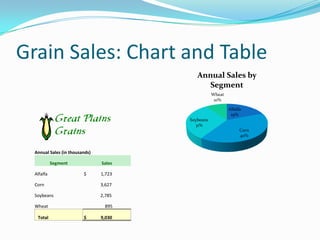
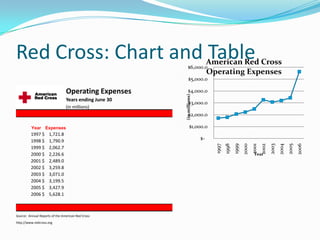
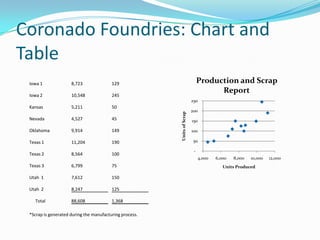
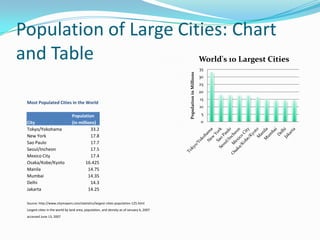
Roberto Hernandez
     Period 3
Survey From Google Form
             Baseball   Basketball     Football     Soccer   Volleyball


                                     16% 8%
                                              24%

                                36%
                                          16%


Baseball     2


Basketball   6


Football     4


Soccer       9


Volleyball   4
Median Income by Education Level
                                                            Education Level                           Men           Women
                                                  No high school diploma                         $     22,138   $     13,076
                                                  High school diploma                            $     31,683   $     20,179
                                                  Some college or associate's degree             $     39,601   $     25,736
                                                  Bachelor's degree                              $     53,693   $     26,250
                                                  Graduate or professional degree                $     71,918   $     47,319

                                                  Source: U.S. Census Bureau, 2005 American Community Survey
                                                  http://www.census.gov/prod/2006pubs/acs-02.pdf, page 13

                          EDUCATION PAYS
                          Men    Women

                $80,000
Median Income


                $60,000
                $40,000
                $20,000
                     $-


                                Education Level
Grain Sales: Chart and Table
                                           Annual Sales by
                                             Segment
                                                   Wheat
                                                    10%

                                                           Alfalfa
                                                            19%
                                        Soybeans
                                          31%
                                                                 Corn
                                                                 40%


  Annual Sales (in thousands)

            Segment             Sales

  Alfalfa                $      1,723

  Corn                          3,627

  Soybeans                      2,785

  Wheat                          895

   Total                 $      9,030
Red Cross: Chart and Table                                 $6,000.0
                                                                            American Red Cross
                                                                            Operating Expenses
                                                            $5,000.0

                                Operating Expenses         $4,000.0


                                                       (in millions)
                                Years ending June 30
                                                            $3,000.0
                                (in millions)
                                                            $2,000.0

          Year Expenses                                        $1,000.0
         1997 $      1,721.8
         1998 $      1,790.9                                           $-


                                                                                            1999
                                                                              1997
                                                                                     1998


                                                                                                                               2004


                                                                                                                                             2006
                                                                                                   2000


                                                                                                                 2002
                                                                                                                        2003


                                                                                                                                      2005
                                                                                                          2001
         1999 $      2,062.7
         2000 $      2,226.6                                                                               Year
         2001 $      2,489.0
         2002 $      3,259.8
         2003 $      3,071.0
         2004 $      3,199.5
         2005 $      3,427.9
         2006 $      5,628.1


Source: Annual Reports of the American Red Cross
http://www.redcross.org
Coronado Foundries: Chart and
Table
 Iowa 1              8,723               129                                   Production and Scrap
                                                                                     Report
 Iowa 2              10,548              245
                                                                          250
 Kansas              5,211               50
                                                                          200


                                                         Units of Scrap
 Nevada              4,527               45                               150

 Oklahoma            9,914               149                              100

 Texas 1             11,204              190                               50

                                                                           -
 Texas 2             8,564               100
                                                                               4,000   6,000   8,000   10,000   12,000
 Texas 3             6,799               75                                               Units Produced

 Utah 1              7,612               150

 Utah 2              8,247               125

   Total             88,608              1,368

 *Scrap is generated during the manufacturing process.
Population of Large Cities: Chart
and Table                                                                                                           World's 10 Largest Cities
                                                                                                                    35


                                                                                           Population in Millions
                                                                                                                    30
                                                                                                                    25
                                                                                                                    20
                                                                                                                    15
 Most Populated Cities in the World
                                                                                                                    10

                                Population                                                                           5
 City                           (in millions)                                                                       0
 Tokyo/Yokohama                           33.2
 New York                                 17.8
 Sao Paulo                                17.7
 Seoul/Incheon                            17.5
 Mexico City                              17.4
 Osaka/Kobe/Kyoto                       16.425
 Manila                                  14.75
 Mumbai                                  14.35
 Delhi                                    14.3
 Jakarta                                 14.25

 Source: http://www.citymayors.com/statistics/largest-cities-population-125.html
 Largest cities in the world by land area, population, and density as of January 6, 2007
 accessed June 13, 2007
Running Times: Chart and Table
                                                        36

                                                       35.5


                                     Time in Minutes
                                                        35

Running Times                                          34.5
10-Week Workout Program
                                                        34

     Week             Time                             33.5
               1              35.5
                                                        33
               2             35.25
                                                              1   2   3   4   5  6   7   8   9   10
               3             35.25                                            Week
               4               35
               5             35.25
               6             34.75
               7              34.5
               8             34.15
               9             34.25
              10               34
Family Expenses: Chart and Table
                 MONTHLY CASH FLOW

Sources of
Income
              $
Salary        3,200
                                     Entertain
Expenses
                                       ment         Where Our Money
Housing       975                       8%
                                          Savings
                                                         Goes
Groceries     315
                                            11%
Taxes         275                    Insurance                       Housing
                                        5%                            36%
Utilities     300

Contributions 200                                Utilities
                                                   11%       Taxes Groceries
Insurance     125
                                                              10%    12%
Savings       300                    Contribut
                                       ions
Entertainment 225
 Total Uses of $
                                        7%
Cash           2,715

Surplus          $485
McDonald’s Restaurants: Chart and
 Table
                                                                   Total Restaurants
                                                                            Company
                                                                            operated
                                                                            Franchises

                                                                            Affiliated


                                                                      13%
                                                                                    28%
            McDonald's Corporation
                 Restaurants                                           59%
Company operated       8,785
Franchises            18,687
Affiliated             4,195
   Total              31,667

Source: McDonald's Corporation 2006 Annual Report
http://www.mcdonalds.com/corp/invest/pub/2006_Annual_Report.html
Study and Grades Chart andBetween
                   Relationship
                                Table
                                                                 Exam Grades and Study
 Relationship of Study Time to Test Grades
                                                                         Time
                                                           100
   Student   Study Time Test Grade
                                                            95
 Anderson            5.25          87
                                                            90
 Block                  1          56
                                                            85


                                             Exam Grades
 Chen                5.25          95
                                                            80
 Davis               3.25          64                       75
 Evans                4.5          75                       70
 Franks                 4          74                       65
 Gomez               4.25          78                       60
 Herrera             4.75          88                       55
 Ingram               5.5          94                       50
 Johnson              0.5          66                            0   1   2       3    4       5   6   7
 Kyle                   3          76
 Langford            3.75          75                                        Hours of Study
 Montrose            3.25          74
 Newman               5.5          84
 Ross                 4.5          85
 Theisen                6          90
 Williams            2.25          61
 Wong                5.75          91

Lesson 8 presentation

  • 1.
  • 2.
    Survey From GoogleForm Baseball Basketball Football Soccer Volleyball 16% 8% 24% 36% 16% Baseball 2 Basketball 6 Football 4 Soccer 9 Volleyball 4
  • 3.
    Median Income byEducation Level Education Level Men Women No high school diploma $ 22,138 $ 13,076 High school diploma $ 31,683 $ 20,179 Some college or associate's degree $ 39,601 $ 25,736 Bachelor's degree $ 53,693 $ 26,250 Graduate or professional degree $ 71,918 $ 47,319 Source: U.S. Census Bureau, 2005 American Community Survey http://www.census.gov/prod/2006pubs/acs-02.pdf, page 13 EDUCATION PAYS Men Women $80,000 Median Income $60,000 $40,000 $20,000 $- Education Level
  • 4.
    Grain Sales: Chartand Table Annual Sales by Segment Wheat 10% Alfalfa 19% Soybeans 31% Corn 40% Annual Sales (in thousands) Segment Sales Alfalfa $ 1,723 Corn 3,627 Soybeans 2,785 Wheat 895 Total $ 9,030
  • 5.
    Red Cross: Chartand Table $6,000.0 American Red Cross Operating Expenses $5,000.0 Operating Expenses $4,000.0 (in millions) Years ending June 30 $3,000.0 (in millions) $2,000.0 Year Expenses $1,000.0 1997 $ 1,721.8 1998 $ 1,790.9 $- 1999 1997 1998 2004 2006 2000 2002 2003 2005 2001 1999 $ 2,062.7 2000 $ 2,226.6 Year 2001 $ 2,489.0 2002 $ 3,259.8 2003 $ 3,071.0 2004 $ 3,199.5 2005 $ 3,427.9 2006 $ 5,628.1 Source: Annual Reports of the American Red Cross http://www.redcross.org
  • 6.
    Coronado Foundries: Chartand Table Iowa 1 8,723 129 Production and Scrap Report Iowa 2 10,548 245 250 Kansas 5,211 50 200 Units of Scrap Nevada 4,527 45 150 Oklahoma 9,914 149 100 Texas 1 11,204 190 50 - Texas 2 8,564 100 4,000 6,000 8,000 10,000 12,000 Texas 3 6,799 75 Units Produced Utah 1 7,612 150 Utah 2 8,247 125 Total 88,608 1,368 *Scrap is generated during the manufacturing process.
  • 7.
    Population of LargeCities: Chart and Table World's 10 Largest Cities 35 Population in Millions 30 25 20 15 Most Populated Cities in the World 10 Population 5 City (in millions) 0 Tokyo/Yokohama 33.2 New York 17.8 Sao Paulo 17.7 Seoul/Incheon 17.5 Mexico City 17.4 Osaka/Kobe/Kyoto 16.425 Manila 14.75 Mumbai 14.35 Delhi 14.3 Jakarta 14.25 Source: http://www.citymayors.com/statistics/largest-cities-population-125.html Largest cities in the world by land area, population, and density as of January 6, 2007 accessed June 13, 2007
  • 8.
    Running Times: Chartand Table 36 35.5 Time in Minutes 35 Running Times 34.5 10-Week Workout Program 34 Week Time 33.5 1 35.5 33 2 35.25 1 2 3 4 5 6 7 8 9 10 3 35.25 Week 4 35 5 35.25 6 34.75 7 34.5 8 34.15 9 34.25 10 34
  • 9.
    Family Expenses: Chartand Table MONTHLY CASH FLOW Sources of Income $ Salary 3,200 Entertain Expenses ment Where Our Money Housing 975 8% Savings Goes Groceries 315 11% Taxes 275 Insurance Housing 5% 36% Utilities 300 Contributions 200 Utilities 11% Taxes Groceries Insurance 125 10% 12% Savings 300 Contribut ions Entertainment 225 Total Uses of $ 7% Cash 2,715 Surplus $485
  • 10.
    McDonald’s Restaurants: Chartand Table Total Restaurants Company operated Franchises Affiliated 13% 28% McDonald's Corporation Restaurants 59% Company operated 8,785 Franchises 18,687 Affiliated 4,195 Total 31,667 Source: McDonald's Corporation 2006 Annual Report http://www.mcdonalds.com/corp/invest/pub/2006_Annual_Report.html
  • 11.
    Study and GradesChart andBetween Relationship Table Exam Grades and Study Relationship of Study Time to Test Grades Time 100 Student Study Time Test Grade 95 Anderson 5.25 87 90 Block 1 56 85 Exam Grades Chen 5.25 95 80 Davis 3.25 64 75 Evans 4.5 75 70 Franks 4 74 65 Gomez 4.25 78 60 Herrera 4.75 88 55 Ingram 5.5 94 50 Johnson 0.5 66 0 1 2 3 4 5 6 7 Kyle 3 76 Langford 3.75 75 Hours of Study Montrose 3.25 74 Newman 5.5 84 Ross 4.5 85 Theisen 6 90 Williams 2.25 61 Wong 5.75 91