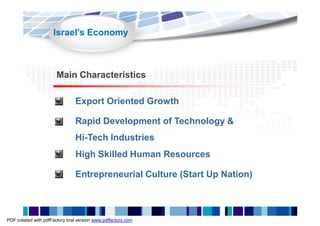
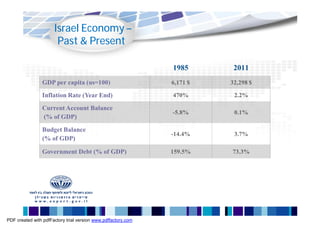
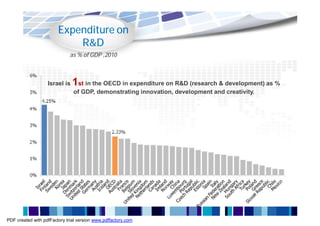
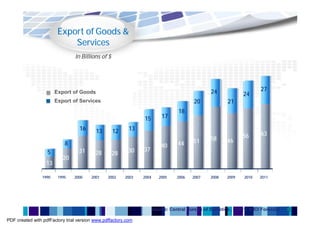
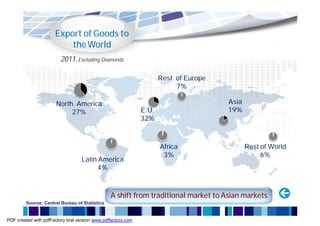
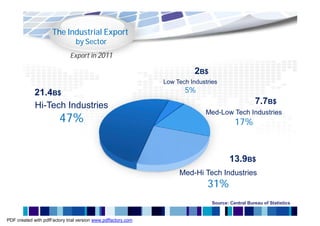
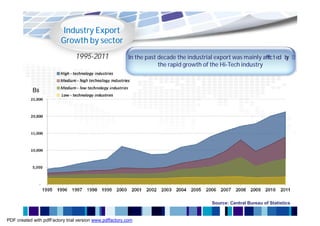
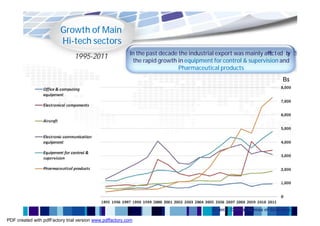
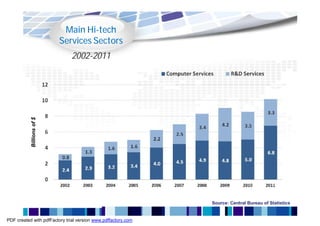
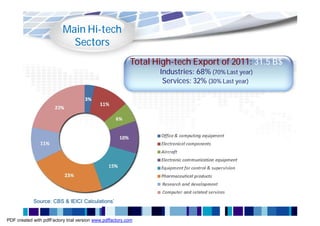
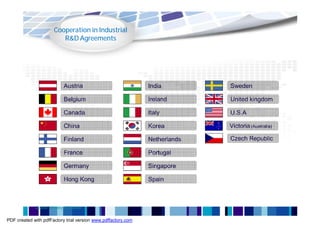
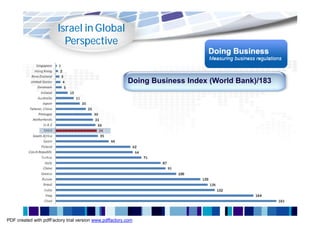
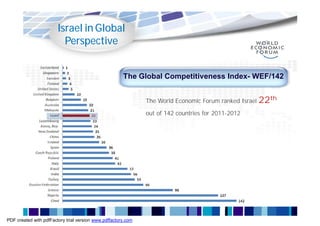
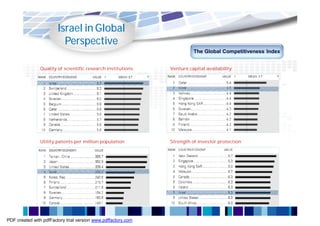
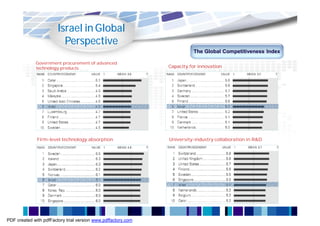
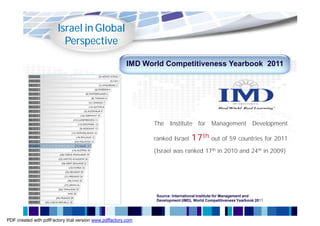
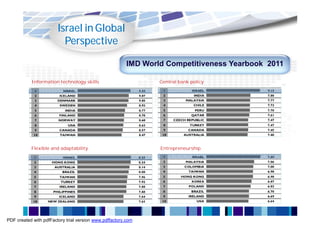
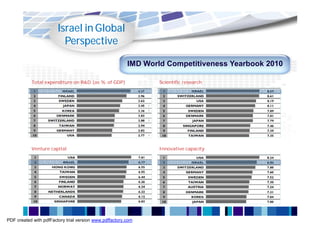
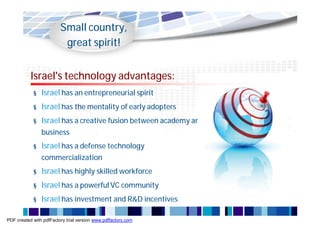
Israel Economy
                              The Israel Export & International
                                    Cooperation Institute


PDF created with pdfFactory trial version www.pdffactory.com
Israel’s Economy


                       Main Characteristics

                                Export Oriented Growth

                                Rapid Development of Technology &
                                Hi-Tech Industries
                                High Skilled Human Resources

                                Entrepreneurial Culture (Start Up Nation)


PDF created with pdfFactory trial version www.pdffactory.com
Israel Economy –
                       Past & Present

                                                               1985       2011
                GDP per capita (us=100)                        6,171 $   32,298 $

                Inflation Rate (Year End)                      470%       2.2%

                Current Account Balance
                                                               -5.8%      0.1%
                (% of GDP)
                Budget Balance
                                                               -14.4%     3.7%
                (% of GDP)

                Government Debt (% of GDP)                     159.5%    73.3%


PDF created with pdfFactory trial version www.pdffactory.com
Gross Public Debt
                                   (as % of GDP)


                                             Since 2003, government debt has been on a consistent downward trend,
                                               only interrupted by the extraordinary circumstances surrounding the
                                                                    2009 global economic crisis
                   United States       120
                   Israel
                                       110
                   United Kingdom
                                       100

                                        90

                                        80

                                        70

                                        60

                                        50

                                        40
                                              2007    2008     2009   2010   2011   2012   2013   2014   2015   2016

                                                                                                                Source: EIU


PDF created with pdfFactory trial version www.pdffactory.com
Macro Economic
                          indicators


                                 Criteria                      2007     2008     2009     2010     2011

                GDP (B$ -at current market prices)              167      202      195      218      243

                GDP Real Growth rate (%)                       5.5%     4.0%     0.8%     4.8%     4.7%


                GDP per Capita (PPP, $)                        26,660   27,850   27,710   28,850   30,160


                Exports of Goods & Services (B$)                71       81       68       80       90


                Imports of Goods & Services (B$)                74       84       63       76       92


                Unemployment Rate (%)                          7.3%     6.1%     7.5%     6.6%     5.6%


                Inflt i o R t e (Year End)
                   a n a                                       3.4%     3.8%     3.9%     2.7%     2.2%


                Current Account balance (% of GDP)             2.7%     0.9%     3.6%     2.9%     0.1%


               Source: EIU, CBS, Bank of Israel


PDF created with pdfFactory trial version www.pdffactory.com
World GDP Growth


                           6                        5.5
               world                                                                                                  4.8                       4.7
               US               4                                         4                       4
                           4
                                          3                                                           3         3.1
               Euro area                      2.7                                                                           2.6                                     2.8
               OECD                 1.9                                                                   1.8                                         2 1.8
                           2                                                                                                      1.7 1.5 1.8
                                                          1.3                                                                                                 1.1
               Israel                                                                       0.8
                                                                0.3 0.1
                           0
                                                            -0.3
                                                                                                                                                          -0.7
                           -2
                                                                              -2.4

                           -4                                                    -3.5 -3.7
                                                                                     -4.2

                           -6
                                     2007                       2008                 2009             2010                          2011                 2012


                                                                                                                                                       Forecast


PDF created with pdfFactory trial version www.pdffactory.com
Real GDP Growth
                     3-year average, end of period
                              (2008-2010)


                    Israel’s 3-year average growth rate is higher then most OECD members.


                                                                              Source: Ministry of Finance


PDF created with pdfFactory trial version www.pdffactory.com
Israel’s
                           Credit Ratings

                                                               Domestic Bonds              Overseas Bonds
                       Rating Firm              Term                            Forecast
                                                                   Rating                      Rating
                                                Long                A1                          A1
                          Moody's                                                Stable
                                                Short                -                          P1
                                                Long                AA-                         A+
                     Standard & Poor's                                           Stable
                                                Short               A-1+                        A-1
                                                Long                A+                           A
                           Fitch                                                 Stable
                                                Short                -                          F1


                                                                                                Source: Ministry of Finance

PDF created with pdfFactory trial version www.pdffactory.com
Current Account Balance
                        & Net Foreign Debt


         Current Account Surplus                                                 Net Foreign Surplus*
         (% of GDP)                                                                               (% of GDP)


                Since 2003, the current account balance is positive, and is accompanied by a
                                        decrease of net foreign debt
                                                                                               Source: EIU
PDF created with pdfFactory trial version www.pdffactory.com
Expenditure on
                            R&D
                              as % of GDP ,2010


                   Israel is   1st in the OECD in expenditure on R&D (research & development) as %
                               of GDP, demonstrating innovation, development and creativity.


PDF created with pdfFactory trial version www.pdffactory.com
Export of Goods &
                            Services
                                In Billions of $


                       Export of Goods                                                         24                      27
                                                                                                               24
                       Export of Services                                              20              21
                                                                                18
                                                               15       17

                                  16      13       12     13
                                                                                                              56       63
                                                                                       51      58      46
                           8                                            40      44
                   5              31                     30    37
                                          28       28
                          20
                  13

                1990    1995    2000    2001    2002    2003   2004    2005     2006   2007    2008    2009    2010   2011


                                                                    Source: Central Bureau of Statistics , *2011: IEICI Forecast

PDF created with pdfFactory trial version www.pdffactory.com
Export of Goods to
                           the World
                         2011, Excluding Diamonds

                                                                      Rest of Europe
                                                                           7%

                       North America                                                   Asia
                            27%                                E.U.                    19%
                                                               32%


                                                                      Africa                  Rest of World
                                                                       3%                          6%
                                   Latin America
                                         4%


                                                 A shift from traditional market to Asian markets
         Source: Central Bureau of Statistics


PDF created with pdfFactory trial version www.pdffactory.com
The Industrial Export
                                by Sector
                              Export in 2011

                                                                          2B$
                                                               Low Tech Industries
             21.4B$                                                   5%

             Hi-Tech Industries                                                                    7.7B$
                         47%
                                                                             Med-Low Tech Industries
                                                                                          17%


                                                                                        13.9B$
                                                                    Med-Hi Tech Industries
                                                                              31%
                                                                                Source: Central Bureau of Statistics


PDF created with pdfFactory trial version www.pdffactory.com
Industry Export
                         Growth by sector
                                1995-2011                In the past decade the industrial export was mainly affected b
                                                                                                                     y
                                                                     the rapid growth of the Hi-Tech industry


            B$


                                                                                        Source: Central Bureau of Statistics


PDF created with pdfFactory trial version www.pdffactory.com
Growth of Main
                         Hi-tech sectors
                                                          In the past decade the industrial export was mainly affected b
                                                                                                                      y
                                1995-2011                  the rapid growth in equipment for control & supervision and
                                                                             Pharmaceutical products
                                                                                                                         B$


                                                                                         Source: Central Bureau of Statistics

PDF created with pdfFactory trial version www.pdffactory.com
Main Hi-tech
                           Services Sectors
                              2002-2011
           Billions of $


                                                               Source: Central Bureau of Statistics


PDF created with pdfFactory trial version www.pdffactory.com
Main Hi-tech
                            Sectors
                                                          Total High-tech Export of 2011: 31.5 B$
                                                                 Industries: 68% (70% Last year)
                                                                  Services: 32% (30% Last year)


            Source: CBS & IEICI Calculations’


PDF created with pdfFactory trial version www.pdffactory.com
World Population
                               By median


                                                               Source: CIA World Factbook


PDF created with pdfFactory trial version www.pdffactory.com
Israel’s Free Trade
                           Agreements


               1985                         USA
                                                                   QIZ Agreements
               1992                         EFTA

               1997                         Turkey                                  Egypt      (2004)

               1997                         Canada
                                                                                    Jordan (1998)
               1999                         Mexico

               2000                         European Union (Association Agreement)

               2007                         MERCOSUR (Argentina not yet in force)


                                                                  * Member states of the common market of the south, not yet in force


PDF created with pdfFactory trial version www.pdffactory.com
Cooperation in Industrial
                           R&D Agreements


                             Austria                           India         Sweden

                             Belgium                           Ireland       United kingdom

                             Canada                            Italy         U.S.A

                             China                             Korea         Victoria (Australia)

                             Finland                           Netherlands   Czech Republic

                             France                            Portugal

                             Germany                           Singapore

                             Hong Kong                         Spain


             Source: Ministry of Finance


PDF created with pdfFactory trial version www.pdffactory.com
Israel in Global
                          Perspective


                                                         Doing Business Index (World Bank)/183


PDF created with pdfFactory trial version www.pdffactory.com
Israel in Global
                          Perspective


                                                       The Global Competitiveness Index- WEF/142


                                                               The World Economic Forum ranked Israel 22th

                                                               out of 142 countries for 2011-2012


PDF created with pdfFactory trial version www.pdffactory.com
Israel in Global
                          Perspective
                                                                         The Global Competitiveness Index


               Quality of scientific research institutions     Venture capital availability


               Utility patents per million population          Strength of investor protection


PDF created with pdfFactory trial version www.pdffactory.com
Israel in Global
                          Perspective
                                                                         The Global Competitiveness Index

             Government procurement of advanced
             technology products                               Capacity for innovation


              Firm-level technology absorption                 University-industry collaboration in R&D


PDF created with pdfFactory trial version www.pdffactory.com
Israel in Global
                          Perspective

                                                         IMD World Competitiveness Yearbook 2011


                                                               The Institute for Management Development

                                                               ranked Israel     17th out of 59 countries for 2011
                                                               (Israel was ranked 17th in 2010 and 24th in 2009)


                                                                Source: International Institute for Management and
                                                                Development (IMD), World Competitiveness Yearbook 2011


PDF created with pdfFactory trial version www.pdffactory.com
Israel in Global
                          Perspective

                                                         IMD World Competitiveness Yearbook 2011

           Information technology skills                         Central bank policy


           Flexible and adaptability                             Entrepreneurship


PDF created with pdfFactory trial version www.pdffactory.com
Israel in Global
                          Perspective

                                                         IMD World Competitiveness Yearbook 2010

           Total expenditure on R&D (as % of GDP)                Scientific research


           Venture capital                                       Innovative capacity


PDF created with pdfFactory trial version www.pdffactory.com
Small country,
                          great spirit!


           Israel's technology advantages:
            §   Israel has an entrepreneurial spirit
            §   Israel has the mentality of early adopters
            §   Israel has a creative fusion between academy and
                business
            §   Israel has a defense technology
                commercialization
            §   Israel has highly skilled workforce
            §   Israel has a powerful VC community
            §   Israel has investment and R&D incentives

PDF created with pdfFactory trial version www.pdffactory.com
Thank you
                                                   Shauli katznelson
                                              Deputy Director General

                                               shauli@export.gov.il


PDF created with pdfFactory trial version www.pdffactory.com

Israel Economy

  • 1.
    Israel Economy The Israel Export & International Cooperation Institute PDF created with pdfFactory trial version www.pdffactory.com
  • 2.
    Israel’s Economy Main Characteristics Export Oriented Growth Rapid Development of Technology & Hi-Tech Industries High Skilled Human Resources Entrepreneurial Culture (Start Up Nation) PDF created with pdfFactory trial version www.pdffactory.com
  • 3.
    Israel Economy – Past & Present 1985 2011 GDP per capita (us=100) 6,171 $ 32,298 $ Inflation Rate (Year End) 470% 2.2% Current Account Balance -5.8% 0.1% (% of GDP) Budget Balance -14.4% 3.7% (% of GDP) Government Debt (% of GDP) 159.5% 73.3% PDF created with pdfFactory trial version www.pdffactory.com
  • 4.
    Gross Public Debt (as % of GDP) Since 2003, government debt has been on a consistent downward trend, only interrupted by the extraordinary circumstances surrounding the 2009 global economic crisis United States 120 Israel 110 United Kingdom 100 90 80 70 60 50 40 2007 2008 2009 2010 2011 2012 2013 2014 2015 2016 Source: EIU PDF created with pdfFactory trial version www.pdffactory.com
  • 5.
    Macro Economic indicators Criteria 2007 2008 2009 2010 2011 GDP (B$ -at current market prices) 167 202 195 218 243 GDP Real Growth rate (%) 5.5% 4.0% 0.8% 4.8% 4.7% GDP per Capita (PPP, $) 26,660 27,850 27,710 28,850 30,160 Exports of Goods & Services (B$) 71 81 68 80 90 Imports of Goods & Services (B$) 74 84 63 76 92 Unemployment Rate (%) 7.3% 6.1% 7.5% 6.6% 5.6% Inflt i o R t e (Year End) a n a 3.4% 3.8% 3.9% 2.7% 2.2% Current Account balance (% of GDP) 2.7% 0.9% 3.6% 2.9% 0.1% Source: EIU, CBS, Bank of Israel PDF created with pdfFactory trial version www.pdffactory.com
  • 6.
    World GDP Growth 6 5.5 world 4.8 4.7 US 4 4 4 4 3 3 3.1 Euro area 2.7 2.6 2.8 OECD 1.9 1.8 2 1.8 2 1.7 1.5 1.8 1.3 1.1 Israel 0.8 0.3 0.1 0 -0.3 -0.7 -2 -2.4 -4 -3.5 -3.7 -4.2 -6 2007 2008 2009 2010 2011 2012 Forecast PDF created with pdfFactory trial version www.pdffactory.com
  • 7.
    Real GDP Growth 3-year average, end of period (2008-2010) Israel’s 3-year average growth rate is higher then most OECD members. Source: Ministry of Finance PDF created with pdfFactory trial version www.pdffactory.com
  • 8.
    Israel’s Credit Ratings Domestic Bonds Overseas Bonds Rating Firm Term Forecast Rating Rating Long A1 A1 Moody's Stable Short - P1 Long AA- A+ Standard & Poor's Stable Short A-1+ A-1 Long A+ A Fitch Stable Short - F1 Source: Ministry of Finance PDF created with pdfFactory trial version www.pdffactory.com
  • 9.
    Current Account Balance & Net Foreign Debt Current Account Surplus Net Foreign Surplus* (% of GDP) (% of GDP) Since 2003, the current account balance is positive, and is accompanied by a decrease of net foreign debt Source: EIU PDF created with pdfFactory trial version www.pdffactory.com
  • 10.
    Expenditure on R&D as % of GDP ,2010 Israel is 1st in the OECD in expenditure on R&D (research & development) as % of GDP, demonstrating innovation, development and creativity. PDF created with pdfFactory trial version www.pdffactory.com
  • 11.
    Export of Goods& Services In Billions of $ Export of Goods 24 27 24 Export of Services 20 21 18 15 17 16 13 12 13 56 63 51 58 46 8 40 44 5 31 30 37 28 28 20 13 1990 1995 2000 2001 2002 2003 2004 2005 2006 2007 2008 2009 2010 2011 Source: Central Bureau of Statistics , *2011: IEICI Forecast PDF created with pdfFactory trial version www.pdffactory.com
  • 12.
    Export of Goodsto the World 2011, Excluding Diamonds Rest of Europe 7% North America Asia 27% E.U. 19% 32% Africa Rest of World 3% 6% Latin America 4% A shift from traditional market to Asian markets Source: Central Bureau of Statistics PDF created with pdfFactory trial version www.pdffactory.com
  • 13.
    The Industrial Export by Sector Export in 2011 2B$ Low Tech Industries 21.4B$ 5% Hi-Tech Industries 7.7B$ 47% Med-Low Tech Industries 17% 13.9B$ Med-Hi Tech Industries 31% Source: Central Bureau of Statistics PDF created with pdfFactory trial version www.pdffactory.com
  • 14.
    Industry Export Growth by sector 1995-2011 In the past decade the industrial export was mainly affected b y the rapid growth of the Hi-Tech industry B$ Source: Central Bureau of Statistics PDF created with pdfFactory trial version www.pdffactory.com
  • 15.
    Growth of Main Hi-tech sectors In the past decade the industrial export was mainly affected b y 1995-2011 the rapid growth in equipment for control & supervision and Pharmaceutical products B$ Source: Central Bureau of Statistics PDF created with pdfFactory trial version www.pdffactory.com
  • 16.
    Main Hi-tech Services Sectors 2002-2011 Billions of $ Source: Central Bureau of Statistics PDF created with pdfFactory trial version www.pdffactory.com
  • 17.
    Main Hi-tech Sectors Total High-tech Export of 2011: 31.5 B$ Industries: 68% (70% Last year) Services: 32% (30% Last year) Source: CBS & IEICI Calculations’ PDF created with pdfFactory trial version www.pdffactory.com
  • 18.
    World Population By median Source: CIA World Factbook PDF created with pdfFactory trial version www.pdffactory.com
  • 19.
    Israel’s Free Trade Agreements 1985 USA QIZ Agreements 1992 EFTA 1997 Turkey Egypt (2004) 1997 Canada Jordan (1998) 1999 Mexico 2000 European Union (Association Agreement) 2007 MERCOSUR (Argentina not yet in force) * Member states of the common market of the south, not yet in force PDF created with pdfFactory trial version www.pdffactory.com
  • 20.
    Cooperation in Industrial R&D Agreements Austria India Sweden Belgium Ireland United kingdom Canada Italy U.S.A China Korea Victoria (Australia) Finland Netherlands Czech Republic France Portugal Germany Singapore Hong Kong Spain Source: Ministry of Finance PDF created with pdfFactory trial version www.pdffactory.com
  • 21.
    Israel in Global Perspective Doing Business Index (World Bank)/183 PDF created with pdfFactory trial version www.pdffactory.com
  • 22.
    Israel in Global Perspective The Global Competitiveness Index- WEF/142 The World Economic Forum ranked Israel 22th out of 142 countries for 2011-2012 PDF created with pdfFactory trial version www.pdffactory.com
  • 23.
    Israel in Global Perspective The Global Competitiveness Index Quality of scientific research institutions Venture capital availability Utility patents per million population Strength of investor protection PDF created with pdfFactory trial version www.pdffactory.com
  • 24.
    Israel in Global Perspective The Global Competitiveness Index Government procurement of advanced technology products Capacity for innovation Firm-level technology absorption University-industry collaboration in R&D PDF created with pdfFactory trial version www.pdffactory.com
  • 25.
    Israel in Global Perspective IMD World Competitiveness Yearbook 2011 The Institute for Management Development ranked Israel 17th out of 59 countries for 2011 (Israel was ranked 17th in 2010 and 24th in 2009) Source: International Institute for Management and Development (IMD), World Competitiveness Yearbook 2011 PDF created with pdfFactory trial version www.pdffactory.com
  • 26.
    Israel in Global Perspective IMD World Competitiveness Yearbook 2011 Information technology skills Central bank policy Flexible and adaptability Entrepreneurship PDF created with pdfFactory trial version www.pdffactory.com
  • 27.
    Israel in Global Perspective IMD World Competitiveness Yearbook 2010 Total expenditure on R&D (as % of GDP) Scientific research Venture capital Innovative capacity PDF created with pdfFactory trial version www.pdffactory.com
  • 28.
    Small country, great spirit! Israel's technology advantages: § Israel has an entrepreneurial spirit § Israel has the mentality of early adopters § Israel has a creative fusion between academy and business § Israel has a defense technology commercialization § Israel has highly skilled workforce § Israel has a powerful VC community § Israel has investment and R&D incentives PDF created with pdfFactory trial version www.pdffactory.com
  • 29.
    Thank you Shauli katznelson Deputy Director General shauli@export.gov.il PDF created with pdfFactory trial version www.pdffactory.com