Download to read offline

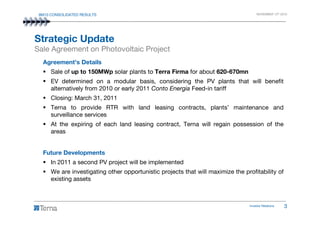
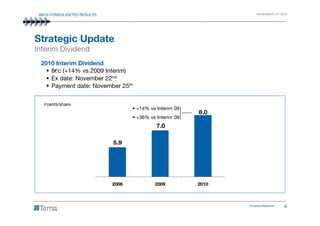
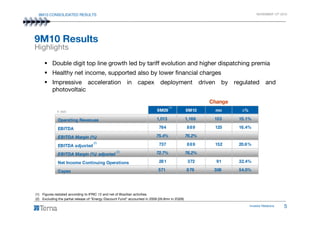
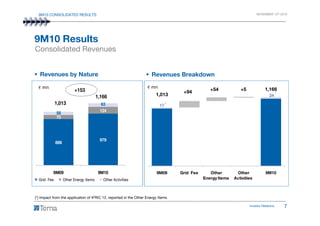
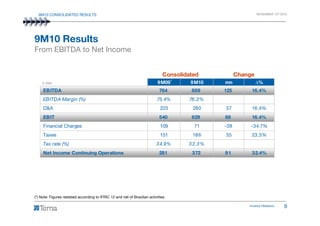
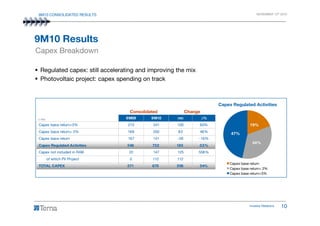
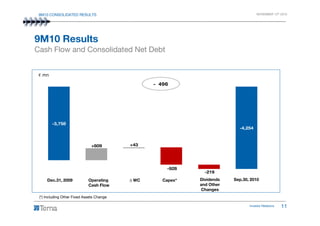
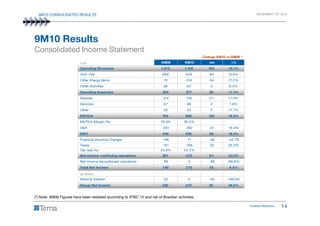
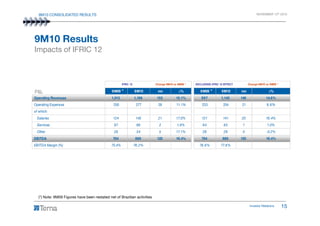
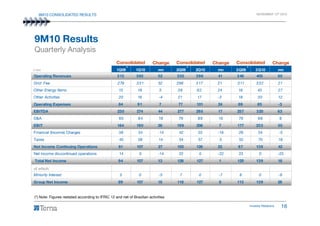
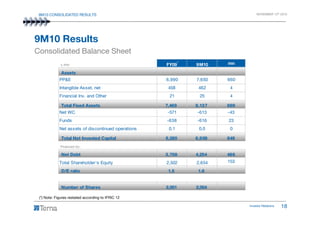
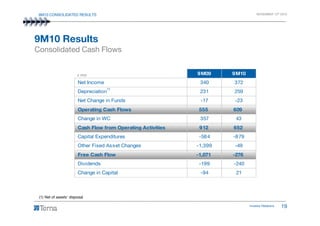
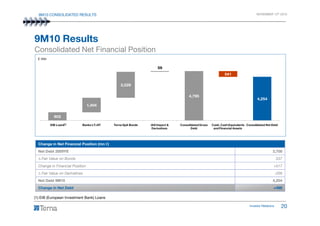
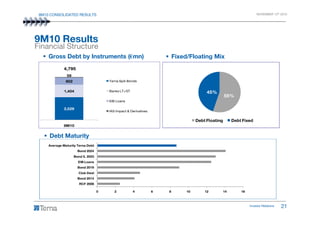

The 9m10 consolidated results report a strong financial performance, with operating revenues increasing by 15.1%, reaching €1,166 million, and net income from continuing operations rising by 32.4% to €372 million. The company has also announced the sale of solar plants to Terra Firma for approximately €620-670 million and plans for future photovoltaic projects. Additionally, the interim dividend will be increased by 14% compared to the previous year, reflecting positive growth and increased capital expenditures.


