Download to read offline


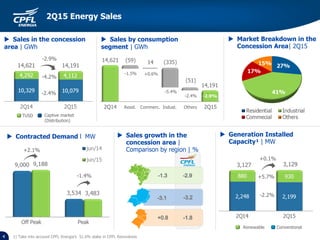
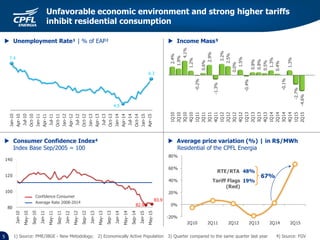
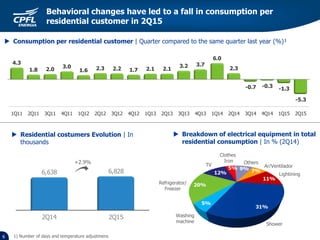
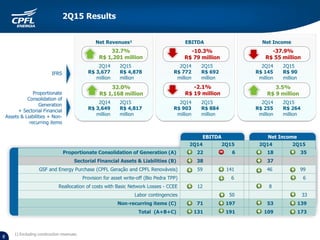
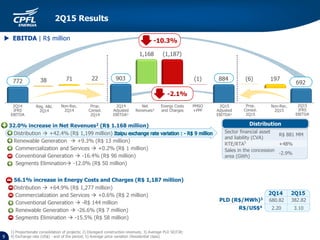
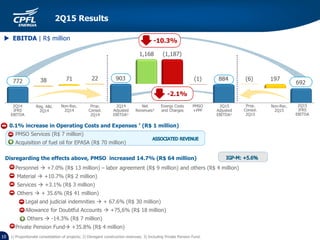
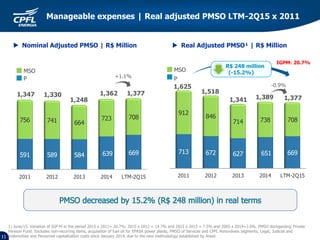
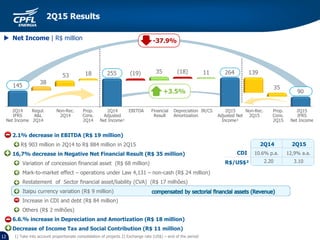

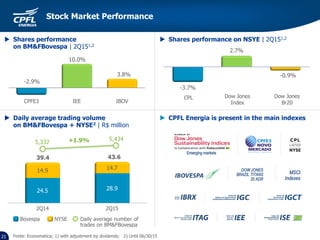


2Q15 Results - Sales dropped 2.9% in the concession area, with residential consumption down 1.5% due to unfavorable economic conditions and tariff increases. EBITDA decreased 2.1% to R$884 million due to higher energy costs, while net income declined 37.9% to R$55 million due to non-recurring expenses and financial results. Manageable expenses increased only 1.1% in real terms year-over-year through cost control measures.


