Understanding Partial Differential Equations: Types and Solution Methods
Technical Presentation P.E.N.G.U.I.N
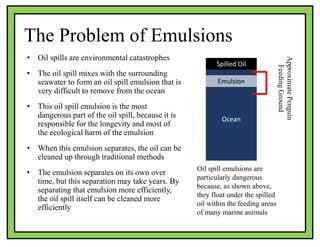
1. The Problem of Emulsions
• Oil spills are environmental catastrophes
• The oil spill mixes with the surrounding
seawater to form an oil spill emulsion that is
very difficult to remove from the ocean
• This oil spill emulsion is the most
dangerous part of the oil spill, because it is
responsible for the longevity and most of
the ecological harm of the emulsion
• When this emulsion separates, the oil can be
cleaned up through traditional methods
• The emulsion separates on its own over
time, but this separation may take years. By
separating that emulsion more efficiently,
the oil spill itself can be cleaned more
efficiently
Oil spill emulsions are
particularly dangerous
because, as shown above,
they float under the spilled
oil within the feeding areas
of many marine animals
Spilled Oil
Ocean
Emulsion
ApproximatePenguin
FeedingGround
2. Using Plastics to Separate Emulsions
• Photos show an observation of
emulsion separation when stored
in PP, PMP and glass containers
• Clearly, the emulsion in the PMP
container separates faster
• As seen, for PMP, the separation is
driven at the interface between the
emulsion and the plastic
• For glass and PP, the separation is
only in the center
Polypropylene Poly-methyl-pentene Glas
s
Last year, based on these observations, I decided to test the effects of various
plastics on emulsion stability. I quantified the effects of these different plastics,
and using correlation analysis, determined the factors that most strongly affected
each plastics’ effects on emulsion stability.
3. Prior Results - 2019
Last year I found that the two plastic properties that had the greatest effect on
emulsion stability were the polarity of the plastics, and the branching of the plastics
(R²=0.90). This polarity effect was really an extremity of polarity effect, in which
both highly polar and highly non-polar polymers led to destabilization (as polar
polymers “draw out” the water, and non-polar the oil). These results informed my
design choices and tests for this current engineering project.
[CELLRANGE]
[CELLRANGE]
[CELLRANGE]
[CELLRANGE]
[CELLRANGE][CELLRANGE]
[CELLRANGE]
[CELLRANGE]
[CELLRANGE]
[CELLRANGE]
[CELLRANGE]
R² = 0.9025
0
2
4
6
8
10
12
14
16
18
0 2 4 6 8 10 12
Polarity/BranchingFactor
Ranking of Stability
Polarity and Branching
4. Emulsion Creation
• Seawater: 3.6 grams of Instant Ocean (a
commercial salt used in aquariums) and
100 mL of distilled water
• Blue, water-soluble food dye was used as a
stain
• I mixed the simulated seawater with
canola oil
• Based on preliminary testing, 1:1 oil to
water ratio.
• In natural conditions, the shearing action
of waves produces the mixing force;
however, in my home “laboratory,” I used
a household immersion blender (RPM
14000).
• Total mixing time: 150 seconds
To test the effects of plastic on
emulsion separation, a large
amount of emulsion was created
using a non-hazardous substitute
for crude oil: canola oil
5. Design Process
Design Goal: Reduce Emulsion Separation time by at least 20%
Polarity and Branching Results from Prior Experiments
Polarity Confirmation
Spacing Effects Tests
Surface Effects Test
Materials Choices Effects Choices
Prototypes 1, 2, and 3
Prototypes 4, 5, and 6
6. Polarity Test
Polyethylene Acetal
Non-Polar Polar
To further confirm the results of my earlier polarity testing, I ran a visual test
where I placed a drop of emulsion onto two plates, one polar and one non-polar.
As you can see, the different behavior on each plate (which did not occur in the
control) indicates a polarity effect on emulsion stability.
7. Surface Effects Test
• Based on the idea that if monomer branching can
affect emulsion stability, so should surface texture
• I modified 6 ABS rods using sanding and ABS
paint. I created ABS paint from a mixture of ABS
printing filament and acetone
• I created 6 samples: sanded w/60 grit paper, rod
partially dissolved in acetone and etched, painted
w/smooth brush, painted w/rough brush, wrapped
in ABS filament, sanded w/200 grit paper, and
unmodified control
Using a stand I built and a cellphone interval
camera, I conducted an industry “bottle test,”
taking pictures every 10 minutes of the
separation over time to quantify the effects of
each of these modifications.
8. Surface Effects Image Analysis
50
60
70
80
90
100
110
0 20 40 60 80 100 120
Percent“oil+emulsion”
Picture Number (Every 10 Minutes)
Sample Logistic Curve
My
code in
ImageJ
I took each of those interval camera images, and using code I wrote in ImageJ,
converted each into a b/w image indicating “water” and “emulsion + oil” regions.
I then graphed the amount of
“emulsion + oil” over time (found
using ImageJ batch processing),
which follows a logistic
regression, and found the time to
reach only 65% emulsion + oil and
found the % decrease in separation
time as compared to the control.
9. Surface Effects Results
0
2
4
6
8
10
12
14
16
18
20
Rough Painted
Rod
Twisted Rod Sanding 60 Grit
Rod
Dissolved Rod Smooth Painted
Rod
Sanding 220 Grit
Rod
%DecreaseinEmulsionSeparationTime
Percent Decrease in Separation Time by Surface Effect
ANOVA Alpha = 0.05
F value 4.60
F Critical 2.85
This graph suggests the most effective surface
effects are roughly painting the surface, adding extra
filament, and sanding the surface with 60 grit
sandpaper. Based on ANOVA analysis, these results
are statistically significant.
10. Spacing Effects Test
• Using a 3-D pen, I created “jail cells” of
varying widths to test the effect of
spacing on emulsion stability
• I created both a “control” set (ABS pen
on ABS plastic), and a “polarity” set
(PLA pen on PMP plastic), as the
polarities of PLA and PMP differ greatly
• I used my previously developed ADELiE test to
measure emulsion separation over time
• In ADELiE, the rate of spread of a drop of
emulsion is correlated with its rate of
destabilization
• I took pictures of the setup shown to the right every
10-20 minutes, and then graphed the width at three
different points over time
11. Spacing Effects Analysis
Calibration
LeftWidth
MidWidth
RightWidth
y = 0.0209x + 14.974
y = 0.0235x + 14.513
y = 0.0239x + 18.057
10
12
14
16
18
20
22
0 20 40 60 80 100
Widthinmm
Time in Minutes
ADELIE: Growth Rates of Emulsion
Blobs
• Using ImageJ, I calculated the widths across the “blob”
• Using ImageJ, I was able to exactly portion the measurements to
measure the same point on the emulsion each time
• I then graphed each measurement over time to find the slope, which I used
as the ADELIE measurement. A representative graph is shown above
12. Spacing Effects Results
0
0.02
0.04
0.06
0.08
0.1
0.12
Control W1 Control W2 Control W3 Polarity W1 Polarity W2 Polarity W3
ADELIEResult:Growthinmm/min
ADELIE Growth Rates by Plastic and Width
ANOVA Alpha = 0.05
F value 172
F Critical 3.11
As you can see, the “polarity” tests outperformed
the “control” tests at all three values. The optimal
spacing appears to be between 2 and 3 filament
widths. These results are statistically significant.
13. Prototype 1: “Spikey Ball”
This prototype was printed on the Richland Public Library’s STEAMspace 3-D
printer. I expected this to be one of the lowest performing prototypes because I did
not add surfaces of differing polarities, and its existence serves as a control for the
“Mod Spikey Ball.”
The entire ball was
printed out of ABS
plastic, which is
moderately polar
The design was
inspired by the
roughly-painted ABS
rod, which I believe
was effective due to its
many points
Its shape is based off
the Stellated
Dodecahedron
In emulsion
14. Prototype 2: “Mod Spikey Ball”
The design was
inspired by the
roughly-painted ABS
rod, and the filament-
wrapped rod
I used a spacing of 2.5
filament widths
because of the results
of the Spacing Test
While the base is still
ABS, the added
material is PLA,
which is significantly
more polar
The base was printed at the Richland Public Library, and I added the PLA
filament using a 3-D pen. I expected this prototype to perform significantly better
than the original “Spikey Ball” due to the added polar material.
In emulsion
15. Prototype 3 “Jellyfish”
The other main design
category was the
“jellyfish,” which was
primarily inspired by
the prospect of mixing
polar and non-polar
materials
The “tentacles” of the
jellyfish alternate
between non-polar
PMP and polar ABS,
chosen for their
branching and
differences in polarity
This is a standard
jellyfish, with no
modifications to the
tentacles
To build the jellyfish, I used 25µm-thick ABS and PMP sheets, and strung them
together on a wire with glass beads. I expected this to be the lowest performing of
the jellyfish, but note the separation with water (in the overhead shot) occurring
on every-other tentacle. This is a polarity-based effect with the ABS.
In emulsion
16. Prototype 4: “Flat Jellyfish”
This jellyfish was
inspired by the
original jellyfish,
which was effective,
but the tentacle layout
appeared to be
inhibiting the
agglomeration of
separated oil/water As you can see in the
image, all the oil and
water can move freely,
uninhibited by
different “sections”
The same overall area
of ABS and PMP was
used to create this
To build the jellyfish, I again used 25µm-thick ABS and PMP sheets, glass beads,
and wire. I expected this to jellyfish prototype to slightly outperform the original
because it allows for better agglomeration.
In emulsion
17. Prototype 5: “Braided Jellyfish”
All the prototypes from the second round are jellyfish because of their greater
effectiveness over the Spikey Balls. I thought this prototype would significantly
outperform the original jellyfish, because of the added nucleation sites.
This jellyfish is the
same as the original
jellyfish, with an added
twist braid of 5µm-
thick ABS and PMP
This “braid” has many
sharp points which can
serve as nucleation
points—regions where
oil or water can begin
to agglomerate
This was primarily
inspired by the high-
performer “Filament-
Wrapped ABS” from
the Surface Effects
Test
In emulsion
18. Prototype 6: “Sanded Jellyfish”
This improvement on
Prototype 3 was
primarily inspired by
the 3rd-place finisher
in the Surface Effects
Test, rod sanded with
60 grit paper
This was chosen over
the 1st-place winner
because of the
difficulty of creating
ABS paint, and a need
for a PMP surface
texture
Other than sanding,
no changes to the
original model were
made
Because of the efficacy of the sanding in the Surface Effects Test, I thought this
sanded model would be the most effective of all the models overall.
In emulsion
19. Overall Separation Time Decrease
0.00
5.00
10.00
15.00
20.00
25.00
30.00
35.00
40.00
Spikey Ball Mod Spikey
Ball
Flat Jellyfish Jellyfish Sanded
Jellyfish
Braided
Jellyfish
%DecreaseinTotalSeparationTimebyControl
Percent Decrease of Total Separation Time by Prototype
I met my design goal! The most effective model was actually the Braided
Jellyfish, which decreased the total separation time by 25%, well over my goal
of 20%. These results are statistically significant.
ANOVA Alpha = 0.05
F value 5.16
F Critical 2.85
20. Logistic Analysis
• When graphing the separation over time for both the control and the affected
emulsions, I noticed a stark difference in separation times
• This graph demonstrates that difference
• While the control emulsion takes longer to begin to separate visibly, once it
begins to separate, it finishes quite quickly
• Overall, the affected emulsions still separate far faster on average
-10
0
10
20
30
40
50
60
70
80
90
0 500 1000 1500 2000 2500
mLofEmulsionRemaining
Time in Minutes
Comparison of Emulsion Remaining over Time: Control/Braided Jellyfish Samples
Control Braided Jellyfish
Braided Jellyfish
Sample Begins
Separating
Control Sample
Begins
Separating
Braided Jellyfish
Sample Finishes
Separating
Control Sample
Finishes
Separating
21. Decrease in Time to Begin Separating
0.00
10.00
20.00
30.00
40.00
50.00
60.00
70.00
80.00
90.00
100.00
Spikey Ball Mod Spikey Ball Flat Jellyfish Jellyfish Sanded Jellyfish Braided Jellyfish
%DecreaseinTimetoStartSeparating
• This prompted me to graph the decrease in the time for the emulsion to begin
separating for each prototype
• They were roughly proportional to the overall separation time decreases for each
prototype
• The most drastic effect was from the Braided Jellyfish, with a Start Time
Decrease of 86.4%
ANOVA Alpha = 0.05
F value 5.71
F Critical 3.11
22. Discussion of Correlation
R² = 0.7617
0.00
10.00
20.00
30.00
40.00
50.00
60.00
70.00
80.00
90.00
100.00
0.00 10.00 20.00 30.00
Average%DecreaseofStartTime
Average % Decrease of End Time
Correlation Graph
0
1
2
3
4
5
6
7
Spikey Ball Mod Spikey
Ball
Flat Jellyfish Jellyfish Sanded
Jellyfish
Braided
Jellyfish
%DecreaseStartTime/%
DecreaseStartTime
Ratios Test
• This proportionality that I noted inspired me to
conduct a correlation analysis
• I found a strong correlation between the start time
and overall time decreases
• When graphing the ratios of start and end time
decreases, there was no statistically significant
difference between the prototypes (f value =
0.334, f crit. = 5.99)
23. Conclusions and Future Work
• I exceeded my design goal! Three Jellyfish designs (original, sanded, and
braided) all decreased total emulsion separation time by over 20%
• Primarily, these effects were the result of a decrease in the time the emulsion
took to start visually separating
• I believe this works because my prototypes create multiple nucleation sites
for emulsion separation throughout the sample. By contrast, in my controls,
only the few nucleation sites that naturally occurred allowed for
destabilization
• The most effective prototypes were mixtures of oleophilic and hydrophilic
polymers, with rough surfaces and points to allow for multiple oil and water
nucleation sites
• In the future, I plan to improve on these prototypes:
• Because of the success of the braided and sanded jellyfish, I plan to
combine them into one braided/sanded jellyfish
• I plan to explore bioplastics because of their higher polarity
• I’d like to test a design composed solely of intertwined braids
24. Abstract
One of the most dangerous components of an oil spill is the emulsion that
forms between the spilled oil and the surrounding seawater. This submerged
emulsion can persist for many years and is difficult to remove. By separating that
oil emulsion, the oil spill itself can be remediated more effectively.
The design goal of this project was to develop a prototype for emulsion
separation that decreased emulsion separation time by at least 20%. I based my
designed in previous findings, namely, the efficacy of extremely polar and non-
polar plastics in emulsion separation, and the efficacy of highly branch plastics.
I ran both a Surface Effects Test to understand the various effects of
different surface textures, and a Spacing Test to determine the proper spacing for
combining polar and non-polar materials. By combining polar and non-polar
plastics into “jellyfish”-like shapes I was able to exceed my design goal, creating a
prototype that decreased overall emulsion stability by 25%, and decreased the time
for the emulsion to begin visually separating by 86%. This prototype worked
because of the increase in nucleation sites, points for the water and oil particles to
begin agglomerating.
In the future I plan to continue designing these prototypes and improving
them to increase their separation by using plastics of increased polarity and adding
more nucleation sites.