Download as PDF, PPTX

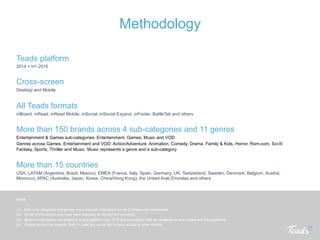
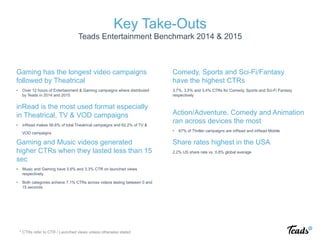
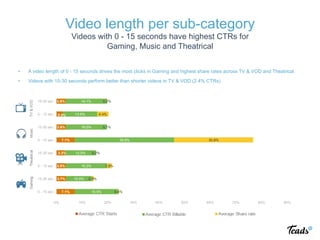
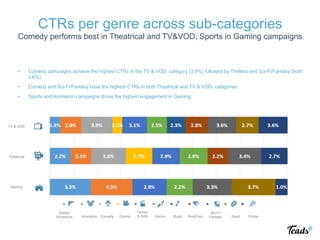
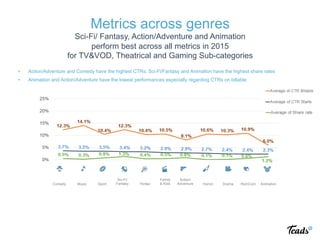
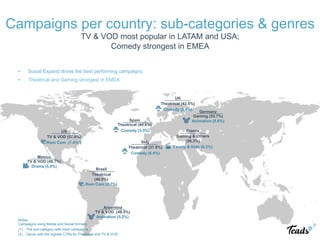


The document presents the Teads Entertainment Benchmark for 2014-2015, detailing advertising campaign performance across various sub-categories like gaming, theatrical, and music in multiple countries. It highlights key metrics such as click-through rates (CTR), engagement rates, and the effectiveness of different video lengths and formats. The analysis reveals that shorter videos tend to drive higher CTRs, particularly in the gaming and music genres, with comedy and sci-fi/fantasy performing well across key metrics.


![[rokonz.com] Glossary of Semantic SEO Part-1.pdf](https://cdn.slidesharecdn.com/ss_thumbnails/rokonz-260123200456-440e4060-thumbnail.jpg?width=640&height=640&fit=bounds)
![[rokonz.com] Glossary of Semantic SEO Part-3.pdf](https://cdn.slidesharecdn.com/ss_thumbnails/rokonz-260123200835-55123e1e-thumbnail.jpg?width=640&height=640&fit=bounds)


![[rokonz.com] Glossary of Semantic SEO Part-2.pdf](https://cdn.slidesharecdn.com/ss_thumbnails/rokonz-260123200719-92199ba8-thumbnail.jpg?width=640&height=640&fit=bounds)


