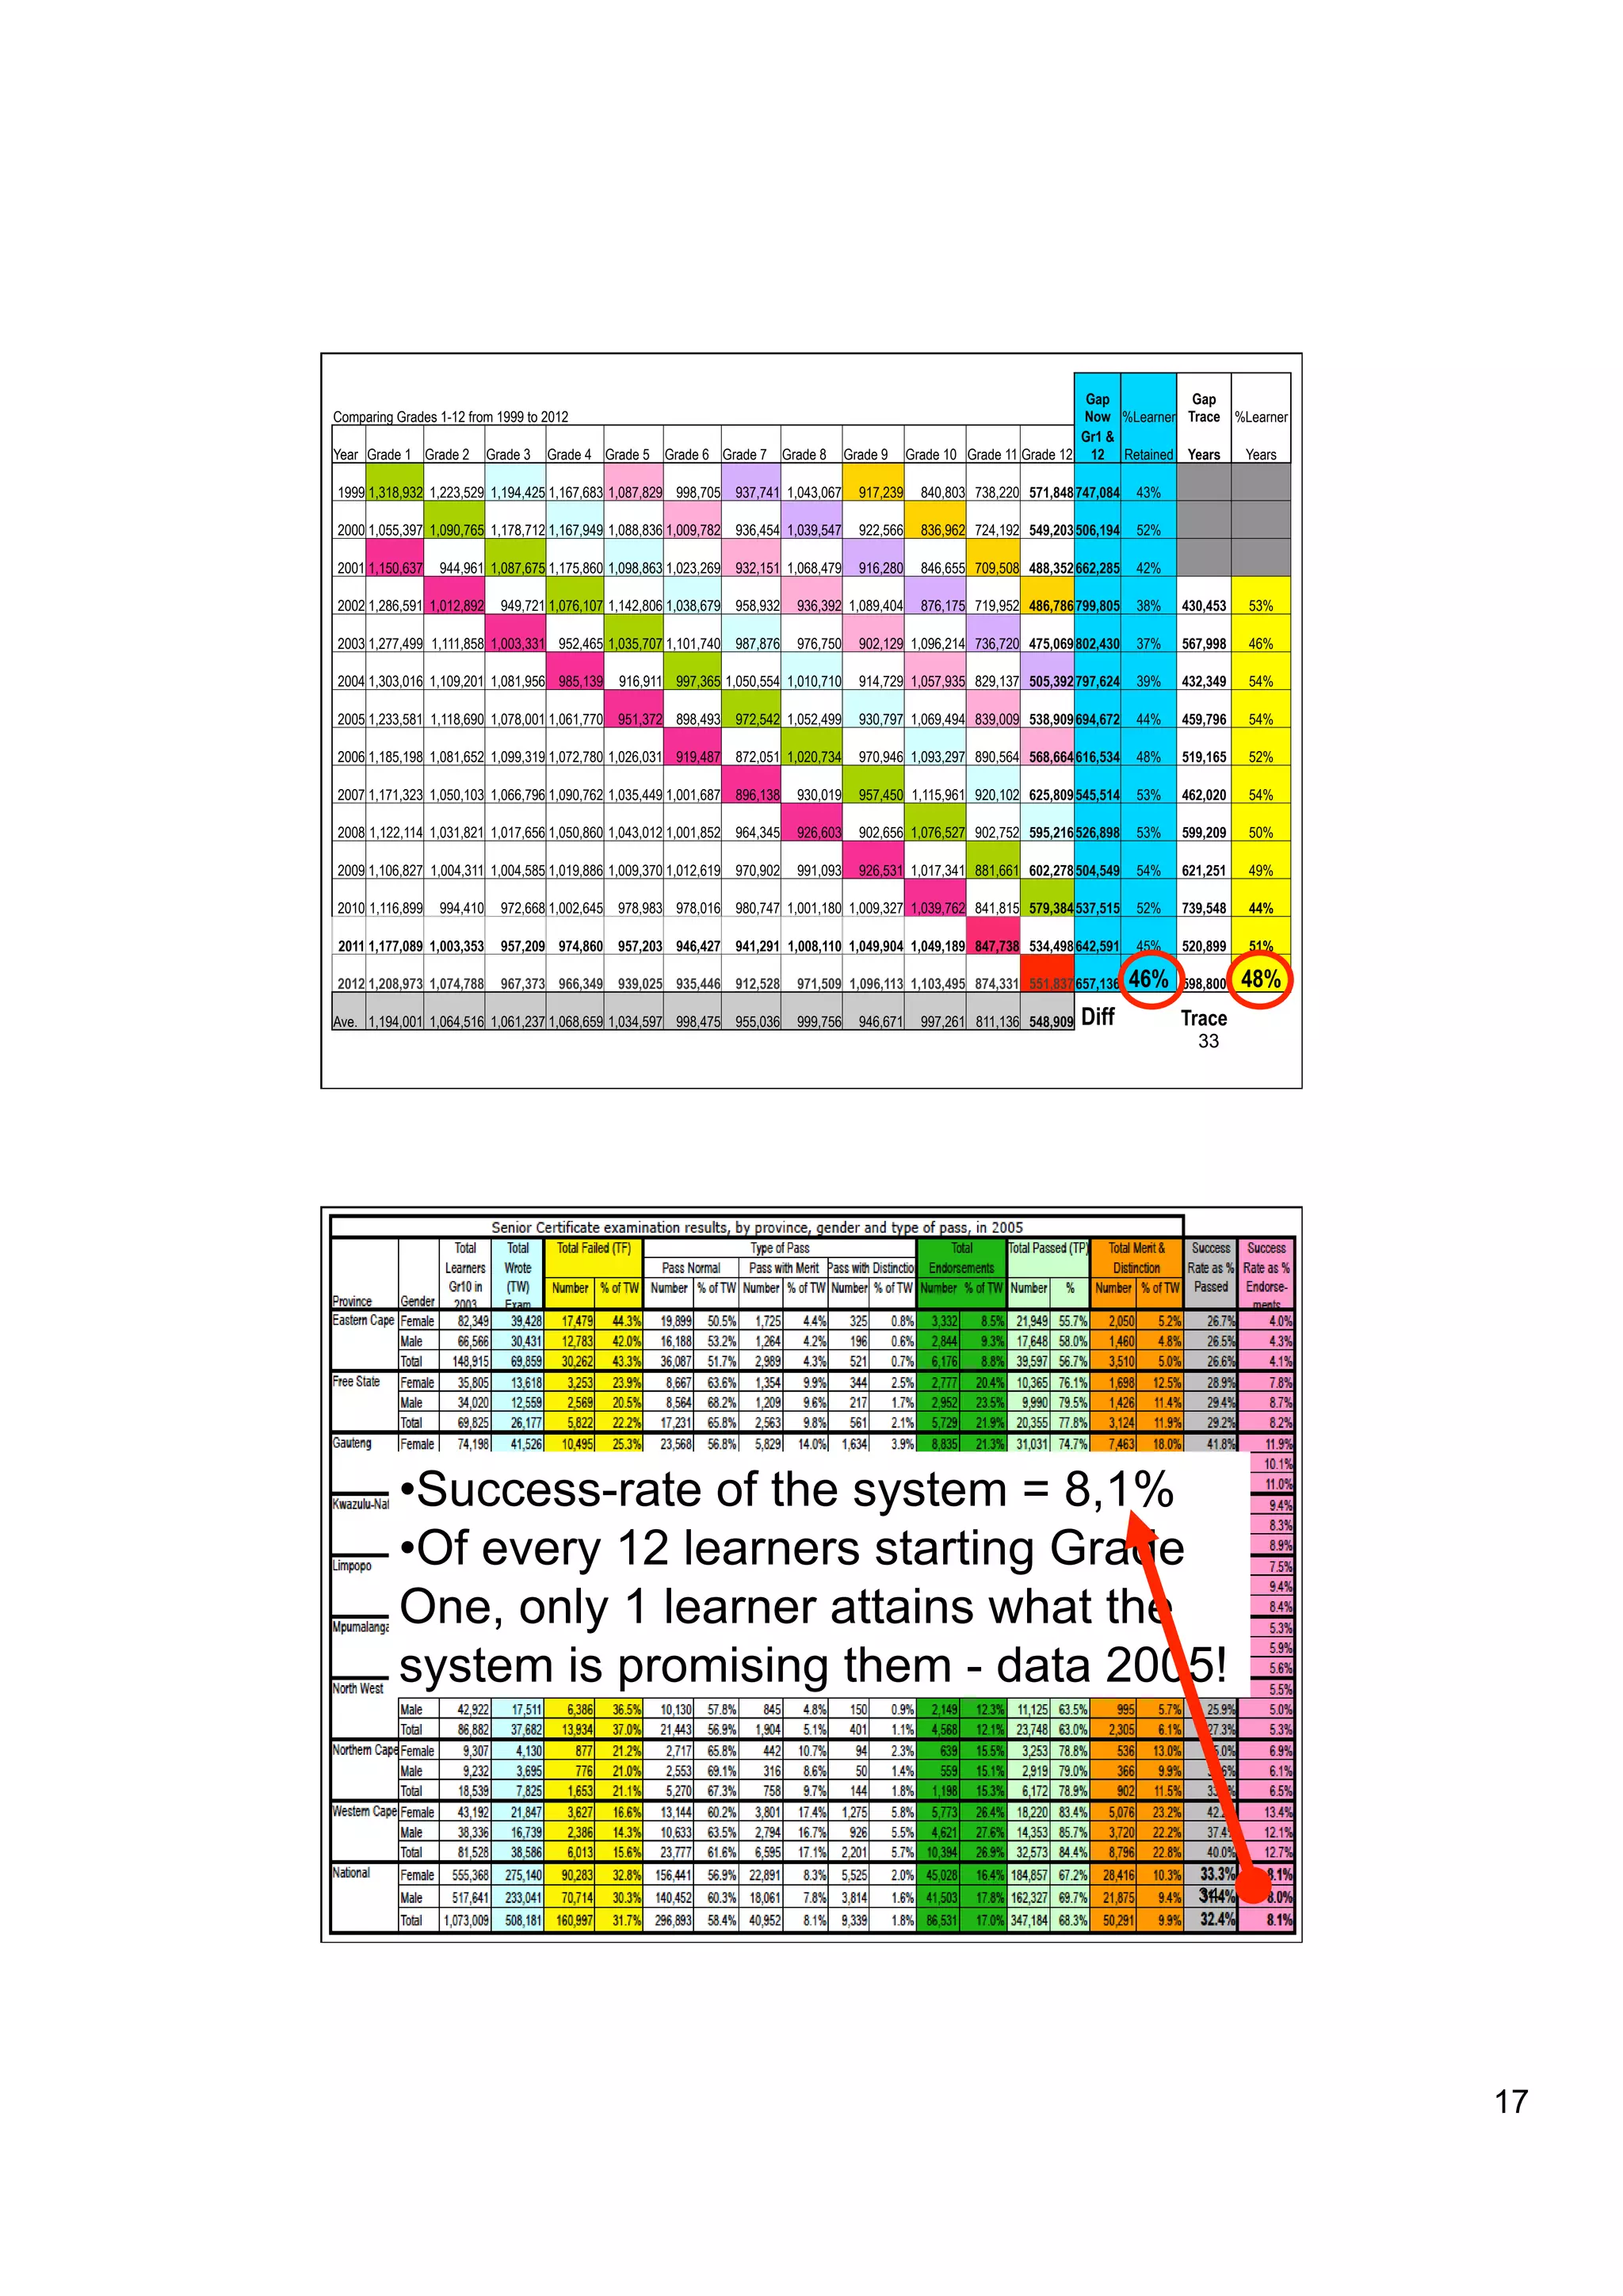
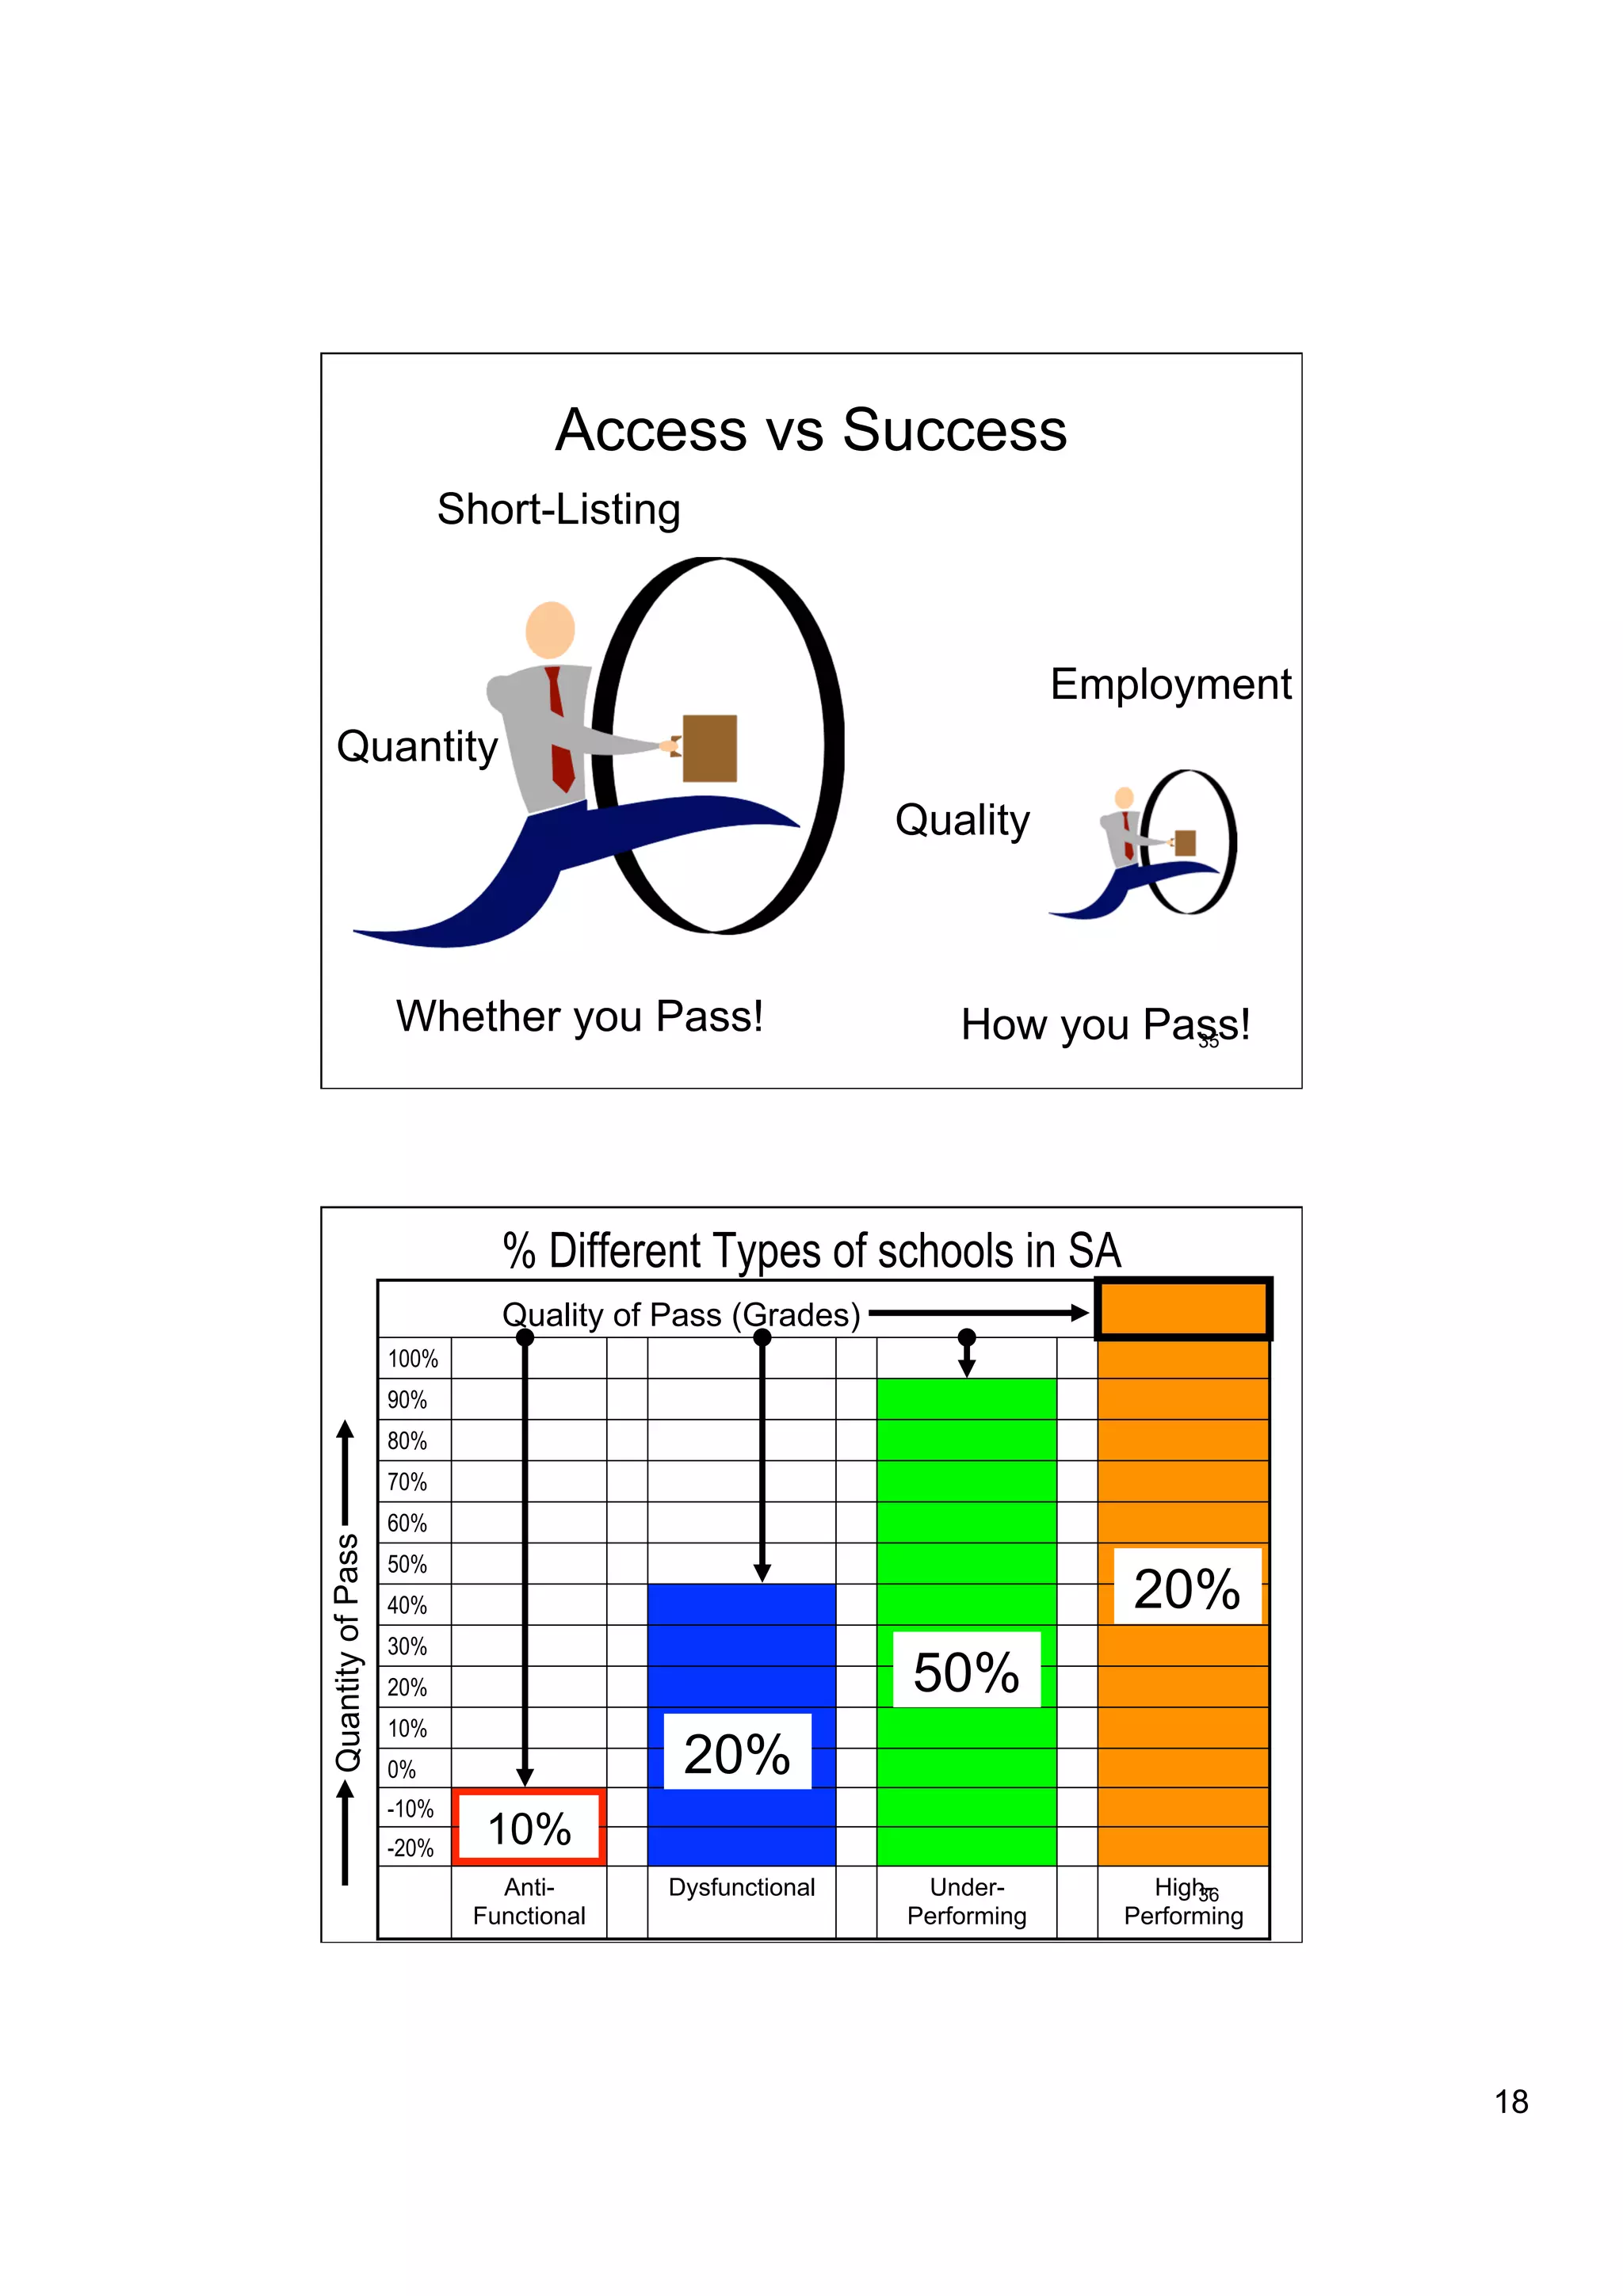
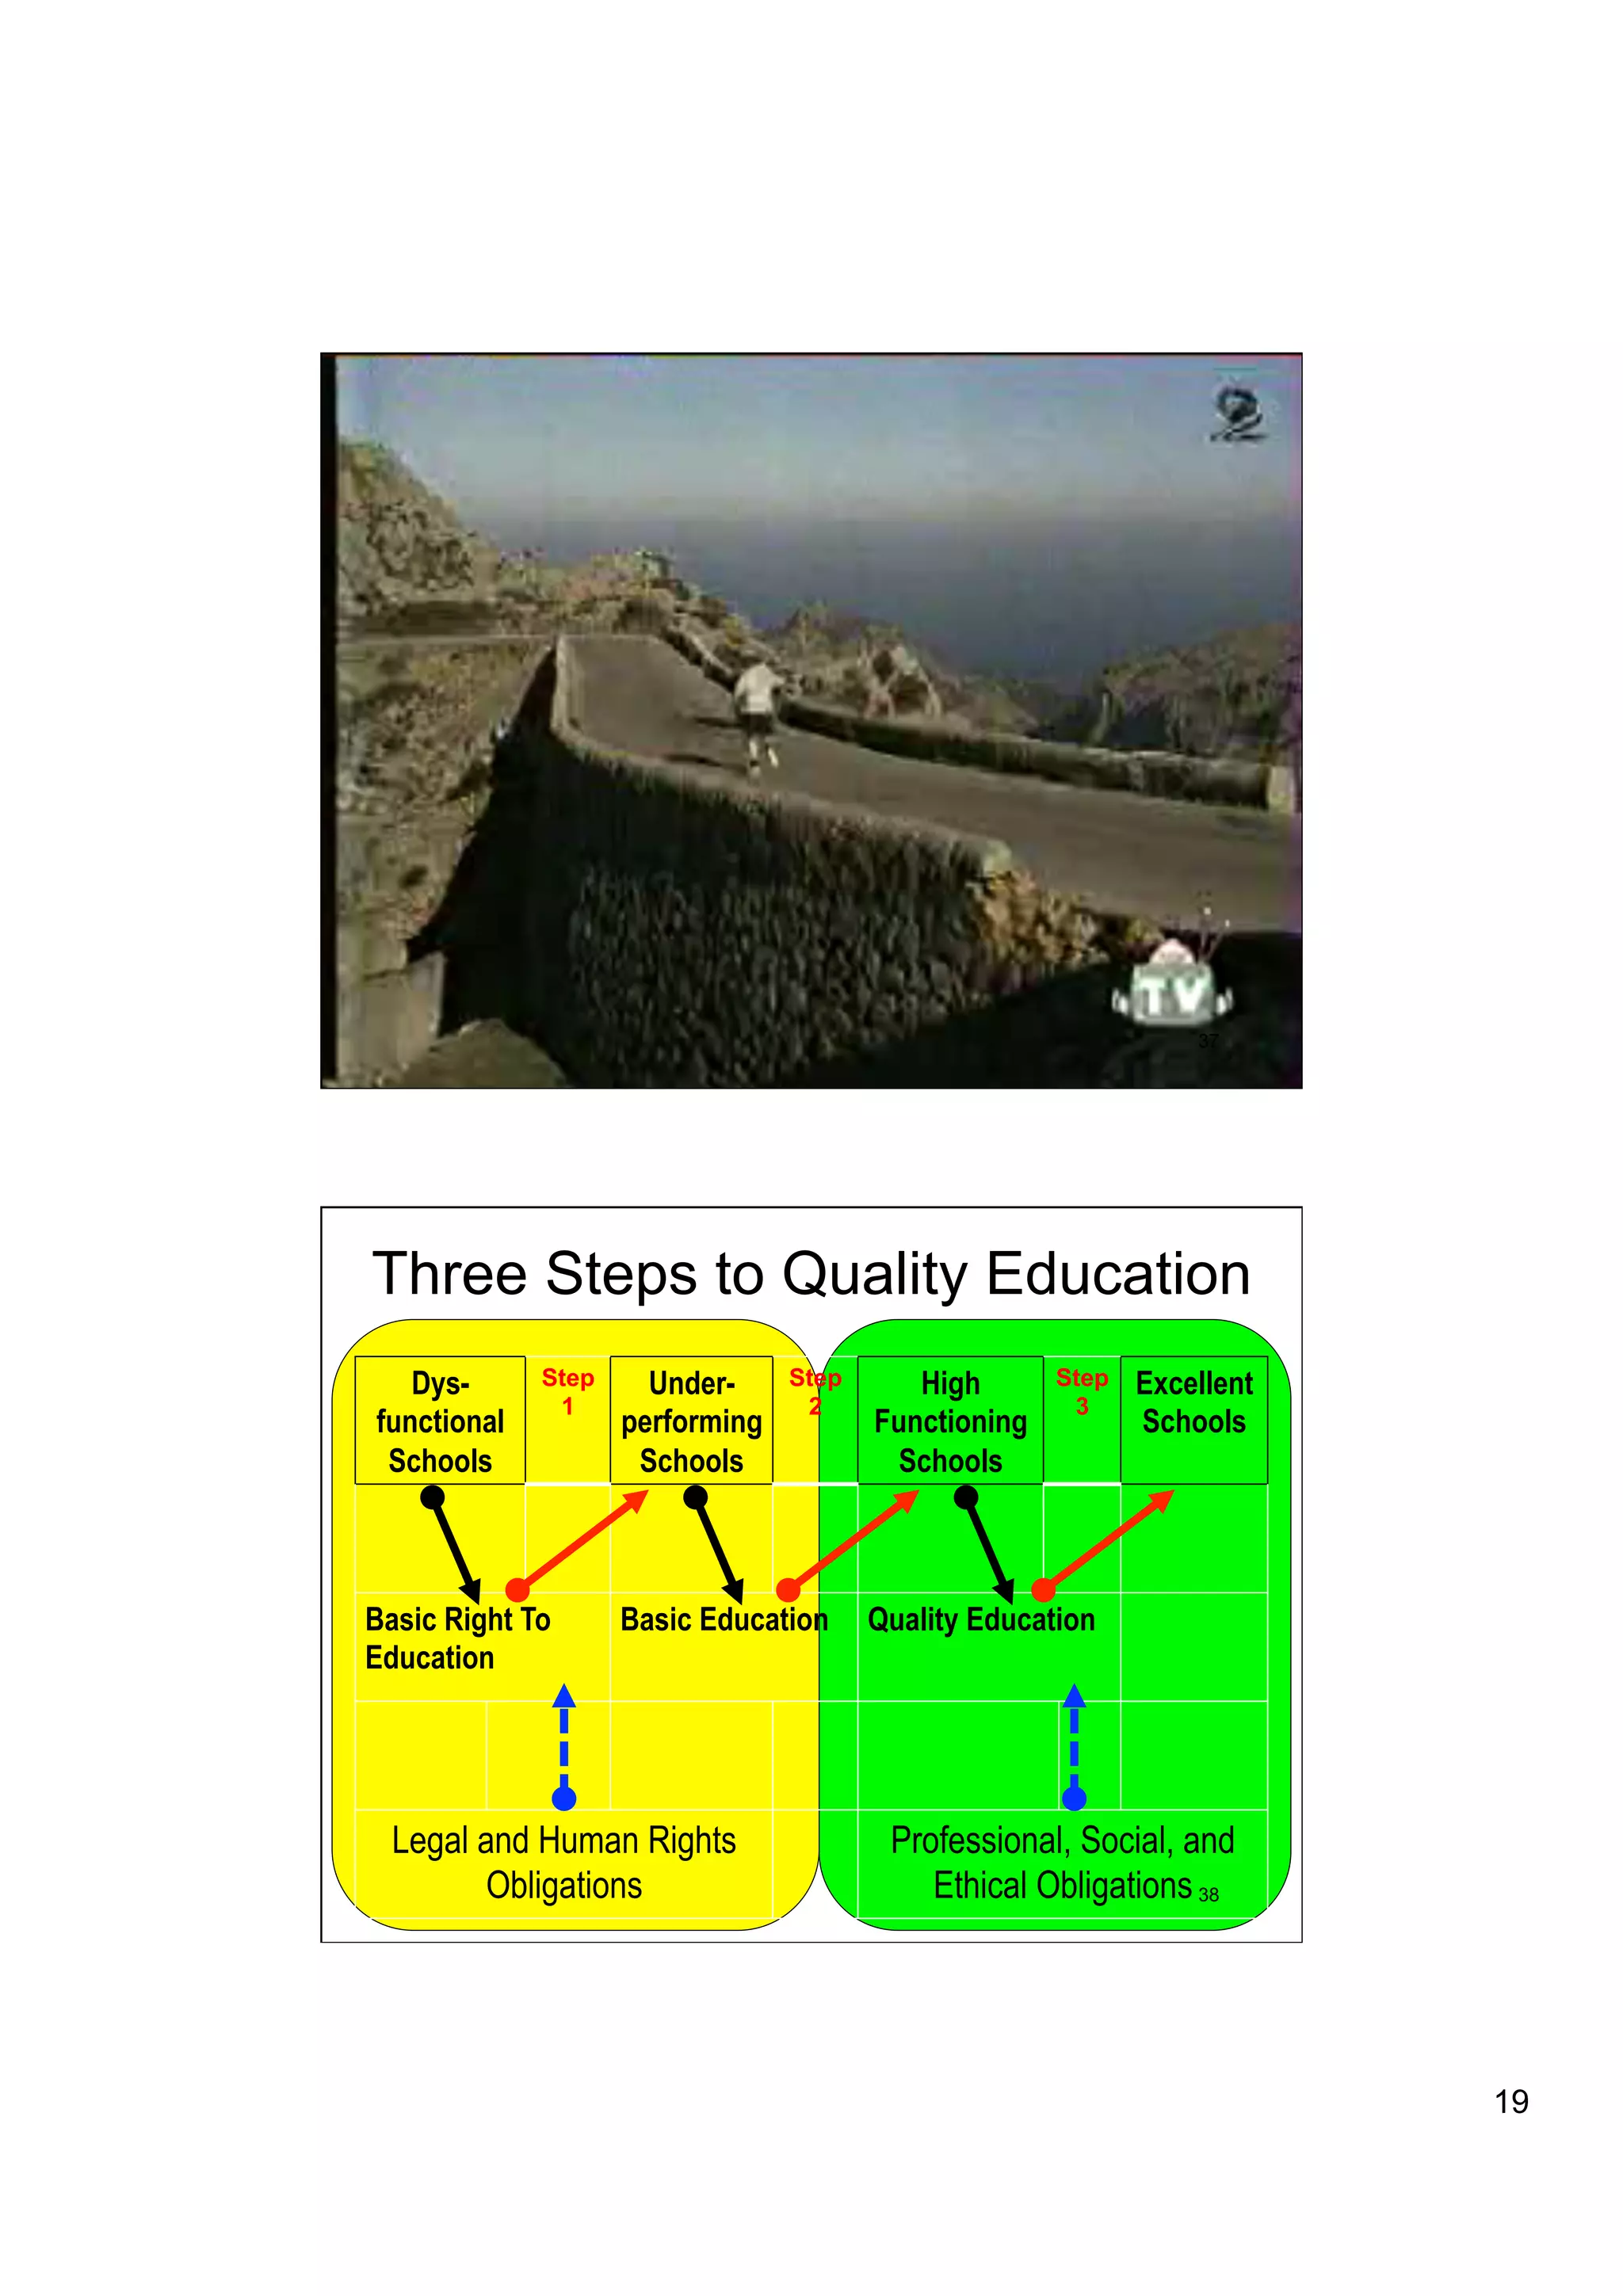
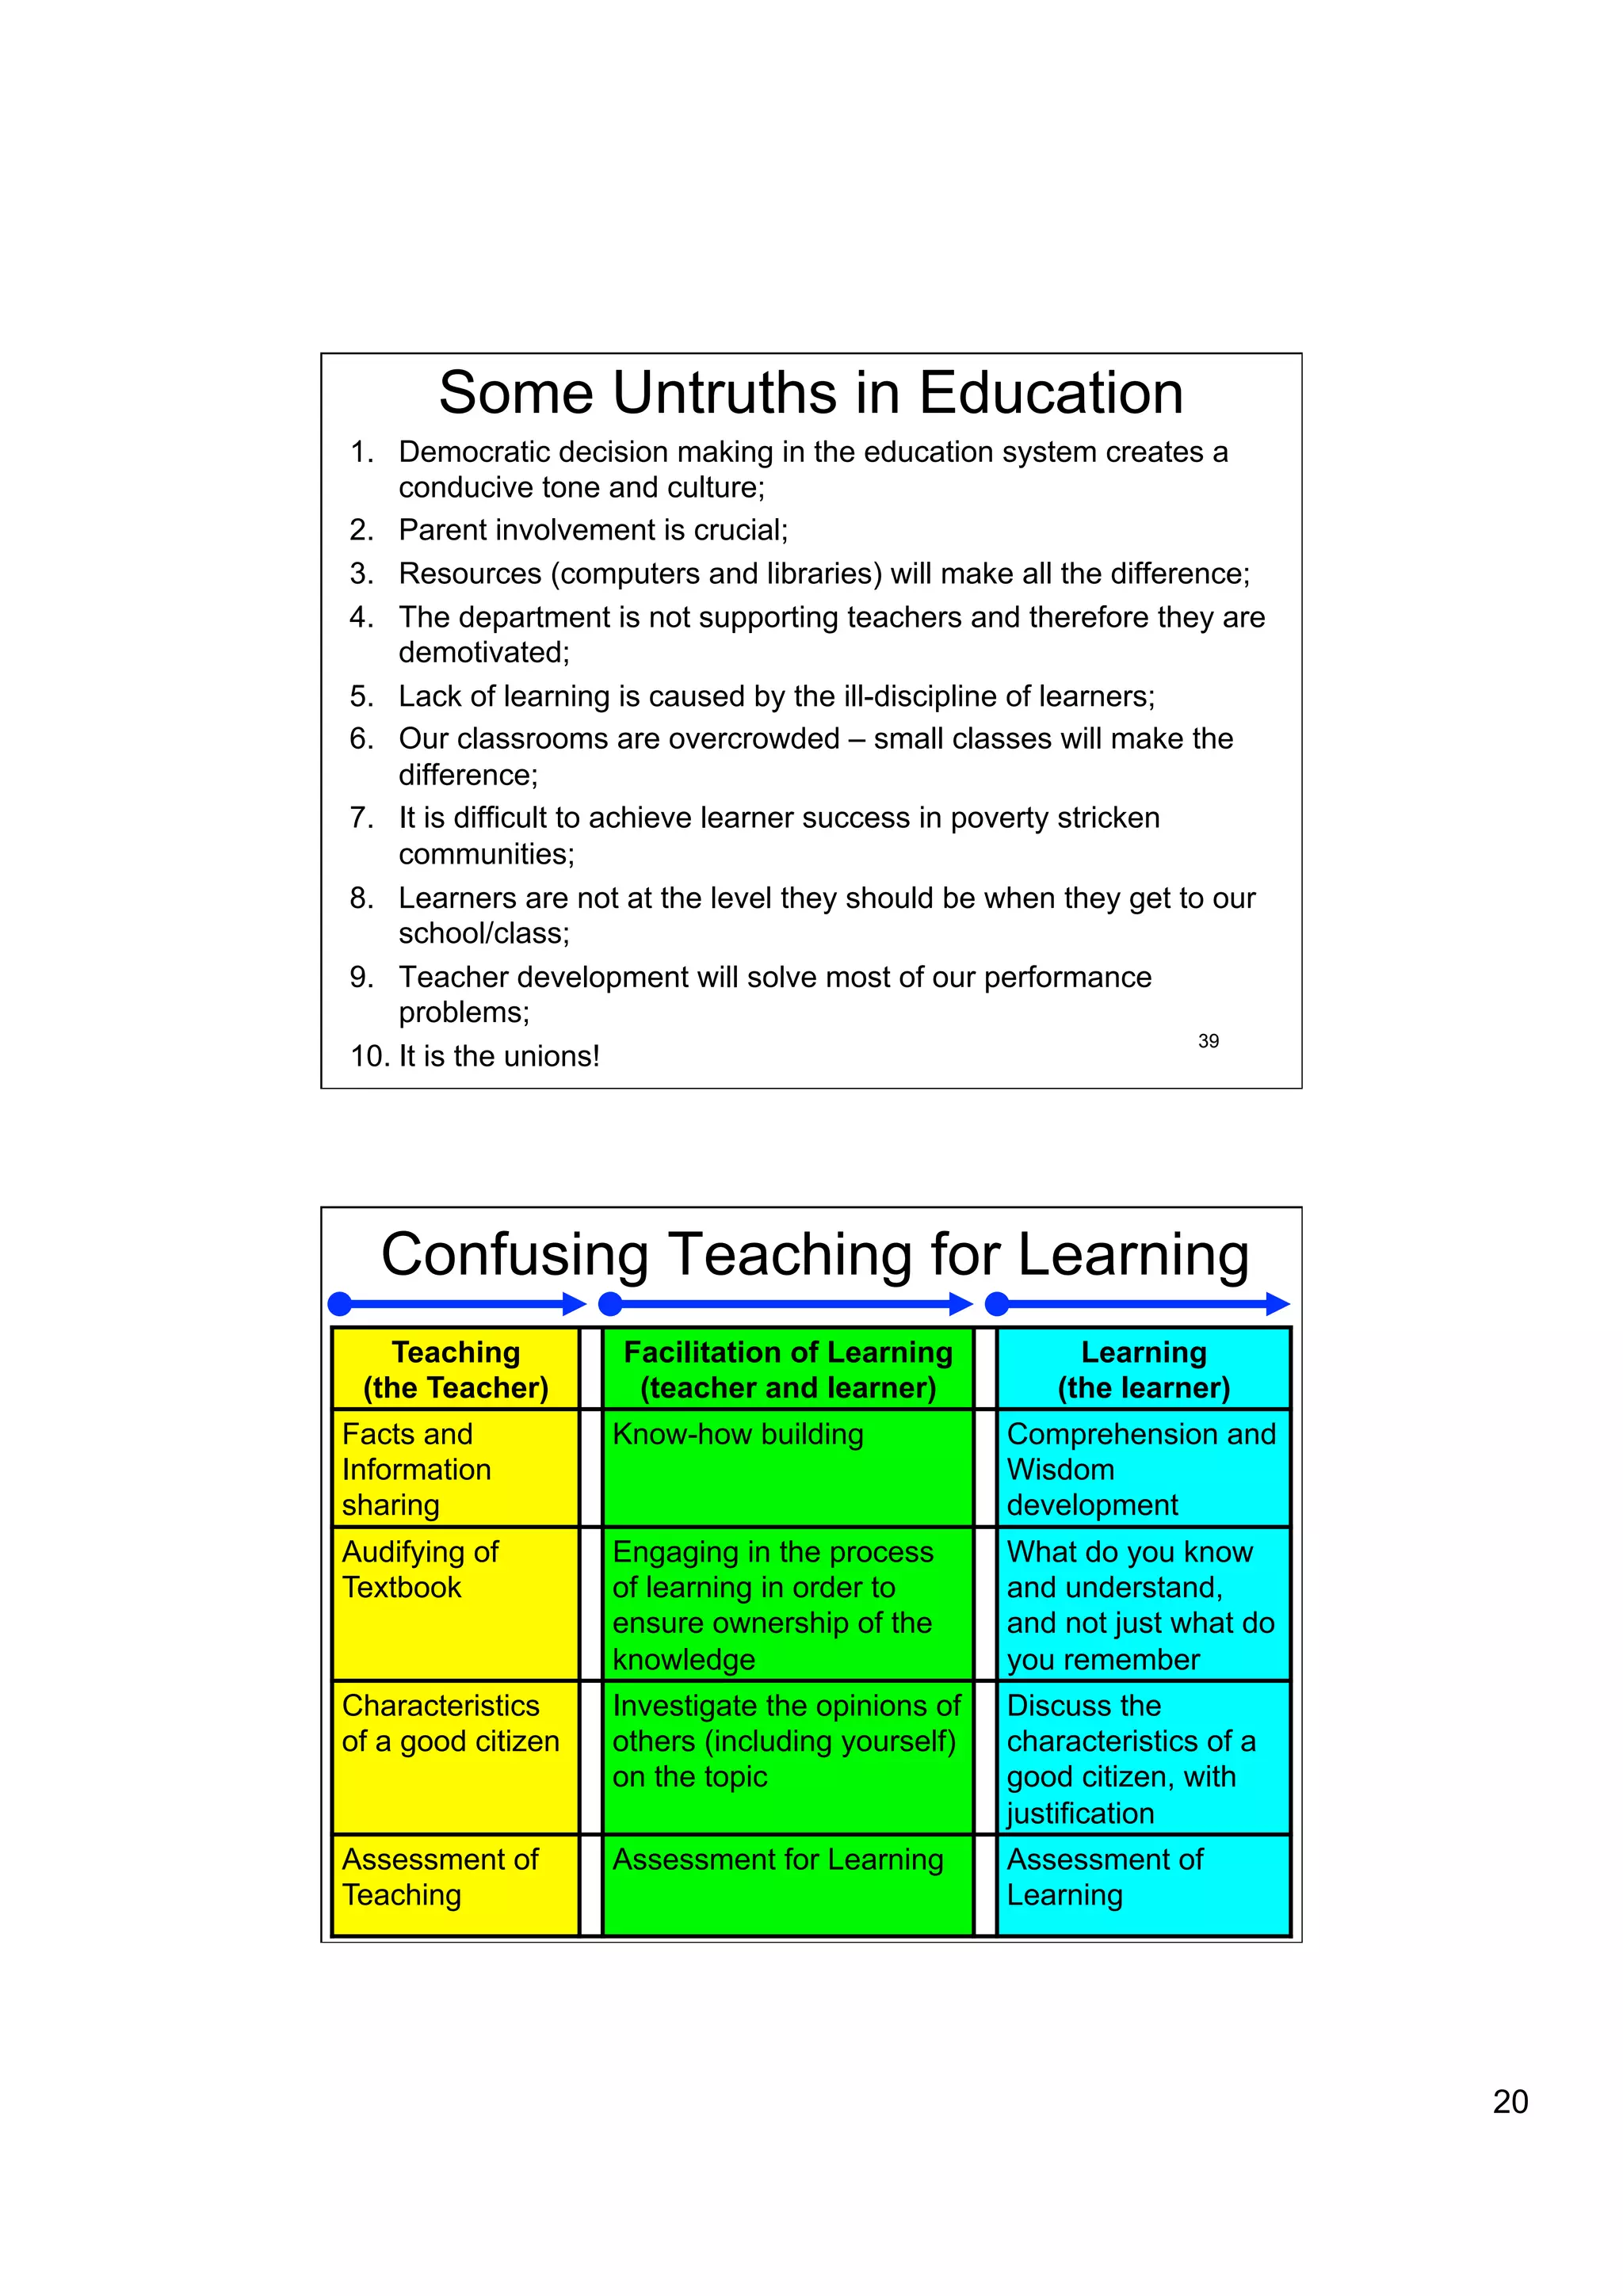
TeachSA!
    The state of education in South
       Africa and the challenges
    facing our country … with some
                solutions.


                      Presenter:
                Dr Muavia Gallie (PhD)
                   4 December 2012
                             muavia@mweb.co.za
                      http://muavia-gallie.blogspot.com
              http://supervisingwithadifference.blogspot.com   1
                              www.slideshare.net


                         Content
1.  Awareness: We don’t know what we don’t know
    (3-13);
2.  SA Education System – Performance (14-36);
3.  Quality Education & Untruths (37-39);
4.  Supportive Ideas (40-44);
5.  Some Turnaround examples (45-52)
6.  Conclusion (53-55).
                  www.slideshare.net
               Search TeachSA 2012                             2


                                                                   1
Awareness Test

 Do we Know
 what we Don’t
     Know                   3


TIMSS Participation Countries
           2007


                            4


                                2
TIMSS 2003 - Applying
                               Maths


                                                5


                            SACMEQ Countries


  Botswana
      Kenya
    Lesotho
     Malawi
   Mauritius
Mozambique
    Namibia
  Seychelles
 South Africa
  Swaziland
   Tanzania
                              Pupil
     Uganda
                              reading
     Zambia                   sco re s
    Zanzibar
  Zimbabwe

Source: SACMEQ Data, 2007

                                                6


                                                    3
6    SACMEQ Results
        6        7    6
2      5         2    2
12     13        11   12
15     15        13   14
4      3         1    1
7      12        4    11
13     9         14   13
1      2         3    4
9      10        9    8
5      4         6    5
3      1         5    3
10     11        8    9
14     14        12   15
11     7         10   10
8      8         15   7


                           7


                           8


                               4
9


Reason for Leaving Education


                               10


                                    5
Corporal Punishment


                       11


  Teacher Age Groups


                       12


                            6
13


14


     7
15


16


     8
17


18


     9
19


20


     10
21


22


     11
23


24


     12
25


26


     13
27


28


     14
29


30


     15
31


                   Comparing Grades 1-12 from 1999 to 2012
1 350 000
1 300 000
1 250 000                                                                             1999
1 200 000                                                                             2000
1 150 000                                                                             2001
1 100 000                                                                             2002
1 050 000                                                                             2003
1 000 000
                                                                                      2004
  950 000
                                                                                      2005
  900 000
                                                                                      2006
  850 000
  800 000                                                                             2007
  750 000                                                                             2008
  700 000                                                                             2009
  650 000                                                                             2010
  600 000                                                                             2011
  550 000
                                                                                      2012
  500 000
                                                                                      Ave.
  450 000
            Grade Grade Grade Grade Grade Grade Grade Grade Grade Grade Grade Grade
  400 000     1     2     3     4     5     6     7     8     9    10    11    12     32


                                                                                             16
Gap           Gap
Comparing Grades 1-12 from 1999 to 2012                                                                                         Now %Learner Trace %Learner
                                                                                                                               Gr1 &
Year Grade 1 Grade 2       Grade 3   Grade 4 Grade 5   Grade 6 Grade 7       Grade 8     Grade 9     Grade 10 Grade 11 Grade 12 12 Retained Years   Years

1999 1,318,932 1,223,529 1,194,425 1,167,683 1,087,829 998,705 937,741 1,043,067           917,239     840,803 738,220 571,848 747,084   43%      

2000 1,055,397 1,090,765 1,178,712 1,167,949 1,088,836 1,009,782 936,454 1,039,547         922,566     836,962 724,192 549,203 506,194   52%      

2001 1,150,637   944,961 1,087,675 1,175,860 1,098,863 1,023,269 932,151 1,068,479         916,280     846,655 709,508 488,352 662,285   42%      

2002 1,286,591 1,012,892     949,721 1,076,107 1,142,806 1,038,679 958,932     936,392 1,089,404       876,175 719,952 486,786 799,805   38%   430,453   53%

2003 1,277,499 1,111,858 1,003,331 952,465 1,035,707 1,101,740 987,876         976,750     902,129 1,096,214 736,720 475,069 802,430     37%   567,998   46%

2004 1,303,016 1,109,201 1,081,956 985,139      916,911 997,365 1,050,554 1,010,710        914,729 1,057,935 829,137 505,392 797,624     39%   432,349   54%

2005 1,233,581 1,118,690 1,078,001 1,061,770 951,372 898,493 972,542 1,052,499             930,797 1,069,494 839,009 538,909 694,672     44%   459,796   54%

2006 1,185,198 1,081,652 1,099,319 1,072,780 1,026,031 919,487 872,051 1,020,734           970,946 1,093,297 890,564 568,664 616,534     48%   519,165   52%

2007 1,171,323 1,050,103 1,066,796 1,090,762 1,035,449 1,001,687 896,138       930,019     957,450 1,115,961 920,102 625,809 545,514     53%   462,020   54%

2008 1,122,114 1,031,821 1,017,656 1,050,860 1,043,012 1,001,852 964,345       926,603     902,656 1,076,527 902,752 595,216 526,898     53%   599,209   50%

2009 1,106,827 1,004,311 1,004,585 1,019,886 1,009,370 1,012,619 970,902       991,093     926,531 1,017,341 881,661 602,278 504,549     54%   621,251   49%

2010 1,116,899   994,410     972,668 1,002,645 978,983 978,016 980,747 1,001,180 1,009,327 1,039,762 841,815 579,384 537,515             52%   739,548   44%

2011 1,177,089 1,003,353     957,209 974,860 957,203 946,427 941,291 1,008,110 1,049,904 1,049,189 847,738 534,498 642,591               45%   520,899   51%

2012 1,208,973 1,074,788     967,373 966,349 939,025 935,446 912,528           971,509 1,096,113 1,103,495 874,331 551,837 657,136       46%   598,800   48%
Ave. 1,194,001 1,064,516 1,061,237 1,068,659 1,034,597 998,475 955,036         999,756     946,671     997,261 811,136 548,909   Diff          Trace
                                                                                                                                                 33


                                     Success rate = 8,1%

          • Success-rate of the system = 8,1%
          • Of every 12 learners starting Grade
          One, only 1 learner attains what the
          system is promising them - data 2005!


                                                                                                                                                 34


                                                                                                                                                               17
Access vs Success
                          Short-Listing


                                                                     Employment
   Quantity
                                                        Quality


                   Whether you Pass!                        How you Pass!
                                                                      35


                             % Different Types of schools in SA
                             Quality of Pass (Grades)
                   100%
                   90%
                   80%
                   70%
                   60%
Quantity of Pass


                   50%
                   40%                                                  20%
                   30%
                   20%                                  50%
                   10%
                   0%                     20%
                   -10%
                   -20%     10%
                             Anti-      Dysfunctional    Under-           High-
                                                                              36
                           Functional                   Performing      Performing


                                                                                     18
Japp


                                                                 37


Three Steps to Quality Education
   Dys-      Step     Under-     Step      High       Step   Excellent
              1                   2                    3
functional          performing          Functioning          Schools
 Schools             Schools             Schools


Basic Right To      Basic Education     Quality Education
Education


  Legal and Human Rights                 Professional, Social, and
        Obligations                         Ethical Obligations 38


                                                                         19
Some Untruths in Education
1.  Democratic decision making in the education system creates a
     conducive tone and culture;
2.  Parent involvement is crucial;
3.  Resources (computers and libraries) will make all the difference;
4.  The department is not supporting teachers and therefore they are
     demotivated;
5.  Lack of learning is caused by the ill-discipline of learners;
6.  Our classrooms are overcrowded – small classes will make the
     difference;
7.  It is difficult to achieve learner success in poverty stricken
     communities;
8.  Learners are not at the level they should be when they get to our
     school/class;
9.  Teacher development will solve most of our performance
     problems;
                                                                   39
10.  It is the unions!


  Confusing Teaching for Learning
   Teaching         Facilitation of Learning            Learning
 (the Teacher)       (teacher and learner)            (the learner)
Facts and           Know-how building             Comprehension and
Information                                       Wisdom
sharing                                           development
Audifying of        Engaging in the process       What do you know
Textbook            of learning in order to       and understand,
                    ensure ownership of the       and not just what do
                    knowledge                     you remember
Characteristics     Investigate the opinions of   Discuss the
of a good citizen   others (including yourself)   characteristics of a
                    on the topic                  good citizen, with
                                                  justification
Assessment of       Assessment for Learning       Assessment of
Teaching                                          Learning    40


                                                                         20
Connected vs Disconnectedness
from Learners           I see, know,
                                          understand
                                           and care
                                          about them!
                            I see, know
                                and
                            understand
                               them!
                I see and
               know them!


 I see them!
                                                  41


                                                  42


                                                        21
Know your Numbers
•  200 School days;
•  170 Teaching and Learning days;
•  34 Weeks of Teaching and
   Learning;
•  935 Hours of Teaching and
   Learning;
•  20 – 24 Hours of Examination time;
•  Account for 1800 hours of work. 43


     Labour vs Professional


                                   44


                                        22
Professionalism
•  Specialised Knowledge (a strong body of specialised
   knowledge);
•  Continued Research (propensity to evaluate current
   practice and identify and substitute redundant practice);
•  Professional Authority of the Practitioner (trust placed by
   society as result of high quality of service rendered);
•  Acknowledgement of Authority by Society (respect and
   esteem from the society);
•  Developing and Maintaining a Professional Ethical Code
   (disciplined use of oneself in valid knowledge and insight into
   self-control pertaining to use of one’s emotions);
•  Service Orientation (render a service where the interest of
   the client came first).
                                                                                                 45


                            Domains of Challenges
                                                             3.
                                                        Curriculum
                                                                              (Learners, Parents, Educators,
                                                                              Community, Business, District,


                                                       Management
                           (School Readiness)
 (Taking Responsibility)


                                                        Framework
                                                                                  Sustainability Strategy
                                                                                  SMT, Principal, SGB,


                                                 (Education, Curriculum,
       Ownership


                                Planning


                                                  Instruction, Teaching,
                                                                                         Province)


                                                 Learning, Assessment,
                                                      Expectations)


                                                        Educator BEAR
                                                   (Beliefs, Expectations,
                                                  Attitudes & Relationships
                                                                                                 46
         1.                        2.                         4.                            5.


                                                                                                               23
Student Expectation and Achievement agreement
                      (1)


Student Expectation and Achievement agreement
                      (2)


                                                24
50


     25
Student Feedback Sheet


                          Current Conversations …
•  We are making progress …; We are getting
   better …; We are getting things under
   control …; It is the union! (Education
   Officials);
•  My principal is on his way from a meeting
   … (always between district and school)
   (Principals of Schools);
•  Always blaming the department, the
   principal, parents, children, resources, etc.
   (Teachers);                                52


                                                    26
53


54


     27
Thank
You!!   55


             28

TeachSA 2012

  • 1.
    TeachSA! The state of education in South Africa and the challenges facing our country … with some solutions. Presenter: Dr Muavia Gallie (PhD) 4 December 2012 muavia@mweb.co.za http://muavia-gallie.blogspot.com http://supervisingwithadifference.blogspot.com 1 www.slideshare.net Content 1.  Awareness: We don’t know what we don’t know (3-13); 2.  SA Education System – Performance (14-36); 3.  Quality Education & Untruths (37-39); 4.  Supportive Ideas (40-44); 5.  Some Turnaround examples (45-52) 6.  Conclusion (53-55). www.slideshare.net Search TeachSA 2012 2 1
  • 2.
    Awareness Test Dowe Know what we Don’t Know 3 TIMSS Participation Countries 2007 4 2
  • 3.
    TIMSS 2003 -Applying Maths 5 SACMEQ Countries Botswana Kenya Lesotho Malawi Mauritius Mozambique Namibia Seychelles South Africa Swaziland Tanzania Pupil Uganda reading Zambia sco re s Zanzibar Zimbabwe Source: SACMEQ Data, 2007 6 3
  • 4.
    6 SACMEQ Results 6 7 6 2 5 2 2 12 13 11 12 15 15 13 14 4 3 1 1 7 12 4 11 13 9 14 13 1 2 3 4 9 10 9 8 5 4 6 5 3 1 5 3 10 11 8 9 14 14 12 15 11 7 10 10 8 8 15 7 7 8 4
  • 5.
    9 Reason for LeavingEducation 10 5
  • 6.
    Corporal Punishment 11 Teacher Age Groups 12 6
  • 7.
  • 8.
  • 9.
  • 10.
  • 11.
  • 12.
  • 13.
  • 14.
  • 15.
  • 16.
    31 Comparing Grades 1-12 from 1999 to 2012 1 350 000 1 300 000 1 250 000 1999 1 200 000 2000 1 150 000 2001 1 100 000 2002 1 050 000 2003 1 000 000 2004 950 000 2005 900 000 2006 850 000 800 000 2007 750 000 2008 700 000 2009 650 000 2010 600 000 2011 550 000 2012 500 000 Ave. 450 000 Grade Grade Grade Grade Grade Grade Grade Grade Grade Grade Grade Grade 400 000 1 2 3 4 5 6 7 8 9 10 11 12 32 16
  • 17.
    Gap Gap Comparing Grades 1-12 from 1999 to 2012 Now %Learner Trace %Learner Gr1 & Year Grade 1 Grade 2 Grade 3 Grade 4 Grade 5 Grade 6 Grade 7 Grade 8 Grade 9 Grade 10 Grade 11 Grade 12 12 Retained Years Years 1999 1,318,932 1,223,529 1,194,425 1,167,683 1,087,829 998,705 937,741 1,043,067 917,239 840,803 738,220 571,848 747,084 43%   2000 1,055,397 1,090,765 1,178,712 1,167,949 1,088,836 1,009,782 936,454 1,039,547 922,566 836,962 724,192 549,203 506,194 52%   2001 1,150,637 944,961 1,087,675 1,175,860 1,098,863 1,023,269 932,151 1,068,479 916,280 846,655 709,508 488,352 662,285 42%   2002 1,286,591 1,012,892 949,721 1,076,107 1,142,806 1,038,679 958,932 936,392 1,089,404 876,175 719,952 486,786 799,805 38% 430,453 53% 2003 1,277,499 1,111,858 1,003,331 952,465 1,035,707 1,101,740 987,876 976,750 902,129 1,096,214 736,720 475,069 802,430 37% 567,998 46% 2004 1,303,016 1,109,201 1,081,956 985,139 916,911 997,365 1,050,554 1,010,710 914,729 1,057,935 829,137 505,392 797,624 39% 432,349 54% 2005 1,233,581 1,118,690 1,078,001 1,061,770 951,372 898,493 972,542 1,052,499 930,797 1,069,494 839,009 538,909 694,672 44% 459,796 54% 2006 1,185,198 1,081,652 1,099,319 1,072,780 1,026,031 919,487 872,051 1,020,734 970,946 1,093,297 890,564 568,664 616,534 48% 519,165 52% 2007 1,171,323 1,050,103 1,066,796 1,090,762 1,035,449 1,001,687 896,138 930,019 957,450 1,115,961 920,102 625,809 545,514 53% 462,020 54% 2008 1,122,114 1,031,821 1,017,656 1,050,860 1,043,012 1,001,852 964,345 926,603 902,656 1,076,527 902,752 595,216 526,898 53% 599,209 50% 2009 1,106,827 1,004,311 1,004,585 1,019,886 1,009,370 1,012,619 970,902 991,093 926,531 1,017,341 881,661 602,278 504,549 54% 621,251 49% 2010 1,116,899 994,410 972,668 1,002,645 978,983 978,016 980,747 1,001,180 1,009,327 1,039,762 841,815 579,384 537,515 52% 739,548 44% 2011 1,177,089 1,003,353 957,209 974,860 957,203 946,427 941,291 1,008,110 1,049,904 1,049,189 847,738 534,498 642,591 45% 520,899 51% 2012 1,208,973 1,074,788 967,373 966,349 939,025 935,446 912,528 971,509 1,096,113 1,103,495 874,331 551,837 657,136 46% 598,800 48% Ave. 1,194,001 1,064,516 1,061,237 1,068,659 1,034,597 998,475 955,036 999,756 946,671 997,261 811,136 548,909 Diff Trace 33 Success rate = 8,1% • Success-rate of the system = 8,1% • Of every 12 learners starting Grade One, only 1 learner attains what the system is promising them - data 2005! 34 17
  • 18.
    Access vs Success Short-Listing Employment Quantity Quality Whether you Pass! How you Pass! 35 % Different Types of schools in SA Quality of Pass (Grades) 100% 90% 80% 70% 60% Quantity of Pass 50% 40% 20% 30% 20% 50% 10% 0% 20% -10% -20% 10% Anti- Dysfunctional Under- High- 36 Functional Performing Performing 18
  • 19.
    Japp 37 Three Steps to Quality Education Dys- Step Under- Step High Step Excellent 1 2 3 functional performing Functioning Schools Schools Schools Schools Basic Right To Basic Education Quality Education Education Legal and Human Rights Professional, Social, and Obligations Ethical Obligations 38 19
  • 20.
    Some Untruths inEducation 1.  Democratic decision making in the education system creates a conducive tone and culture; 2.  Parent involvement is crucial; 3.  Resources (computers and libraries) will make all the difference; 4.  The department is not supporting teachers and therefore they are demotivated; 5.  Lack of learning is caused by the ill-discipline of learners; 6.  Our classrooms are overcrowded – small classes will make the difference; 7.  It is difficult to achieve learner success in poverty stricken communities; 8.  Learners are not at the level they should be when they get to our school/class; 9.  Teacher development will solve most of our performance problems; 39 10.  It is the unions! Confusing Teaching for Learning Teaching Facilitation of Learning Learning (the Teacher) (teacher and learner) (the learner) Facts and Know-how building Comprehension and Information Wisdom sharing development Audifying of Engaging in the process What do you know Textbook of learning in order to and understand, ensure ownership of the and not just what do knowledge you remember Characteristics Investigate the opinions of Discuss the of a good citizen others (including yourself) characteristics of a on the topic good citizen, with justification Assessment of Assessment for Learning Assessment of Teaching Learning 40 20
  • 21.
    Connected vs Disconnectedness fromLearners I see, know, understand and care about them! I see, know and understand them! I see and know them! I see them! 41 42 21
  • 22.
    Know your Numbers • 200 School days; •  170 Teaching and Learning days; •  34 Weeks of Teaching and Learning; •  935 Hours of Teaching and Learning; •  20 – 24 Hours of Examination time; •  Account for 1800 hours of work. 43 Labour vs Professional 44 22
  • 23.
    Professionalism •  Specialised Knowledge(a strong body of specialised knowledge); •  Continued Research (propensity to evaluate current practice and identify and substitute redundant practice); •  Professional Authority of the Practitioner (trust placed by society as result of high quality of service rendered); •  Acknowledgement of Authority by Society (respect and esteem from the society); •  Developing and Maintaining a Professional Ethical Code (disciplined use of oneself in valid knowledge and insight into self-control pertaining to use of one’s emotions); •  Service Orientation (render a service where the interest of the client came first). 45 Domains of Challenges 3. Curriculum (Learners, Parents, Educators, Community, Business, District, Management (School Readiness) (Taking Responsibility) Framework Sustainability Strategy SMT, Principal, SGB, (Education, Curriculum, Ownership Planning Instruction, Teaching, Province) Learning, Assessment, Expectations) Educator BEAR (Beliefs, Expectations, Attitudes & Relationships 46 1. 2. 4. 5. 23
  • 24.
    Student Expectation andAchievement agreement (1) Student Expectation and Achievement agreement (2) 24
  • 25.
    50 25
  • 26.
    Student Feedback Sheet Current Conversations … •  We are making progress …; We are getting better …; We are getting things under control …; It is the union! (Education Officials); •  My principal is on his way from a meeting … (always between district and school) (Principals of Schools); •  Always blaming the department, the principal, parents, children, resources, etc. (Teachers); 52 26
  • 27.
  • 28.