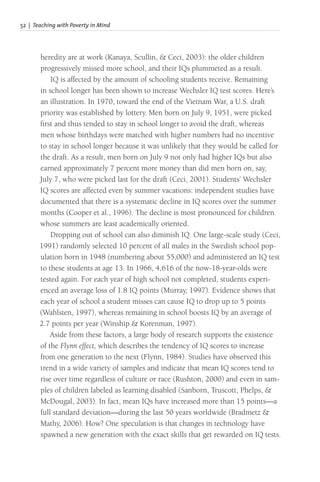
Downloaded 239 times


![8 | Teaching with Poverty in Mind
Poverty at Home
Compared with well-off children, poor children are disproportionately
exposed to adverse social and physical environments. Low-income neighbor-
hoods are likely to have lower-quality social, municipal, and local services.
Because of greater traffic volume, higher crime rates, and less playground
safety—to name but a few factors—poor neighborhoods are more hazard-
ous and less likely to contain green space than well-off neighborhoods are.
Poor children often breathe contaminated air and drink impure water. Their
households are more crowded, noisy, and physically deteriorated, and they
contain a greater number of safety hazards (National Commission on Teach-
ing and America’s Future [NCTAF], 2004).
Although childhood is generally considered to be a time of joyful, care-
free exploration, children living in poverty tend to spend less time find-
ing out about the world around them and more time struggling to survive
within it. Poor children have fewer and less-supportive networks than their
more affluent counterparts do; live in neighborhoods that are lower in
social capital; and, as adolescents, are more likely to rely on peers than on
adults for social and emotional support. Low-SES children also have fewer
cognitive-enrichment opportunities. They have fewer books at home, visit
the library less often, and spend considerably more time watching TV than
their middle-income counterparts do (Kumanyika & Grier, 2006).
Often, poor children live in chaotic, unstable households. They are more
likely to come from single-guardian homes, and their parents or caregivers
tend to be less emotionally responsive (Blair et al., 2008; Evans, Gonnella,
Marcynyszyn, Gentile, & Salpekar, 2005). Single parenthood strains resources
and correlates directly with poor school attendance, lower grades, and lower
chances of attending college (Xi & Lal, 2006). Contrast these children with
their peers living in stable two-parent families, who have more access to
financial resources and parental time, receive more supervision, participate in
more extracurricular activities, and do better in school (Evans, 2004).
Young children are especially vulnerable to the negative effects of change,
disruption, and uncertainty. Developing children need reliable caregivers who
offer high predictability, or their brains will typically develop adverse adaptive
responses. Chronic socioeconomic deprivation can create environments that
undermine the development of self and the capacity for self-determination](https://image.slidesharecdn.com/e-book-teachingwithpovertyinmind-220810093802-2489c4ac/85/E-Book-Teaching-with-poverty-in-mind-PDF-15-320.jpg)
![78 | Teaching with Poverty in Mind
of performance, but too much data can overwhelm a staff. Keep yourself
sane by setting a limited number of measurable achievement goals for the
lowest-scoring students and targeting the specific standards where achieve-
ment is lowest.
Use multiple data sources (e.g., interim classroom test results, student
portfolios, teacher-created strength analyses, or schoolwide student inven-
tories) to answer your questions and different data sets to provide differ-
ent kinds of information about student performance. Resist the common
temptation to use a single form of data to understand your students; it won’t
be enough. To be useful, data sets must focus on the academic issues that
matter most, including working memory (Automated Working Memory
Assessment [AWMA], Working Memory Rating Scale [WMRS], or Working
Memory Test Battery [WMTB-C]); language (Speed and Capacity of Language
Processing Test [SCOLP]); and sequencing and processing (Woodcock-
Johnson III). These skills enhance students’ abilities to meet academic
requirements, and all of them can be honed.
The better your school gets at data gathering, the more specific your data
requirements will become. But first and foremost, your data must be specific,
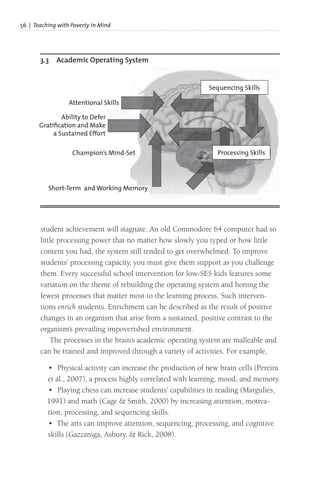
continuous, accurate, relevant, and fast. SCARF is a handy mnemonic to keep
these essential qualities in mind.
Keep tweaking the quantity of data. You’ll be able to mine existing data
by collecting and managing relevant information on school performance
and characteristics. But you’ll also need the relatively new data forms men-
tioned above.
Analyze and share the data. You will need to be able to translate data for
educators, parents, community members, and policymakers, so your data
should be user-friendly. You may have some in-house resources to do this
for you, but if not, you may be able to get help from a nearby university or
psychologist or a data analysis firm. Although the task of comprehensive
data collection and analysis may seem daunting, there are many simple and
easy-to-understand visual tools available, including
• Spreadsheet databases.
• Column charts that allow visual comparison.
• Pareto charts to identify priorities.](https://image.slidesharecdn.com/e-book-teachingwithpovertyinmind-220810093802-2489c4ac/85/E-Book-Teaching-with-poverty-in-mind-PDF-85-320.jpg)

![140 | Teaching with Poverty in Mind
are bored; many staff members will need empirical evidence before they can
accept that the kids they are teaching are not compelled to even participate.
Communicate the evidence and make a plan. Once you have the data,
share them with the staff in a nonthreatening way. Do not say “This is how
boring you are,” but “This is what our kids say.” The survey is just feedback,
not a crucifixion. Then, consult available resources, brainstorm as a group,
or solicit ideas from the most engaging teachers to develop a list of engage-
ment strategies for each teacher to use.
Add a strategy each week and monitor progress. Engaging students
means more than increasing social interactions or using more technology.
In fact, highly engaging teachers tend to use a host of strategies that keep
students involved nonstop in the learning process (Jensen, 2003). Most
teachers can succeed if they have just one new strategy to apply each week.
Let them try something out, get comfortable with it, tweak it, and make it
automatic. The goal is to manage students’ emotional states to make them
receptive to learning as much of the time as possible. It can be done, and
here’s how to do it:
• Switch up social groups. Mix up the class time so that kids are only
in one social grouping for 10–20 minutes at a time. Use study buddies,
assigned teams, whole-class activities, or temporary ad hoc partnerships.
• Incorporate movement through learning stations, class switching, and
assemblies. Class switching allows teachers who are strong in physical
activities to take on another teacher’s kids for a short time both to show
the other teacher how to incorporate movement and to give the kids a
high-energy physical break. Assemblies can incorporate energizing fan
rituals like dancing or the wave.
• Ask more compelling questions; avoid unanswerable rhetorical ques-
tions. Include your entire class in your questions: instead of asking “Who
saw [XYZ movie] last weekend?” ask “How many of you have seen or expe-
rienced this in your life?” This way, you end up including those who didn’t
see the movie but who share a common experience featured in the movie.
• Appreciate and acknowledge every response. When you make a habit
of thanking students for putting themselves out there, you’ll see more
hands up in the air. Don’t feel the need to evaluate everything they say.](https://image.slidesharecdn.com/e-book-teachingwithpovertyinmind-220810093802-2489c4ac/85/E-Book-Teaching-with-poverty-in-mind-PDF-147-320.jpg)
![160 | Teaching with Poverty in Mind
Herman, J., & Gribbons, B. (2001). Lessons learned in using data to support school inquiry and
continuous improvement: Final report to the Stuart Foundation. Los Angeles: Center for the
Study of Evaluation.
Herrera, C., Grossman, J. B., Kauh, T. J., Feldman, A. F
., & McMaken, J., with Jucovy, L. Z.
(2007, August). Making a difference in schools: The Big Brothers Big Sisters school-based men-
toring impact study. Philadelphia: Public/Private Ventures.
Hill, N. E., Bromell, L., Tyson, D. F
., & Flint, R. (2007). Developmental commentary: Ecologi-
cal perspectives on parental influences during adolescence. Journal of Clinical Child and
Adolescent Psychology, 36(3), 367–377.
Hillman, C. H., Castelli, D. M., & Buck, S. M. (2005). Aerobic fitness and neurocognitive
function in healthy preadolescent children. Medicine and Science in Sports and Exercise,
37(11), 1967–1974.
Hoff, E. (2003). The specificity of environmental influence: Socioeconomic status affects early
vocabulary development via maternal speech. Child Development, 74(5), 1368–1378.
Hoffman, A. M. (1996). Schools, violence, and society. Westport, CT: Praeger Publishers.
Hsuch, J., & Yoshikawa, H. (2007). Working nonstandard schedules and variable shifts in low-
income families: Associations with parental psychological well-being, family functioning,
and child well-being. Developmental Psychology, 43(3), 620–632.
Hussey, J. M., Chang, J. J., & Kotch, J. B. (2006). Child maltreatment in the United States:
Prevalence, risk factors, and adolescent health consequences. Pediatrics, 118(3), 933–942.
Huttenlocher, J. (1998). Language input and language growth. Preventive Medicine, 27(2),
195–199.
Huttenlocher, J., Haight, W., Bryk, A., Seltzer, M., & Lyons, R. (1991). Early vocabulary
growth: Relation to language input and gender. Developmental Psychology, 27(2), 236–248.
Isaacs, E. B., Gadian, D. G., Sabatini, S., Chong, W. K., Quinn, B. T., Fischl, B. R., et al. (2008).
The effect of early human diet on caudate volumes and IQ. Pediatric Research, 63(3),
308–314.
Izawa, C. (2000). Total time and efficient time management: In search of optimal learning and
retention via study-test-rest presentation programs. American Journal of Psychology, 113(2),
221–248.
Jack, G., & Jordan, B. (1999). Social capital and child welfare. Children and Society, 13,
242–256.
Jaeggi, S. M., Buschkuehl, M., Jonides, J., & Perrig, W. J. (2008). Improving fluid intelligence
with training on working memory. Proceedings of the National Academy of Sciences of the
United States of America, 105(19), 6829–6833.
Jekielek, S., Moore, K. A., & Hair, E. (2002, February). Mentoring: A promising strategy for
youth development. Child Trends [research brief]. Available: www.mentoring.ca.gov/pdf/
MentoringBrief2002.pdf
Jensen, E. (2003). Tools for engagement. Thousand Oaks, CA: Corwin Press.
Jensen, E. (2005). Teaching with the brain in mind. Alexandria, VA: ASCD.
Jensen, E., & Nickelsen, L. (2008). Deeper learning: 7 powerful strategies for in-depth and longer-
lasting learning. Thousand Oaks, CA: Corwin Press.
Jerald, C. D. (2001). Dispelling the myth revisited: Preliminary findings from a nationwide analysis
of “high-flying” schools. Washington, DC: The Education Trust.
Jiaxu, C., & Weiyi, Y. (2000). Influence of acute and chronic treadmill exercise on rat brain
POMC gene expression. Medicine and Science in Sports and Exercise, 32(5), 954–957.](https://image.slidesharecdn.com/e-book-teachingwithpovertyinmind-220810093802-2489c4ac/85/E-Book-Teaching-with-poverty-in-mind-PDF-167-320.jpg)

![Hjm`oci,3+'+++`_p^odjikmja`nndjigncq`
ejdi`_oc`nnj^dodjiajmNpk`mqdndjii_pmmd^pgph
?`q`gjkh`io#N?$'rjmg_rd_`g`midib
^jhhpidotjao`^c`mn'kmdi^dkgn'npk`mdio`i_`ion'
^pmmd^pgph_`q`gjk`mn'i_joc`mdinomp^odjig
g`_`mn)Ocdn`q`m(bmjrdibjmbiduodjidn
_`_d^o`_ojg`midibi_o`^cdibi_oc`
np^^`nnja`^cnop_`io)
H`h]`mnm`^`dq`oc`rm_(rdiidibhbudi`
@_p^odjigG`_`mncdki_hitjoc`mqgp]g`
]`i`Ø
on'di^gp_dib]jjfngdf`ocdnji`)
H`h]`mncdknm`qdg]g`amjhngjrnPN-4)
EjdiN?Oj_t
Ojg`mihjm`'bjojrrr)n^_)jmb*g`mihjm`
jm^gg#ojgg(am``dioc`Pido`_Noo`ni_
i_$53++(4..(N?#-2-.$jm
2+.(023(41++)
G`miHjm`:
O Y f l l g
www.ascd.org/learnmore
1703 North Beauregard Street,Alexandria,VA 22311-1714 USA](https://image.slidesharecdn.com/e-book-teachingwithpovertyinmind-220810093802-2489c4ac/85/E-Book-Teaching-with-poverty-in-mind-PDF-194-320.jpg)

This document discusses how poverty affects children's academic performance and what schools can do to help. It describes the nature of poverty, outlining different types such as situational, generational, urban and rural poverty. It discusses the effects of poverty on children, including emotional, social, health and cognitive challenges. Children living in poverty often face unstable home environments with fewer resources and opportunities for enrichment compared to wealthier children. The document proposes that schools can help mitigate these challenges through appropriate strategies and support.