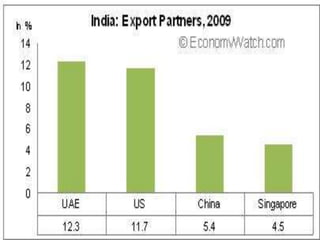
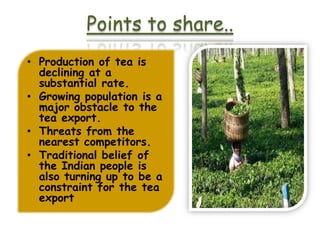
Contents
•   An over view of Indian
    exports
•    Introduction ( Indian Tea)
•    Brief history of tea
•    Indian tea Exports in the
    past
•    Major competitors of
    India
•    Major destination of Tea (
    India)
•    Production of tea
•    Export of value-added tea
    from       India
•    Reasons for the declining
    export
•    Scopes for Indian tea
•    Points to share
An Overview on Indian Export
•   Indian trade has always been
    devoid of manufactured or
    industrial goods as it relies
    heavily on agriculture.

•   After India's liberalization,
    imports dominated Indian
    trade in the form of heavy
    machinery and information
    technology products and, thus,
    created an imbalance of
    trade.

•   Indian trade was impacted by
    the global recession between
    2007 and 2009.

•   Indian exports fell from
    $187.9 billion in 2008 to
    $155 billion in 2010.
Major commodities India exports
Indian Tea
• In India ,about 172 years
  old.

• Robert Bruce in 1823
  discovered tea plants
  growing wild in upper
  Brahmaputra Valley.

• In 1838 the first Indian
  tea from Assam was sent
  to United Kingdom for
  public sale.

• Located in rural hills and
  backward areas of North-
  eastern and Southern
  States.
•
•
Name of              2008-09                   2007-08                    2006-07
country      Quantity    Value         Quantity     Value         Quantity      Value
             (M kgs)     (Rs crores)   (M kgs)      (Rs crores)   (M kgs)       (Rs crores)

Russia       36.75       392.65        44.22        377.54        39.36         322.21
Kazakhstan   9.76        131.49        10.81        111.05        9.69          104.67
Ukraine      1.58        15.31         1.46         11.04         1.15          8.75
Uzbekistan   0.06        0.71          0.07         0.81          0.22          1.65
UK           18.64       212.64        17.94        166.51        22.86         214.09
Netherland   2.53        57.19         2.69         46.04         3.12          48
s
Ireland      1.49        33.58         2.15         38.56         2.37          46.73
Poland       2.99        38.33         4.45         38.09         3.94          35
USA          8.89        153.40        9.90         135.19        8.76          138.99
Canada       1.70        30.71         1.22         14.61         0.92          12.50
UAE          21.66       275.85        25.91        253.89        22.77         231.22
Australia    4.86        114.5         5.08         96.24         4.49          89.05
FINANCIAL   EASTERN INDIA (m.kg)   SOUTH INDIA (m.kg) TOTAL (m.kg)
YEAR
2002-03     639.84                 206.13             845.97

2003-04     647.94                 230.71             878.65

2004-05     673.57                 233.27             906.84

2005-06     721.47                 227.47             948.94

2006-07     748.43                 224.64             973.07

2007-08     758.27                 228.75             987.02

2008-09     734.03                 238.74             972.77
YEARS   QUANTITY(THSND KG)   VALUE(THSND RS)
1986    17257                673096
1987    21212                822685
1988    25415                910621
1989    65566                2986195
1990    72643                3982028
1991    80765                4695782
1992    58223                3663215
1993    76829                5547392
1994    52042                3925542
1995    83275                6005464
1996    82043                6258797
YEARS   QUANTITY(THSD KG)   VALUE(THSD RS)
1997    93832               8845286
1998    86187               10153607
1999    79470               8861368
2000    75045               8274199
2001    51113               6971690
2002    38347               5418807
2003    43036               6058308
2004    38276               5675256
2005    49491               6149574
2006    30916               4763035
2007    20593               4013622
2008    23632               4981921
Reasons for the declining
            export
• Continuous price cut by
  the competitor
  countries.
• Absolute dependence
  on some specific
  countries for export.
• Low Infrastructural
  development and
  improvement in service
  levels.
• Increase in the
  internal consumption
• A very concentrated
  market
Scopes for Indian tea...

               Egypt


              Indian
                tea
   Pakistan            Iran
Points to share..
• Production of tea is
  declining at a
  substantial rate.
• Growing population is a
  major obstacle to the
  tea export.
• Threats from the
  nearest competitors.
• Traditional belief of
  the Indian people is
  also turning up to be a
  constraint for the tea
  export
Continue…

• Tea, in many
  countries is
  currently on a
  downward trend
• Lack of mutual
  understanding.
• Inferior quality
  teas produced by
  many new tea-
  growing countries
Conclusion

 “ Please take care of our precious gems and
jewels.”
Tea export

Tea export

  • 2.
    Contents • An over view of Indian exports • Introduction ( Indian Tea) • Brief history of tea • Indian tea Exports in the past • Major competitors of India • Major destination of Tea ( India) • Production of tea • Export of value-added tea from India • Reasons for the declining export • Scopes for Indian tea • Points to share
  • 3.
    An Overview onIndian Export • Indian trade has always been devoid of manufactured or industrial goods as it relies heavily on agriculture. • After India's liberalization, imports dominated Indian trade in the form of heavy machinery and information technology products and, thus, created an imbalance of trade. • Indian trade was impacted by the global recession between 2007 and 2009. • Indian exports fell from $187.9 billion in 2008 to $155 billion in 2010.
  • 4.
  • 6.
    Indian Tea • InIndia ,about 172 years old. • Robert Bruce in 1823 discovered tea plants growing wild in upper Brahmaputra Valley. • In 1838 the first Indian tea from Assam was sent to United Kingdom for public sale. • Located in rural hills and backward areas of North- eastern and Southern States.
  • 8.
  • 12.
  • 15.
    Name of 2008-09 2007-08 2006-07 country Quantity Value Quantity Value Quantity Value (M kgs) (Rs crores) (M kgs) (Rs crores) (M kgs) (Rs crores) Russia 36.75 392.65 44.22 377.54 39.36 322.21 Kazakhstan 9.76 131.49 10.81 111.05 9.69 104.67 Ukraine 1.58 15.31 1.46 11.04 1.15 8.75 Uzbekistan 0.06 0.71 0.07 0.81 0.22 1.65 UK 18.64 212.64 17.94 166.51 22.86 214.09 Netherland 2.53 57.19 2.69 46.04 3.12 48 s Ireland 1.49 33.58 2.15 38.56 2.37 46.73 Poland 2.99 38.33 4.45 38.09 3.94 35 USA 8.89 153.40 9.90 135.19 8.76 138.99 Canada 1.70 30.71 1.22 14.61 0.92 12.50 UAE 21.66 275.85 25.91 253.89 22.77 231.22 Australia 4.86 114.5 5.08 96.24 4.49 89.05
  • 16.
    FINANCIAL EASTERN INDIA (m.kg) SOUTH INDIA (m.kg) TOTAL (m.kg) YEAR 2002-03 639.84 206.13 845.97 2003-04 647.94 230.71 878.65 2004-05 673.57 233.27 906.84 2005-06 721.47 227.47 948.94 2006-07 748.43 224.64 973.07 2007-08 758.27 228.75 987.02 2008-09 734.03 238.74 972.77
  • 17.
    YEARS QUANTITY(THSND KG) VALUE(THSND RS) 1986 17257 673096 1987 21212 822685 1988 25415 910621 1989 65566 2986195 1990 72643 3982028 1991 80765 4695782 1992 58223 3663215 1993 76829 5547392 1994 52042 3925542 1995 83275 6005464 1996 82043 6258797
  • 18.
    YEARS QUANTITY(THSD KG) VALUE(THSD RS) 1997 93832 8845286 1998 86187 10153607 1999 79470 8861368 2000 75045 8274199 2001 51113 6971690 2002 38347 5418807 2003 43036 6058308 2004 38276 5675256 2005 49491 6149574 2006 30916 4763035 2007 20593 4013622 2008 23632 4981921
  • 19.
    Reasons for thedeclining export • Continuous price cut by the competitor countries. • Absolute dependence on some specific countries for export. • Low Infrastructural development and improvement in service levels. • Increase in the internal consumption • A very concentrated market
  • 20.
    Scopes for Indiantea... Egypt Indian tea Pakistan Iran
  • 21.
    Points to share.. •Production of tea is declining at a substantial rate. • Growing population is a major obstacle to the tea export. • Threats from the nearest competitors. • Traditional belief of the Indian people is also turning up to be a constraint for the tea export
  • 22.
    Continue… • Tea, inmany countries is currently on a downward trend • Lack of mutual understanding. • Inferior quality teas produced by many new tea- growing countries
  • 23.
    Conclusion “ Pleasetake care of our precious gems and jewels.”