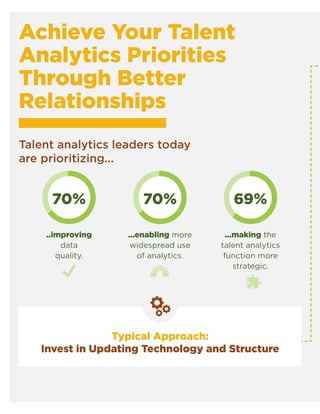
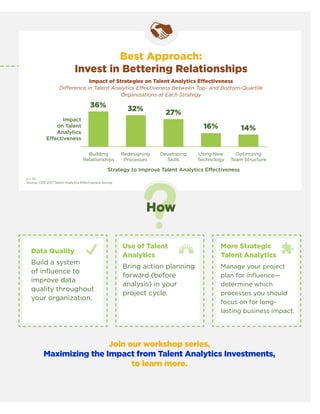
1. Talent Analytics
Quarterly
Q2 2017
In This Issue:
Maximizing Effectiveness
from Talent Analytics
Investments
Focus on What Clients
Need, Not Want
How to Build an Attrition
Prediction Model
Five Imperatives for
Organizations Embarking
on a Predictive
Analytics Journey
Driving Talent Analytics
Impact at Accenture
Making a Strategic Shift
with Data Quality
3. Q2 2017 3
Letter from
the Editor
We are pleased to announce that since releasing our last issue, we have now
hosted our first three live events for talent analytics leaders in Chicago, New
York, and Denver. At each one, the energy surrounding talent analytics was
palpable; the rooms were buzzing with peers sharing ideas and tackling key
challenges together. We hope you can join us for one of these workshops in
the future to network and learn. Through the rest of the year, we’ll be making
stops in Houston, Toronto, London, and Brussels as well as hosting virtual
events for those unable to join us in person.
We begin this issue of Talent Analytics Quarterly exploring how you can
maximize effectiveness from your talent analytics investments. From our
recent survey of over 100 talent analytics leaders, we discovered the
most effective talent analytics organizations invest not in improving their
technology or redesigning their team structure, but in bettering
their relationships.
This quarter, we also feature our regular contribution from CEB’s Talent
Management Labs with an article on starting your predictive analytics journey.
And we dive deep into case examples, exploring how HCL took a hypotheses-
based approach to building an attrition model with 90% accuracy, and how TE
Connectivity worked to establish rigorous data quality standards across
its organization.
Finally, we speak with talent analytics leaders directly. We feature two
conversations with current heads of Talent Analytics—David Grainger of DST
Systems and Shekar Nalle Pilli Venkateswara of Accenture—and learn how
they’ve built their functions and shaped their work for strategic impact.
As always, we welcome your feedback and suggestions for how we can
improve this publication for you and your teams. Please direct any comments
or questions to TalentAnalyticsHelp@cebglobal.com.
Sincerely,
Brian Kropp
Practice Leader
CEB Corporate Leadership CouncilTM
5. Q2 2017 5
Join our workshop series,
Maximizing the Impact from Talent Analytics Investments,
to learn more.
Best Approach:
Invest in Bettering Relationships
Impact of Strategies on Talent Analytics Effectiveness
Difference in Talent Analytics Effectiveness Between Top- and Bottom-Quartile
Organizations at Each Strategy
n = 111.
Source: CEB 2017 Talent Analytics Effectiveness Survey.
How
Data Quality
Build a system
of influence to
improve data
quality throughout
your organization.
Use of Talent
Analytics
Bring action planning
forward (before
analysis) in your
project cycle.
More Strategic
Talent Analytics
Manage your project
plan for influence—
determine which
processes you should
focus on for long-
lasting business impact.
Impact
on Talent
Analytics
Effectiveness
Strategy to Improve Talent Analytics Effectiveness
Building
Relationships
Redesigning
Processes
Developing
Skills
Using New
Technology
Optimizing
Team Structure
14%16%
27%
32%
36%
7. Q2 2017 7Q2 2017 7
The most important strategy you can deploy
is strengthening relationships.
• Improve data quality—Develop and improve data
standardization or governance, or reshape policies
related to data privacy and security.
• Enable use of analytics—Improve how clients,
including HR Business Partners, HR leaders,
and line managers, use talent analytics in their
decision making.
• Make the talent analytics function more strategic—
Build a business case for conducting advanced
analytics or prioritizing projects aligned to business
strategy, not one-off needs.
So you know what you need to achieve to improve the
effectiveness of talent analytics at your organizations,
but how to accomplish these priorities is a much more
difficult question. To answer it, we surveyed talent
analytics leaders around the globe to determine how
they currently approach their priorities and what is
working. We found that relationships, not optimized
structure or better technology, are key to achieving
talent analytics priorities and improving talent analytics
effectiveness (see infographic on p. 5).
That’s right. In a world full of data, the most important
strategy you can deploy is strengthening relationships.
These relationships may be with data owners throughout
the organization to gain access to datasets you need.
They could be relationships within your team—who has
which roles and responsibilities, and how does the team
work together to meet shared objectives? Or it could be
the relationships you have with clients, whether they are
peers in HR or executives in the organization. How you
interact with them, how you influence them, and how
you incorporate their priorities into yours all contribute
to improving relationships with these individuals.
9. Q2 2017 9
2. Improved Use of Talent Analytics: Bring
action planning forward (before analysis)
in your project cycle.
Currently, just about 1 out of 10 heads of talent analytics
believe their team is effective at driving action with talent
analytics. Most teams spend significant time building
reports or conducting sophisticated analysis, but their
clients don’t act on their work. This lack of action can have
negative consequences for your team—talent analytics
team engagement might decrease, or you might have
more difficulty proving talent analytics’ ROI. You might
miss opportunities for your clients as well—to make more
informed decisions about how to improve processes and
strategies and even how to avoid talent risks.
Many of you try to counter inaction by improving your
analysis and perhaps the way you communicate results of the
analysis to your clients. You seek to conduct robust analysis
around your clients’ challenges, and you simplify the way you
present the results through improved data visualization and
sharpened recommendations. Knowing that your analysis
will determine which actions clients should take, you only
spend time talking about changes or decisions that need to
be made after analysis is complete.
These strategies make sense, so why aren’t your clients
taking action? Doing so may be harder than you think.
Acting on talent analytics insights often requires clients to
make changes to the way they do their work or to make
decisions counter to their intuition. No matter how robust the
analysis or how clear the recommendation, they are just not
prepared to act.
Bring Action Planning Forward in Your Project Cycle
What Your Analytics Project Cycle Should Look Like
Source: CEB analysis.
To prepare clients to take action, you must establish a solid
relationship with them early in the analytics project cycle and
nurture it throughout your project cycle. You can’t wait until
after analysis is complete to start talking to your client about
how to use your data and analysis; it just won’t stick. Instead,
the best talent analytics teams bring action planning (or pre-
action planning) forward in the cycle to the scoping phase.
These teams scope projects to understand not only what kind
of data or analysis they need but also the ways their clients will
use the analysis.
ActionScoping
Action Introduced
Communication
Action Finalized
Analysis
Action Reinforced
Pre-Action Planning
Client Client ClientTalent
Analytics
Talent
Analytics
Talent
Analytics
Action PlanningRecommendation
Generation
What will you
change based on
the analysis you
want?
Here’s what I found
and propose. Do you
have what you need to
take action?
A few ways to get started:
• Create a standardized project intake form
that aligns the interests of the client and
the capability of the talent analytics team.
Project intake forms should specify the end
user of the requested data, support clients
in articulating a business case and early
hypotheses, and outline potential actions to
take based on analysis.
• Train talent analytics staff to reinforce action
or change across the analytics project cycle.
Especially for larger projects, staff should
establish regular check-ins with clients during
analysis; they can use these discussions to
update clients on how the analysis is going
but, most importantly, to prepare clients to
take action on final results.
Recommendation for Action 1
Based on the analysis, you should…
11. Q2 2017 11
Conclusion
Because talent analytics is a developing field, there are
not yet well-proven, best-practice approaches to every
challenge you face. Still, some strategies are better than
others at driving talent analytics effectiveness. The best
talent analytics organizations apply a relationships-
focused lens to their priorities. How you think about
the various relationships you have—with your teams, your
clients, and your businesses—will matter a lot more than
structure, productivity, or technology. An investment in
relationships creates a ripple effect for the rest of the work
talent analytics teams do, one that will go a long way in
transforming your team.
A few ways to get started:
• Identify influencers in your organization
who are interested in talent analytics.
Review the current list of stakeholders
you work with, and determine which ones
have been (or might be open to) using
talent analytics strategically and are well
connected in the organization.
• Turn a current tactical talent analytics
project into a more scalable opportunity.
Start with your current project queue—
is there a project one stakeholder has
requested that could have implications for
the broader organization?
How the Criteria You Use to Set Your
Team’s Priorities Should Change
Impact of Criteria on Talent Analytics
Effectivenessa
Influence of the Requestor and His
or Her Likelihood of Taking Action
You Should Ask: Does our client
have the ability to act on our
recommendations or findings?
High Impact
Fit with the Specific Capabilities
and Acumen of Your Team
You Should Ask: What project
can we do to showcase my team’s
greatest area of expertise?
High Impact
Likely Impact on Organizational
Talent Processes
You Should Ask: How can our work
integrate into key HR and business
processes?
High Impact
Source: CEB analysis.
a
Impact measured as difference in talent analytics
effectiveness between top- and bottom-quartile
organizations at following each criteria.
Managing Your Priorities
for Influence
Proactively shaping your priorities
based on what your team needs to
have long-lasting business impact
3. Most importantly, look for opportunities to improve
processes (e.g., high-potential identification,
performance management), not just individual
talent decisions.
13. Q2 2017 13
Focus on What
Clients Need,
Not Want
An Interview with
David Grainger
About DST Systems
DST Systems, Inc. (NYSE: DST) is a leading provider
of specialized technology, strategic advisory, and
business operations outsourcing to the financial
and health care industries. DST enables clients to
transform complexity into strategic advantage by
helping them continually stay ahead of and capitalize
on ever-changing customer, business, and regulatory
requirements in the world’s most demanding
industries. For more information, visit the DST website
at www.dstsystems.com.
About David Grainger
David Grainger is the
Director of HRIS Analyt-
ics at DST Systems. He
leverages experience from
both business and technol-
ogy leadership positions to
partner with the business
to balance priorities and
maximize ROI.
Q2 2017 13
15. Q2 2017 15
“Too often people jump
to the solution they
think they want. We
want them to start
talking about what
they need. You don’t
want to get caught in
simply serving curiosity
or leaving people to
interpret data that is too
broad for their needs.”
On the intake side, I created a user story template that
asks HRBPs to fill in a simple statement. Too often people
jump to the solution they think they want. We want them
to start talking about what they need. You don’t want to
get caught in simply serving curiosity or leaving people to
interpret data that is too broad for their needs.
The user story template asks them to build a short
narrative. In its simplest version, this is, “As [who], I want
[what], so that [why].” HRBPs can apply this template for
both reporting and analytics needs. For example, a good
reporting request would look like, “As a people manager,
I need the percentage turnover of high-performing team
members and the training they completed in the last
12 months. This will help me see if there is a correlation
between the two data points, so I can potentially adjust
team training to achieve a higher retention rate.”
When people come to us with their thoughts framed in
this user story, they understand what we can help them
achieve, and they are more likely to use our insights.
This interview has been edited for brevity and clarity.
17. Q2 2017 17
Talent Management (TM) Labs’ Approach
to Building Predictive Models for Attrition
TM Labs, the principle research and develop-
ment arm of CEB’s Talent Management group,
followed a rigorous, hypothesis-driven process
to build and test predictive analytics models.
The objective was to:
1. Define key management challenges or questions
to ensure proper scope,
2. Create hypotheses and collect the required data
to conduct thorough analysis,
3. Conduct a stringent review of analysis and outputs
to ensure they meet quality standards, and
4. Develop in-depth assessment of HR and talent
research to build crucial imperatives and action items
for stakeholders.
The most crucial step in the process is invariably
identifying the right talent management challenge
and translating it into the right questions. The best
HR functions:
• Focus on these challenges as topics
of investigation, and
• Reframe them as specific talent questions that
identify both the outcome they need to achieve
and where they need to focus.
It’s these types of questions that drive talent analytics
effectiveness because they are tied to tangible
results that the business and HR would like to see
and measure.
This past year, we conducted three predictive
projects around attrition across three distinct
sectors: food and beverage, pharmaceuticals, and
engineering services. The datasets ranged from 200
to 20,000 employees, and attrition rates between
11% and 32% for different talent segments. From
our investigation of data and creation of predictive
models, we have identified five distinct challenges and
corresponding solutions.
19. Q2 2017 19
So what exactly makes it so difficult to access the required
data? A lot of factors, actually. First, HR doesn’t own all
the data, and the HRIS doesn’t contain information on all
crucial predictors of talent outcomes. Also, each additional
system comes with distinct owners and taxonomies, leading
to irregularities and fragmented data. And for teams
incorporating unstructured data, they have an even more
difficult time accessing and retrieving data.
Solution 2: Identify data requirements and map
them to the right data owners.
What should you do?
Talent analytics leaders should do the following:
• Work closely with business leaders and HRBPs
to identify the right sources of data.
• Bring a business leader on board to help you gain
access to data that other functions own.
• Engage analytics leaders in other functions to identify
hidden data sources.
Members of talent analytics teams should
do the following:
• Map possible data sources the organization
can access (figure 1).
• Engage HR and business stakeholders to identify
data owners.
• Establish relationships with data owners and other
analytics functions to make it easier to gain access
to their data or expertise.
• Consider how to use unstructured data (e.g.,
résumés, performance feedback, learning feedback)
to improve your model.
Challenge 3: Even when they can get the right data,
talent analytics teams must often contend with low
data quality. In such cases, they must be innovative
enough to make the data work for the prediction
project without hampering the accuracy.
Data quality is data’s fitness to serve its purpose in a given
context. With that working definition, we found that 54% of
talent analytics heads cited data quality as the biggest barrier
to talent analytics effectiveness, and 60% cited “improving
data quality” as their top talent analytics imperative for
2017. Some common data quality issues include missing
values, lack of consistency, or purges by one team without
the knowledge of other teams, resulting in a loss of access
or gaps in datasets.
Solution 3: Diagnose and address data quality
issues before starting a project.
What should you do?
Talent analytics leaders should do the following:
• Define data quality standards for individual datasets.
• Assign designated data stewards responsible for
defining, maintaining, and improving the quality
of each dataset.
• Incorporate measures of data quality in
dashboards and reporting.
Figure 1: Sample Inventory of HR Data Sources
Attraction and Selection
Learning, Development,
and Onboarding Performance Retention/Engagement
Structured
• ATS
• Assessments
• HRIS
• HRBP Feedback
• Education Data
• LD System Data/LMS
• Internal Academy
• Learning Plan
• Learning Effectiveness Survey
• Onboarding System
• Onboarding Effectiveness
Survey
• Performance Plan
• Performance Reviews (Self/Manager/360)
• KPIs/Scorecards
• Manager Effectiveness Survey
• Performance Management
• Customer Performance
• Work Samples/Documents
• Compensation System
• Time On/Off Tracking System
• Employee Engagement Survey
• Manager Effectiveness Survey
• Exit Interview Data
Unstructured
• Selection Process Data
(Candidate résumés, cover
letters, interview scores, and
feedback from interviewer/
hiring manager)
• Feedback on Hiring Manager
Survey
• Feedback on Hiring Process
• Alumni Circles/Groups
• LD Effectiveness Survey
Text/LMS
• Learning Needs
• Informal Learning
• LD Program Feedback
• Trainer/Training Feedback
• Onboarding Process
Feedback
• MBOs/Objectives
• Manager Effectiveness Feedback
• 360-Degree Feedback
• Customer Feedback/Complaints
• Past Performance Appraisals
• Manager Reviews
• E-Mail/Calendar Data
• Internal Social Media
• Voice and Video Recordings
• Employer Value Proposition
Data
• Organization-Wide Performance
System
• Exit Interview Data
• E-Mail/Calendar Data
• Internal Social Media
Source: CEB analysis.
21. Q2 2017 21
About CEB’s Talent Management Labs
Talent Management Labs is a team dedicated to
helping CEB and its customers lead the analytic
transformation of talent management. The Labs’
scientists conduct research to ensure our talent
management products and services are built
using the most advanced thinking from a broad
range of established and emerging disciplines.
For more information on CEB or the
Talent Management Labs, please contact
TalentAnalyticsHelp@cebglobal.com.
Organizations that focus on
analytic impact—the extent
to which analysis improves
decisions and provides
actionable support to key
stakeholders—improve key
talent outcomes by an average
of 12% over the typical
organization.
Although there are two
paths to improving analytic
impact—business application
and analytics sophistication—
improving business application
alone can improve analytic
impact by as much as 14%.
Solution 5: Translate results into insights
and action steps.
What should you do?
Talent analytics leaders should do the following:
• Understand what business leaders expect; they might
ask for prediction, but they really want prescription.
Build strong recommendations and opinions based
on your understanding of the analysis results.
• Share findings early and continuously so business
leaders participate in the analysis and understand
its results.
• Ensure the business’s participation at the start of
a project to validate the choice of predictors and
make it easier to draw insights in the end.
Members of talent analytics teams should
do the following:
• Look for opportunities to show business leaders what
they should be doing differently, not confirm what they
know. Analytics is about behavior change.
• Build informal relationships with other HR staff
to learn about their work.
• Shadow employees in other analytics teams
to learn about their day-to-day work.
• Create occasions for better interactions between
data scientists and line leaders so they understand
one another’s perspective.
Through the five solutions provided, organizations can create
a roadmap to improve business application and reach their
desired level of analytics impact. Whether the objective is
to initiate the right analytics project, enhance preparedness
of analytics teams, or deliver the right answer to a business
question, incorporating these solutions will increase the
likelihood that business leaders will use data-driven insights
to improve their decisions.
23. Q2 2017 23
Lesson 2: Explore non-survey-based
sentiment indicators.
Looking for alternative data sources, the team spent a
month with a data technology analyst from HCL’s central
Enterprise Architecture team to understand what data HCL’s
systems and platforms (e.g., HRIS, innovation networking
platforms, internal service requests) capture. The purpose
was to trace the breadcrumbs employees leave through
their technology use to create hypotheses based on what
dissatisfied employees do, not what they say.
This work led them to use the number of service desk
requests raised and the satisfaction scores given as indicators
for attrition.
Expecting multiple iterations, the team kept this first model
intentionally nimble, using data from 4,000 employees from
one service line. The model predicted attrition with 45%
accuracy, so the team decided to collect more input from
business leaders and HR Business Partners (HRBPs).
Lesson 3: Talk to business and talent leaders to create
segment-specific hypotheses.
To learn what differentiated a good employee experience,
HCL identified leaders and HRBPs to speak with who had
reversed attrition in their teams or who had teams that
the model predicted with lower-than-average accuracy.
Conversations with business leaders focused on which factors
outside the organization drive attrition: the hiring intensity
in the city or state, demand for niche skills, or compensation
gaps to market. Conversations with HRBPs rounded out
the picture of how different employees perceive their work
(e.g., how their experiences differ if they are innovating new
tools or supporting routine processes). This led the analytics
team to collect data around exits in the immediate team
and to calculate compensation gap “risk zones” for different
cities and jobs.
The hypotheses created and tested based on these
conversations led to the discovery of new indicators to
add to the model, which the team expanded to 20,000
employees. Accuracy improved to 76% but business leaders,
managers, and HRBPs remained skeptical.
Lesson 4: Iterate, iterate, iterate.
Drawing on their refined hypotheses about employee
behaviors, the talent analytics team once again collaborated
with the data technology team to dig deeper into the traces
employees leave in technology systems. This investigation
led them to discover what they termed the “tech trigger,”
a combination of three factors: employees who study the
exit process on the intranet without activating it, visit their
leave balance tracker, and download their pay stub within
a short period of time have the highest tendency to leave.
The Evolution of HCL’s Attrition
Prediction Model
Source: CEB analysis.
Iteration 1 Variables
• Employee demographics (e.g., age,
gender, tenure, business unit, distance
from home to work)
• Work environment (e.g., move to
manager with a lower 360-degree
feedback score, number of team
members in the same location)
• Work structure/engagement (e.g.,
quality of project, engagement score)
• Performance (e.g., performance rating)
Iteration 2 Variables
• Employee demographics
• Work environment
• Work structure/engagement
(e.g., type of role, exits in team)
• Performance (e.g., drop in
performance rating by one or two
points)
• External variables (e.g., salary gap to
market, attrition in specific skill set,
demand for skill at city or region level)
Iteration 3 Variables
• Employee demographics
• Work environment
• Work structure/engagement (e.g.,
tech trigger: study but don’t activate
exit process, check remaining leave,
download pay stub)
• Performance
• External variables
This final data discovery work took six months and resulted
in a model with around 90% accuracy, meaning 9 out of 10
times, when the model tags an employee as high risk for
leaving in the next six months, the employee indeed resigns
in that time frame.
Lesson 5: Drive actions with predictions.
Even the most accurate prediction will not stop that employee
from leaving. The team therefore decided they had to create
recommendations for direct managers to act on. They
created a monthly report to highlight trends and predictions
for different groups of employees and recommend actions
25. Q2 2017 25
About Accenture
Accenture is a leading global professional services
company, providing a broad range of services and
solutions in strategy, consulting, digital, technology,
and operations. Combining unmatched experience
and specialized skills across more than 40 industries
and all business functions—underpinned by the
world’s largest delivery network—Accenture works
at the intersection of business and technology to
help clients improve their performance and create
sustainable value for their stakeholders. With
approximately 401,000 people serving clients in more
than 120 countries, Accenture drives innovation to
improve the way the world works and lives.
About Shekar Nalle Pilli
Venkateswara (Shekar NV)
Shekar Nalle Pilli Venkateswara
(Shekar NV) leads global talent
analytics for Accenture. His
team of data scientists around
the world helps inform the
company’s talent strategy.
Passionate about technology
and innovation, Shekar holds
a broad range of HR experience in talent analytics and
workforce planning. Prior to Accenture, Shekar was
Marriott International’s senior director of HR Analytics
and Talent Management. In addition, he has held leader-
ship positions in workforce planning and talent analytics
at Hewlett-Packard and Capital One.
Shekar holds an MBA in finance and strategy from
Vanderbilt University and currently lives in Virginia
with his family. In his spare time, he is actively involved
in organizing STEM programs at his teenage son
Yash’s school.
Driving Talent
Analytics Impact
at Accenture
An Interview with
Shekar Nalle Pilli
Venkateswara
Q2 2017 25
27. Q2 2017 27
A great analytics leader will
be someone who not only
has a background in data
but also has a vision for how
to use data and analytics.
ROI but are also the easiest to implement. We prioritize
those projects that fall in this quadrant—it pulls both the
high-quality insight and actionability levers.
Can you give us any examples of high-impact talent
analytics projects you’ve worked on?
SHEKAR: We’ve done several innovative analytics projects
related to inclusion and diversity. For example, our top
leadership tasked us with assessing our leave policies to
determine if we were offering all that we could to help
new parents navigate the challenges of raising a family
while pursuing their careers. To do so, we did a very
rigorous statistical analysis to find the ideal leave policies
in our geographies. This helped lead to the decision
to significantly expand maternity and paternity leave
benefits in Argentina, India, Malaysia, the Philippines, and
the United States.
This has very positively affected our people. It provides
new parents who choose to be at home following the birth
or adoption of a child with greater support and helps to
ease their transition back to work. In addition, since we’ve
rolled out our enhanced maternity leave policy in these
geographies, we’ve seen a sizeable reduction in moms
leaving their job after the birth or adoption of a child. It
was a win for our people, our company, and the industry in
general—and we believe we’re impacting society at large.
How are you tracking the progress of your current
diversity-driven practices?
SHEKAR: We prepare long-term forecasts to see how our
current practices will drive results by 2020, 2030, and so
on. We have also developed very sophisticated techniques
to see the impacts of our hiring rate, promotion rate,
retention rate, etc. to predict what the future workforce
will look like at Accenture. If we don’t like a predicted
outcome, we can be proactive and determine the best
ways to change it—an ability we didn’t have in the past.
With this approach, we are not only being a lot more
ambitious in thinking about where we want to be, but we
are also devising strategies for getting there. That’s where
the real transformation is happening.
Can you give us an example of a successful intervention?
SHEKAR: Our analysis around our talent pipeline and the
extent to which we were engaging women during the
interview process helped us launch several new innovative
recruiting campaigns. Some of the campaigns are digital
solutions, using different kinds of technologies that open
up our sourcing channels so more women candidates
get to know Accenture and are encouraged to apply.
We are continually innovating in this space and making
progress. In fact, we surpassed our goal of having women
comprise at least 40 percent of new hires by 2017 earlier
than expected.
What is your vision for the future of talent analytics
at Accenture?
SHEKAR: We’re heading toward more cloud-based
solutions, machine learning and deep learning, and
more artificial intelligence–based recommendations
that can suggest your next career move or learning and
mentoring opportunities. I do see us bringing a more
consumer-like experience to our people in their work
environments, like Netflix or Spotify, where through
limited user interaction, the platform comes ready with
personalized recommendations. We’ve also already
shifted toward leveraging more and more open-source
statistical packages, like R, that provide more flexibility
while simultaneously reducing cost of analysis.
Do you have any advice to help other talent analytics
leaders drive impact?
SHEKAR: Prioritization of business and data needs is
the key. You need to aggressively prioritize projects
based on the highest ROI potential as well as ease of
implementation. Second, I’d focus on articulating the
business need as clearly as possible so existing data
sources and tools can be used to provide quick and
efficient solutions.
The world of open-source technology and statistical
packages has not been fully leveraged for talent analytics.
Nowadays, analytics tools are being developed at a
fraction of their original cost, which will become the norm
for our field as well. I’d recommend using those tools and
focusing on hiring or even borrowing some key skills from
other teams in the organization to fill the talent gap.
A great analytics leader will be someone who not only
has a background in data but also has a vision for how
to use data and analytics. Having a vision is essential
for successfully embedding analytics in key processes
so decision makers have access to the critical pieces of
information they need when they need it.
This interview has been edited for brevity and clarity.
29. Q2 2017 29
Making a
Strategic Shift
with Data Quality
By Fiona Lam
70%
of talent analytics leaders rate
improving data quality as a
high or essential priority.
n = 212.
Source: CEB 2017 Future of Talent Analytics Survey.
D
ata quality rises to the top
of many priority lists, but not
just because it is foundational
to conducting effective talent analytics
work. Talent analytics leaders also
recognize its importance in painting
an accurate picture of HR’s ability to
inform business decisions.
Despite this emphasis, today’s talent analytics leaders
still face poor data quality. In fact, 54% of organizations
cited data quality as the top barrier to effective talent
analytics. So, what makes improving data quality so
difficult? There are two primary reasons:
1. Inconsistent Data Management Standards
and Processes—HR does not have a standard
set of definitions or procedures for inputting
or managing data.
2. Lack of Data-Producer Accountability for Input
Errors—Data producers, or those who are responsible
for feeding data into HR systems, are not motivated
to input accurate data.
31. Q2 2017 31
Figure 2: TE’s Q Score Dashboard
Source: TE Connectivity; CEB analysis.
Q Score
48.6%
Segment A
95.9%
97.3%
BU 1
BU 2
78.0%
92.1%
84.9%
93.7%
Segment B
98.0%
Exception Type
(All) (Multiple values)
Segment
Solve Shared Challenges
in Monthly Meetings
Monthly governance
meetings create a forum
for friendly competition
and solution sharing.
Agenda for Monthly
Governance Meeting
Attendees: talent
analytics team,
business unit
representatives, data
stewards
Timing: 30 minutes
1. Top five exceptions
across all business
units
2. Individual business
unit “hot spots”
3. Discussion of
common challenges
and resolution steps
4. How TA can support
you and next steps
1. Top five exceptions
across all business units
Figure 3: Data Quality Audit Summary
Focus on Errors Caused
by Process Issues,
Not People
Rather than placing the
blame on individual data
producers, conversations
focus on resolving
data issues over
time. This shifted the
mood of the meetings
from adversarial to
collaborative.
Data Stewards: HRBPs or
HR Generalists with prior
data experience who are
responsible for fixing
errors and conducting
root-cause analysis for the
errors in the HRIS platform
and heads of COEs review data fields
regularly to reprioritize additional fields
to standardize.
2. Increase Data Transparency
and Drive Accountability Through
a Public Q Score
The talent analytics team developed
a Q score they calculate monthly to
assess the data quality health of each
business unit. It’s determined by the
number of HRIS errors in a month and
divided by the number of employees
within each business unit. As one of TE’s
six KPIs, it incentivizes data producers
to ensure their data quality remains
in good standing.
Q score = # of HRIS errors per
month/# of employees in each
business unit.
To promote transparency and increase
peer pressure for improved Q scores,
the team publishes each Q score
in a public data quality dashboard
that all business units can access.
Once the scores are published,
the talent analytics team holds a
monthly data governance meeting
with data stewards and business
unit representatives to review shared
challenges and discuss resolution steps
as part of the continuous improvement
process. During these meetings, each
stakeholder is given a self-service
interactive Q score dashboard to
pinpoint and address the root causes
of their errors. This activity ensures
data producers feel accountable
and understand how to make future
improvements to their Q scores.
35. Q2 2017 35
O
ver the past year,
we’ve looked at a
few examples of
the corporate inequality
phenomenon—a significant
and ostensibly widening gap
between the profitability of
wealthy, high-performance
firms and less productive, less
wealthy firms.
This profitability gap naturally leads
to another gap—in the compensation,
benefits, and perks these companies
can afford for their employees. And
according to one scholar’s theory,
the rewards gap even contributes
to income inequality and social
stratification in the United States today.
One area in which larger and
wealthier organizations would seem
to have an edge is in acquiring scarce
and expensive talent in emerging
technological fields, such as artificial
intelligence (AI) and machine learning.
This idea raises concerns that tech
giants like Google and Tesla, rushing
to grab up all the AI talent they can,
will lead to brain drain at smaller firms
and even universities.
Another reason larger, wealthier
companies might have a head start in
profiting from these new technologies
centers on what those companies
already have. In a keynote address
at March’s Strata + Hadoop World
conference in San Jose, CA, Cloudera
cofounder Mike Olson warned because
machine learning depends on access
to enormous datasets, its main
beneficiaries will be big companies
that already own vast amounts of
data and can already implement these
technologies to scale, according to
Matt Asay at TechRepublic.1
In fact, the mountains of data that
we now enjoy are a direct result of
high-quality, open-source software
running on commodity hardware:
more applications churning out more
data for more people. Despite this
low-cost hardware and software and
its impact on machine learning, let’s be
clear: big enterprises are the primary
beneficiaries. Why? Olson went on to
explain that among enterprises doing
Will Machine Learning Exacerbate Corporate Inequality?
Originally appearing on Talent Daily
over $1 billion each year in revenue—
Cloudera’s target customer—“the
appetite for these [machine learning]
capabilities is insatiable” as they
“absolutely have the data at scale.”
Data, after all, is necessary to train
the machines. A small company could
have big plans, but without big data to
feed those plans, it’s a losing battle. As
such, large enterprises are in a prime
position to use big data to enrich
themselves and effectively hold off
would-be, smaller competitors.
As a partial remedy to this challenge,
Asay calls for more open datasets,
such as those created by Stanford
University’s DeepDive project.
“This is a new frontier in ‘open
source,’” he writes, “and we need to
explore it more.”
1
Matt Asay, “Why Machine Learning Benefits the Rich, and Everyone
Else Is Toast,” 17 March 2017, Tech Republic, http://www.techrepublic.
com/article/why-machine-learning-benefits-the-rich-and-everyone-
else-is-toast/?utm_content=buffer01916utm_medium=socialutm_
source=linkedin.comutm_campaign=buffer.
36. CEB HR Analytics
Leadership Academy
Just 8% of senior HR leaders
believe they are getting
significant returns on their
analytics investments.
Learn More
http://ceburl.com/1qwc
Develop your team’s skills to move
from talent reporting to talent analytics.
Learn how the CEB HR Analytics Leadership
Academy can build your HR staff’s ability to
provide actionable insights based on data
to improve business decisions.
37. Learn More
http://ceburl.com/1r3g
Our newest book, Learning Analytics,
is a must-read for LD and HR
professionals—as well as CEOs and
CFOs—who want to discover the
transformational power of effective
analytics and how it can affect
performance, talent management,
and competitive advantage.
Learning Analytics also prepares
LD professionals to make a
business case for their activities,
demonstrating what truly adds value
and where budgets should be spent.
Learning Analytics
Is your training effective? How can you improve it?
39. Q2 2017 39
Hear from Your Peers
Recent Webinars
Innovative Uses for Text Analytics
Learn about the prerequisites for conducting your first text-mining project, sources for
gathering unstructured text-based data, and ways in which organizations are using text
analytics to solve talent challenges.
Driving Diversity and Inclusion Outcomes Through Analytics
Learn how organizations use analytics to quantify and increase Diversity and Inclusion’s
impact on critical business outcomes.
The State of Talent Analytics in 2017
Hear about the key trends shaping talent analytics in 2017 and how to address
them at your organization.
Leader Analytics: Predicting How Leaders Will Perform in Context
Learn how to generate relevant, data-driven insights on your organization’s most valuable
and effective resource—its leaders.
Three Critical Obstacles to Creating Talent Analytics Capability
Hear about the foundational capabilities you need to manage data in HR and avoid
inadvertent exposure to legal risks or invalid analyses.
Q2 2017 39
40. About Talent Analytics Quarterly
We’ve heard your demand for more dedicated
support on talent analytics. Talent Analytics
Quarterly, our quarterly publication featuring
business and functional insights for talent analytics
leaders, is one of a series of new resources we have
created to meet this demand.
Feedback on what you see?
Which articles in this publication did you find
most helpful? Is there a topic or type of content
you would like to see in future editions? Send
your feedback on the Talent Analytics Quarterly
to TalentAnalyticsHelp@cebglobal.com today.