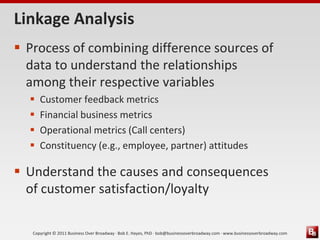
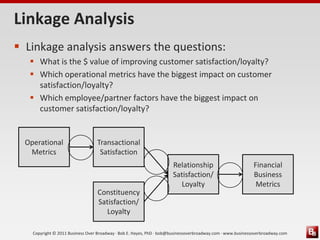
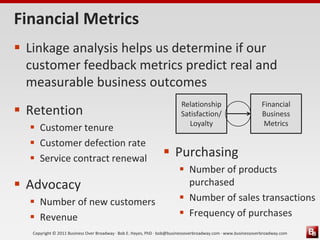
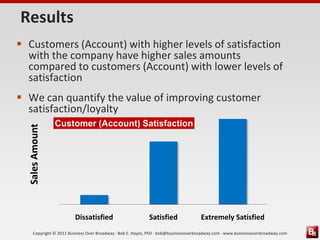
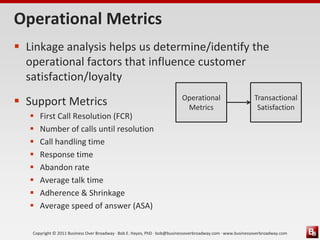
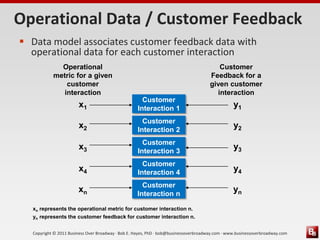
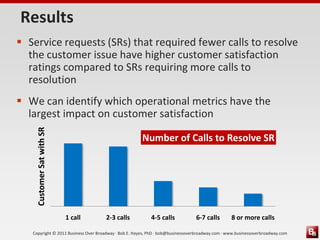
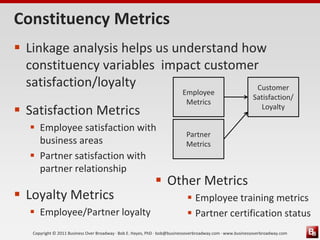
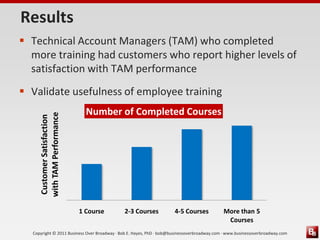
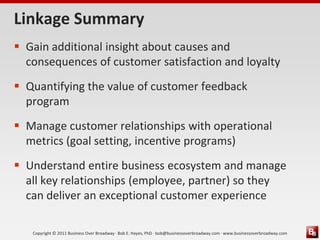
LINKAGE ANALYSIS IN CUSTOMER
FEEDBACK PROGRAMS


Bob E. Hayes, PhD
Business Over Broadway
Overview
 Linkage Analysis
 Why Conduct Linkage Studies?
 Data Management Problem
 Financial Linkage
 Operational Linkage
 Constituency Linkage


   Copyright © 2011 Business Over Broadway · Bob E. Hayes, PhD · bob@businessoverbroadway.com · www.businessoverbroadway.com
Linkage Analysis
 Process of combining difference sources of
  data to understand the relationships
  among their respective variables
     Customer feedback metrics
     Financial business metrics
     Operational metrics (Call centers)
     Constituency (e.g., employee, partner) attitudes

 Understand the causes and consequences
  of customer satisfaction/loyalty

   Copyright © 2011 Business Over Broadway · Bob E. Hayes, PhD · bob@businessoverbroadway.com · www.businessoverbroadway.com
Linkage Analysis
 Linkage analysis answers the questions:
    What is the $ value of improving customer satisfaction/loyalty?
    Which operational metrics have the biggest impact on customer
     satisfaction/loyalty?
    Which employee/partner factors have the biggest impact on
     customer satisfaction/loyalty?


  Operational                     Transactional
   Metrics                         Satisfaction
                                                                      Relationship                           Financial
                                                                      Satisfaction/                          Business
                                                                        Loyalty                               Metrics
                                  Constituency
                                  Satisfaction/
                                     Loyalty

    Copyright © 2011 Business Over Broadway · Bob E. Hayes, PhD · bob@businessoverbroadway.com · www.businessoverbroadway.com
Adoption Rate across Program Components
                                                                 Adoption Rate
                                                                                                                 ∆ in
Customer Feedback                                                Loyalty  Loyalty
                                                                                                               Adoption
Program Component                                               Leaders1 Laggards
                                                                                                                 Rate

Strategy/Governance                                                89%                    71%                  18%
Business Process
Integration
                                                                   86%                    59%                  27%
Method                                                             72%                    60%                     12%

Reporting                                                          70%                    60%                     10%

Applied Research                                                   80%                    51%                  31%

  Copyright © 2011 Business Over Broadway · Bob E. Hayes, PhD · bob@businessoverbroadway.com · www.businessoverbroadway.com
Linkage Studies Improve Customer Loyalty
                                                                                    Industry percentile ranking
                      Adopted                                                          of customer loyalty
                                                                 40             50              60              70              80
                      Not Adopted

    Statistical relationships are established
1. between customer feedback data and…
     Operational linkage
     established
Applied research using customer feedback
2. Applied research regularly
                 data is regularly conducted.
     conducted
    Statistical relationships are established
3. between customer feedback data and…
     Constituency attitude
     linkage established
       Existing information from customer
       databases is used to help segment…

    Statistical relationships are established
   between customer feedback data and…

    Copyright © 2011 Business Over Broadway · Bob E. Hayes, PhD · bob@businessoverbroadway.com · www.businessoverbroadway.com
Data Silos
 Data management problem

   Operational                                          Customer
    Metrics                                             Feedback                                             Financial
1. Call handling time                           1. Customer Loyalty
2. Number of calls until                        2. Relationship
   resolution                                      satisfaction                                      1. Revenue
3. Response time                                3. Transaction satisfaction                          2. Number of products
                                                                                                        purchased
                                                                                                     3. Customer tenure
                                                        Employee                                     4. Service contract
Partner Feedback                                                                                        renewal
                                                        Feedback                                     5. Number of sales
1. Partner Loyalty                              1. Employee Loyalty                                     transactions
2. Satisfaction with                            2. Satisfaction with                                 6. Frequency of
   partnering relationship                         business areas                                       purchases

      Copyright © 2011 Business Over Broadway · Bob E. Hayes, PhD · bob@businessoverbroadway.com · www.businessoverbroadway.com
Two Types of Surveys
 Relationship Surveys
   Measure quality of overall relationship with the customer
   Administration determined by company
      Satisfaction with business areas (e.g., product, support)
      Loyalty (retention, advocacy, purchasing)

 Transactional Surveys
   Measure specific customer transaction
   Administration determined by customer (transaction
    occurrence)
      Satisfaction with service request / technical support /
       professionalism/knowledge of staff
   Copyright © 2011 Business Over Broadway · Bob E. Hayes, PhD · bob@businessoverbroadway.com · www.businessoverbroadway.com
Types of Linkages
                                                              Customer Feedback Data Sources
                                                                    Relationship                                          Transaction
                                                                                                                       (satisfaction with specific
                                                             (satisfaction/loyalty to company)
                                                                                                                        transaction/interaction)
                                                        •Link data at customer level
Business Data Sources


                        Financial                       •Quality of the relationship (sat,
                        (revenue, number of                                                                                          N/A
                                                         loyalty) impacts financial metrics
                        sales)

                                                                                                               •Link data at transaction level
                        Operational                                                                            •Operational metrics impact
                        (call handling, response                                N/A
                                                                                                                quality of the transaction
                        time)

                                                        •Link data at constituency level                       •Link data at constituency level
                        Constituency                    •Constituency satisfaction impacts •Constituency satisfaction
                        (employee / partner
                        feedback)
                                                         customer satisfaction with overall impacts customer satisfaction
                                                         relationship                       with interaction
                           Copyright © 2011 Business Over Broadway · Bob E. Hayes, PhD · bob@businessoverbroadway.com · www.businessoverbroadway.com
Financial Metrics
 Linkage analysis helps us determine if our
  customer feedback metrics predict real and
  measurable business outcomes
                                                                         Relationship                          Financial
 Retention                                                              Satisfaction/                         Business
                                                                           Loyalty                              Metrics
   Customer tenure
   Customer defection rate
   Service contract renewal                                      Purchasing
                                                                         Number of products
 Advocacy                                                                purchased
   Number of new customers                                              Number of sales transactions
   Revenue                                                              Frequency of purchases
   Copyright © 2011 Business Over Broadway · Bob E. Hayes, PhD · bob@businessoverbroadway.com · www.businessoverbroadway.com
Customer Feedback / Financial Data
 Data model associates customer feedback data with business
  data for each customer (account)
               Customer                                                              Business metric
            Feedback for a                                                             for a given
            given customer                                                              customer
               (account)                                                                (account)
                                                     Customer
                       x1                           (Account) 1                                  y1
                                                     Customer
                       x2                           (Account) 2
                                                                                                 y2
                                                     Customer
                       x3                           (Account) 3
                                                                                                 y3
                                                     Customer
                       x4                           (Account) 4                                  y4
                                                     Customer
                       xn                           (Account) n
                                                                                                 yn

  xn represents the customer feedback for customer (account) n.
  yn represents the business metric for customer (account) n.


  Copyright © 2011 Business Over Broadway · Bob E. Hayes, PhD · bob@businessoverbroadway.com · www.businessoverbroadway.com
Results
 Customers (Account) with higher levels of satisfaction
  with the company have higher sales amounts
  compared to customers (Account) with lower levels of
  satisfaction
 We can quantify the value of improving customer
  satisfaction/loyalty
                 Customer (Account) Satisfaction
  Sales Amount


                         Dissatisfied                       Satisfied               Extremely Satisfied
     Copyright © 2011 Business Over Broadway · Bob E. Hayes, PhD · bob@businessoverbroadway.com · www.businessoverbroadway.com
Operational Metrics
 Linkage analysis helps us determine/identify the
  operational factors that influence customer
  satisfaction/loyalty
 Support Metrics                                                        Operational
                                                                          Metrics
                                                                                                            Transactional
                                                                                                             Satisfaction
      First Call Resolution (FCR)
      Number of calls until resolution
      Call handling time
      Response time
      Abandon rate
      Average talk time
      Adherence & Shrinkage
      Average speed of answer (ASA)

   Copyright © 2011 Business Over Broadway · Bob E. Hayes, PhD · bob@businessoverbroadway.com · www.businessoverbroadway.com
Operational Data / Customer Feedback
 Data model associates customer feedback data with
  operational data for each customer interaction
             Operational                                                                 Customer
           metric for a given                                                         Feedback for a
               customer                                                               given customer
              interaction                                                               interaction
                                                     Customer
                       x1                          Interaction 1                                 y1
                                                     Customer
                       x2                          Interaction 2
                                                                                                 y2
                                                     Customer
                       x3                          Interaction 3
                                                                                                 y3
                                                     Customer
                       x4                          Interaction 4                                 y4
                                                     Customer
                       xn                          Interaction n
                                                                                                 yn

  xn represents the operational metric for customer interaction n.
  yn represents the customer feedback for customer interaction n.


  Copyright © 2011 Business Over Broadway · Bob E. Hayes, PhD · bob@businessoverbroadway.com · www.businessoverbroadway.com
Results
 Service requests (SRs) that required fewer calls to resolve
  the customer issue have higher customer satisfaction
  ratings compared to SRs requiring more calls to
  resolution
 We can identify which operational metrics have the
  largest impact on customer satisfaction
     Customer Sat with SR


                                                       Number of Calls to Resolve SR


                            1 call   2-3 calls             4-5 calls            6-7 calls        8 or more calls

   Copyright © 2011 Business Over Broadway · Bob E. Hayes, PhD · bob@businessoverbroadway.com · www.businessoverbroadway.com
Results
                        Identify customer-centric metrics

                            Total Time to Resolve SR                                                   Initial Response Time
Customer Sat with SR


                       < 1 day 2-7 days 8-14 days 15-30                  > 30 days          1 day or 2 days 3 days                4-7        8-14       > 14
                                                  days                                        less                               days        days       days


                            Copyright © 2011 Business Over Broadway · Bob E. Hayes, PhD · bob@businessoverbroadway.com · www.businessoverbroadway.com
Constituency Metrics
 Linkage analysis helps us understand how
  constituency variables impact customer
  satisfaction/loyalty                   Customer
                                                                          Employee
                                                                                                           Satisfaction/
                                                                           Metrics
 Satisfaction Metrics                                                                                       Loyalty

   Employee satisfaction with
                                                                           Partner
    business areas                                                         Metrics
   Partner satisfaction with
    partner relationship
                                                              Other Metrics
 Loyalty Metrics                                                            Employee training metrics
   Employee/Partner loyalty                                                 Partner certification status
   Copyright © 2011 Business Over Broadway · Bob E. Hayes, PhD · bob@businessoverbroadway.com · www.businessoverbroadway.com
Employee / Customer: Data Model
 Data model associates employee data with customer data
  for each employee1
                 Employee                                                               Customer
                Satisfaction                                                           Satisfaction
                                                                                      with Company
                                                                                                 _
                       x1                          Employee 1                                    y1
                                                                                                 _
                       x2                          Employee 2                                    y2
                                                                                                 _
                       x3                          Employee 3                                    y3
                                                                                                 _
                       x4                          Employee 4                                    y4
                                                                                                 _
                       xn                          Employee n                                    yn
  1Analysis typically conducted for B2B customers where a given employee (sales representative, technical
  account manager, sales manager) is associated with a given customer (account)
  _n represents employee satisfaction score for Employee n.
  x
  yn represents average customer satisfaction scores across survey respondents for Employee n.

  Copyright © 2011 Business Over Broadway · Bob E. Hayes, PhD · bob@businessoverbroadway.com · www.businessoverbroadway.com
Results
 Employee groups with higher levels of satisfaction with
  the company have customers who report higher levels
  of loyalty compared to employee groups with lower
  levels of satisfaction
 We can identify which employee factors have the largest
  impact on customer satisfaction
                        Employee Satisfaction
     Customer Loyalty


                          Dissatisfied                    Satisfied                Extremely Satisfied


  Copyright © 2011 Business Over Broadway · Bob E. Hayes, PhD · bob@businessoverbroadway.com · www.businessoverbroadway.com
Results
 Technical Account Managers (TAM) who completed
  more training had customers who report higher levels of
  satisfaction with TAM performance
 Validate usefulness of employee training
                               Number of Completed Courses
     with TAM Performance
     Customer Satisfaction


                             1 Course        2-3 Courses             4-5 Courses            More than 5
                                                                                             Courses
  Copyright © 2011 Business Over Broadway · Bob E. Hayes, PhD · bob@businessoverbroadway.com · www.businessoverbroadway.com
Linkage Summary
 Gain additional insight about causes and
  consequences of customer satisfaction and loyalty
 Quantifying the value of customer feedback
  program
 Manage customer relationships with operational
  metrics (goal setting, incentive programs)
 Understand entire business ecosystem and manage
  all key relationships (employee, partner) so they
  can deliver an exceptional customer experience

   Copyright © 2011 Business Over Broadway · Bob E. Hayes, PhD · bob@businessoverbroadway.com · www.businessoverbroadway.com
For More Information


 Bob E. Hayes, Ph.D.
 Email: bob@businessoverbroadway.com
 Web: www.businessoverbroadway.com
 Blog: www.businessoverbroadway.com/blog
 Twitter: www.twitter.com/bobehayes


   Copyright © 2011 Business Over Broadway · Bob E. Hayes, PhD · bob@businessoverbroadway.com · www.businessoverbroadway.com

Linkage Analysis in Customer Feedback Programs

  • 1.
    LINKAGE ANALYSIS INCUSTOMER FEEDBACK PROGRAMS Bob E. Hayes, PhD Business Over Broadway
  • 2.
    Overview  Linkage Analysis Why Conduct Linkage Studies?  Data Management Problem  Financial Linkage  Operational Linkage  Constituency Linkage Copyright © 2011 Business Over Broadway · Bob E. Hayes, PhD · bob@businessoverbroadway.com · www.businessoverbroadway.com
  • 3.
    Linkage Analysis  Processof combining difference sources of data to understand the relationships among their respective variables  Customer feedback metrics  Financial business metrics  Operational metrics (Call centers)  Constituency (e.g., employee, partner) attitudes  Understand the causes and consequences of customer satisfaction/loyalty Copyright © 2011 Business Over Broadway · Bob E. Hayes, PhD · bob@businessoverbroadway.com · www.businessoverbroadway.com
  • 4.
    Linkage Analysis  Linkageanalysis answers the questions:  What is the $ value of improving customer satisfaction/loyalty?  Which operational metrics have the biggest impact on customer satisfaction/loyalty?  Which employee/partner factors have the biggest impact on customer satisfaction/loyalty? Operational Transactional Metrics Satisfaction Relationship Financial Satisfaction/ Business Loyalty Metrics Constituency Satisfaction/ Loyalty Copyright © 2011 Business Over Broadway · Bob E. Hayes, PhD · bob@businessoverbroadway.com · www.businessoverbroadway.com
  • 5.
    Adoption Rate acrossProgram Components Adoption Rate ∆ in Customer Feedback Loyalty Loyalty Adoption Program Component Leaders1 Laggards Rate Strategy/Governance 89% 71% 18% Business Process Integration 86% 59% 27% Method 72% 60% 12% Reporting 70% 60% 10% Applied Research 80% 51% 31% Copyright © 2011 Business Over Broadway · Bob E. Hayes, PhD · bob@businessoverbroadway.com · www.businessoverbroadway.com
  • 6.
    Linkage Studies ImproveCustomer Loyalty Industry percentile ranking Adopted of customer loyalty 40 50 60 70 80 Not Adopted Statistical relationships are established 1. between customer feedback data and… Operational linkage established Applied research using customer feedback 2. Applied research regularly data is regularly conducted. conducted Statistical relationships are established 3. between customer feedback data and… Constituency attitude linkage established Existing information from customer databases is used to help segment… Statistical relationships are established between customer feedback data and… Copyright © 2011 Business Over Broadway · Bob E. Hayes, PhD · bob@businessoverbroadway.com · www.businessoverbroadway.com
  • 7.
    Data Silos  Datamanagement problem Operational Customer Metrics Feedback Financial 1. Call handling time 1. Customer Loyalty 2. Number of calls until 2. Relationship resolution satisfaction 1. Revenue 3. Response time 3. Transaction satisfaction 2. Number of products purchased 3. Customer tenure Employee 4. Service contract Partner Feedback renewal Feedback 5. Number of sales 1. Partner Loyalty 1. Employee Loyalty transactions 2. Satisfaction with 2. Satisfaction with 6. Frequency of partnering relationship business areas purchases Copyright © 2011 Business Over Broadway · Bob E. Hayes, PhD · bob@businessoverbroadway.com · www.businessoverbroadway.com
  • 8.
    Two Types ofSurveys  Relationship Surveys  Measure quality of overall relationship with the customer  Administration determined by company  Satisfaction with business areas (e.g., product, support)  Loyalty (retention, advocacy, purchasing)  Transactional Surveys  Measure specific customer transaction  Administration determined by customer (transaction occurrence)  Satisfaction with service request / technical support / professionalism/knowledge of staff Copyright © 2011 Business Over Broadway · Bob E. Hayes, PhD · bob@businessoverbroadway.com · www.businessoverbroadway.com
  • 9.
    Types of Linkages Customer Feedback Data Sources Relationship Transaction (satisfaction with specific (satisfaction/loyalty to company) transaction/interaction) •Link data at customer level Business Data Sources Financial •Quality of the relationship (sat, (revenue, number of N/A loyalty) impacts financial metrics sales) •Link data at transaction level Operational •Operational metrics impact (call handling, response N/A quality of the transaction time) •Link data at constituency level •Link data at constituency level Constituency •Constituency satisfaction impacts •Constituency satisfaction (employee / partner feedback) customer satisfaction with overall impacts customer satisfaction relationship with interaction Copyright © 2011 Business Over Broadway · Bob E. Hayes, PhD · bob@businessoverbroadway.com · www.businessoverbroadway.com
  • 10.
    Financial Metrics  Linkageanalysis helps us determine if our customer feedback metrics predict real and measurable business outcomes Relationship Financial  Retention Satisfaction/ Business Loyalty Metrics  Customer tenure  Customer defection rate  Service contract renewal  Purchasing  Number of products  Advocacy purchased  Number of new customers  Number of sales transactions  Revenue  Frequency of purchases Copyright © 2011 Business Over Broadway · Bob E. Hayes, PhD · bob@businessoverbroadway.com · www.businessoverbroadway.com
  • 11.
    Customer Feedback /Financial Data  Data model associates customer feedback data with business data for each customer (account) Customer Business metric Feedback for a for a given given customer customer (account) (account) Customer x1 (Account) 1 y1 Customer x2 (Account) 2 y2 Customer x3 (Account) 3 y3 Customer x4 (Account) 4 y4 Customer xn (Account) n yn xn represents the customer feedback for customer (account) n. yn represents the business metric for customer (account) n. Copyright © 2011 Business Over Broadway · Bob E. Hayes, PhD · bob@businessoverbroadway.com · www.businessoverbroadway.com
  • 12.
    Results  Customers (Account)with higher levels of satisfaction with the company have higher sales amounts compared to customers (Account) with lower levels of satisfaction  We can quantify the value of improving customer satisfaction/loyalty Customer (Account) Satisfaction Sales Amount Dissatisfied Satisfied Extremely Satisfied Copyright © 2011 Business Over Broadway · Bob E. Hayes, PhD · bob@businessoverbroadway.com · www.businessoverbroadway.com
  • 13.
    Operational Metrics  Linkageanalysis helps us determine/identify the operational factors that influence customer satisfaction/loyalty  Support Metrics Operational Metrics Transactional Satisfaction  First Call Resolution (FCR)  Number of calls until resolution  Call handling time  Response time  Abandon rate  Average talk time  Adherence & Shrinkage  Average speed of answer (ASA) Copyright © 2011 Business Over Broadway · Bob E. Hayes, PhD · bob@businessoverbroadway.com · www.businessoverbroadway.com
  • 14.
    Operational Data /Customer Feedback  Data model associates customer feedback data with operational data for each customer interaction Operational Customer metric for a given Feedback for a customer given customer interaction interaction Customer x1 Interaction 1 y1 Customer x2 Interaction 2 y2 Customer x3 Interaction 3 y3 Customer x4 Interaction 4 y4 Customer xn Interaction n yn xn represents the operational metric for customer interaction n. yn represents the customer feedback for customer interaction n. Copyright © 2011 Business Over Broadway · Bob E. Hayes, PhD · bob@businessoverbroadway.com · www.businessoverbroadway.com
  • 15.
    Results  Service requests(SRs) that required fewer calls to resolve the customer issue have higher customer satisfaction ratings compared to SRs requiring more calls to resolution  We can identify which operational metrics have the largest impact on customer satisfaction Customer Sat with SR Number of Calls to Resolve SR 1 call 2-3 calls 4-5 calls 6-7 calls 8 or more calls Copyright © 2011 Business Over Broadway · Bob E. Hayes, PhD · bob@businessoverbroadway.com · www.businessoverbroadway.com
  • 16.
    Results  Identify customer-centric metrics Total Time to Resolve SR Initial Response Time Customer Sat with SR < 1 day 2-7 days 8-14 days 15-30 > 30 days 1 day or 2 days 3 days 4-7 8-14 > 14 days less days days days Copyright © 2011 Business Over Broadway · Bob E. Hayes, PhD · bob@businessoverbroadway.com · www.businessoverbroadway.com
  • 17.
    Constituency Metrics  Linkageanalysis helps us understand how constituency variables impact customer satisfaction/loyalty Customer Employee Satisfaction/ Metrics  Satisfaction Metrics Loyalty  Employee satisfaction with Partner business areas Metrics  Partner satisfaction with partner relationship  Other Metrics  Loyalty Metrics  Employee training metrics  Employee/Partner loyalty  Partner certification status Copyright © 2011 Business Over Broadway · Bob E. Hayes, PhD · bob@businessoverbroadway.com · www.businessoverbroadway.com
  • 18.
    Employee / Customer:Data Model  Data model associates employee data with customer data for each employee1 Employee Customer Satisfaction Satisfaction with Company _ x1 Employee 1 y1 _ x2 Employee 2 y2 _ x3 Employee 3 y3 _ x4 Employee 4 y4 _ xn Employee n yn 1Analysis typically conducted for B2B customers where a given employee (sales representative, technical account manager, sales manager) is associated with a given customer (account) _n represents employee satisfaction score for Employee n. x yn represents average customer satisfaction scores across survey respondents for Employee n. Copyright © 2011 Business Over Broadway · Bob E. Hayes, PhD · bob@businessoverbroadway.com · www.businessoverbroadway.com
  • 19.
    Results  Employee groupswith higher levels of satisfaction with the company have customers who report higher levels of loyalty compared to employee groups with lower levels of satisfaction  We can identify which employee factors have the largest impact on customer satisfaction Employee Satisfaction Customer Loyalty Dissatisfied Satisfied Extremely Satisfied Copyright © 2011 Business Over Broadway · Bob E. Hayes, PhD · bob@businessoverbroadway.com · www.businessoverbroadway.com
  • 20.
    Results  Technical AccountManagers (TAM) who completed more training had customers who report higher levels of satisfaction with TAM performance  Validate usefulness of employee training Number of Completed Courses with TAM Performance Customer Satisfaction 1 Course 2-3 Courses 4-5 Courses More than 5 Courses Copyright © 2011 Business Over Broadway · Bob E. Hayes, PhD · bob@businessoverbroadway.com · www.businessoverbroadway.com
  • 21.
    Linkage Summary  Gainadditional insight about causes and consequences of customer satisfaction and loyalty  Quantifying the value of customer feedback program  Manage customer relationships with operational metrics (goal setting, incentive programs)  Understand entire business ecosystem and manage all key relationships (employee, partner) so they can deliver an exceptional customer experience Copyright © 2011 Business Over Broadway · Bob E. Hayes, PhD · bob@businessoverbroadway.com · www.businessoverbroadway.com
  • 22.
    For More Information Bob E. Hayes, Ph.D. Email: bob@businessoverbroadway.com Web: www.businessoverbroadway.com Blog: www.businessoverbroadway.com/blog Twitter: www.twitter.com/bobehayes Copyright © 2011 Business Over Broadway · Bob E. Hayes, PhD · bob@businessoverbroadway.com · www.businessoverbroadway.com

Editor's Notes

  • #4 Linkage analysis is the process of merging or linking different customer databases together and then analyzing the overall database to uncover important relationships.There are there general types of linkage analyses: The first is Financial – in which we can calculate the dollar value of improving customer loyalty. The second is Operational – in which we identify the operational metrics that are closely linked to customer satisfaction. The third is Constituency – in which we identify how employees and partners impact the quality of the customer relationship.
  • #5 Linkage analysis helps answer important questions that help senior management better manage its business. 1. What is the $ value of improving customer satisfaction/loyalty?2. Which operational metrics have the biggest impact on customer satisfaction/loyalty?3. Which employee/partner factors have the biggest impact on customer satisfaction/loyalty?The bottom line is that linkage analysis helps the company understand the causes and consequences of customer satisfaction and loyalty and thereby helping senior manager better manage its business.Understand the causes and consequences of customer satisfaction/loyalty
  • #10 Points to ConsiderRelationship SurveyEnsure respondents have, at least, some influence in purchasing decisionsDifferent Types of Linkages are Possible
  • #22 Using linkage research, companies can gain important insight about the various causes and consequences of customer satisfaction and loyalty.One, companies will be able to understand how to best manage the customer relationship with operational metrics. Two, they’ll be able to manage the relationships of other important constituencies like employees and partners so they can deliver exceptional customer experience to the customers they serve. Three, they will be able to quantify the value of the CEM program by quantifying the impact that the program has on financial metrics.