Download as PDF, PPTX
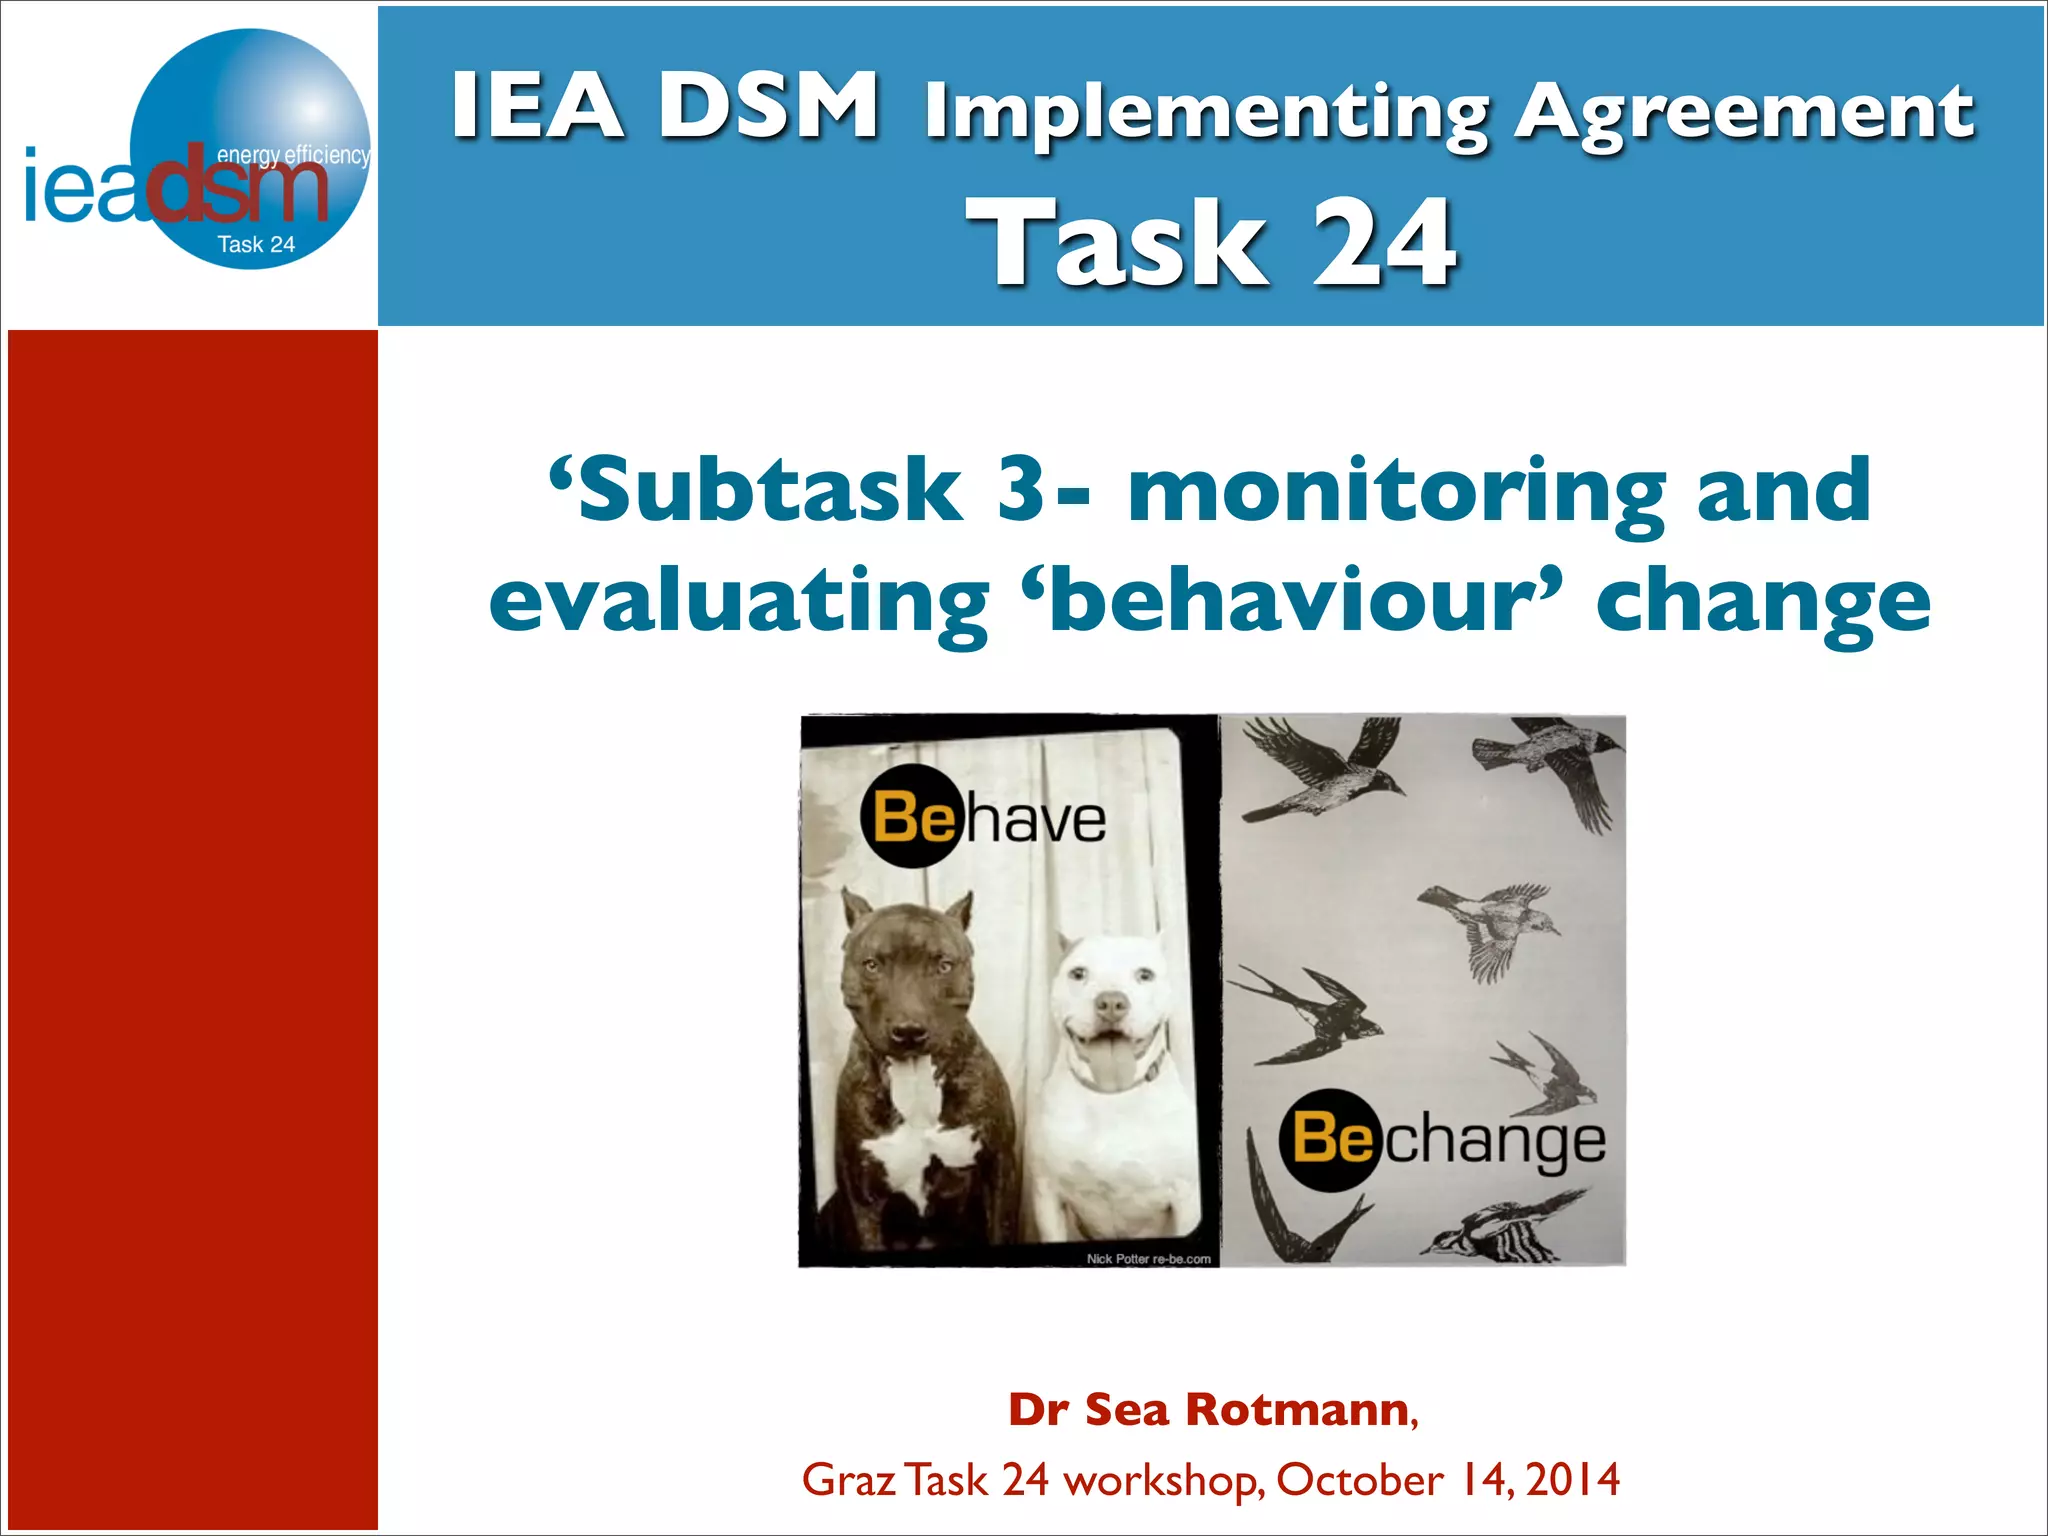


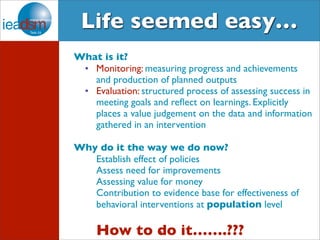


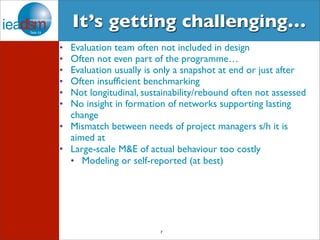

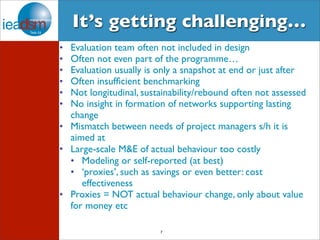
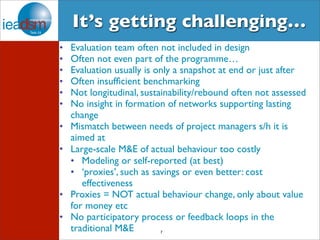


The document discusses the monitoring and evaluation of behavior change within the IEA DSM framework, focusing on areas like buildings, transport, and smart metering. It highlights the challenges of using traditional proxies like energy savings as indicators of behavior change, emphasizing the need for more nuanced metrics and longitudinal studies. Additionally, it critiques the disconnect between evaluation designs and actual behavioral outcomes, advocating for tailored and participatory approaches in measuring intervention effectiveness.


