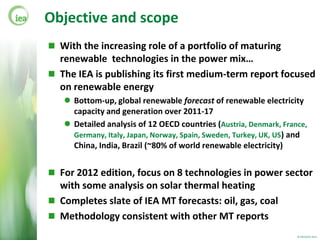
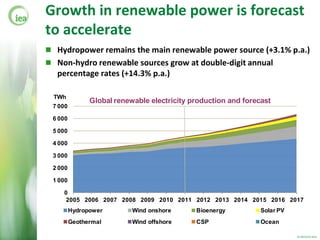
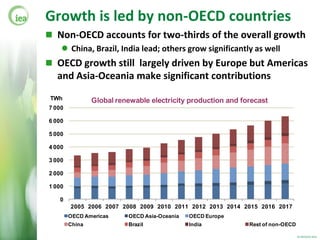
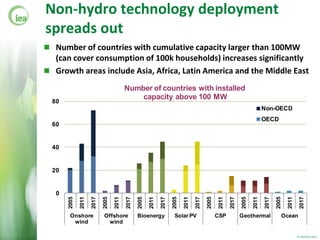
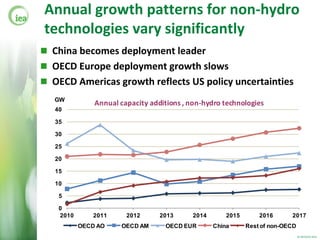
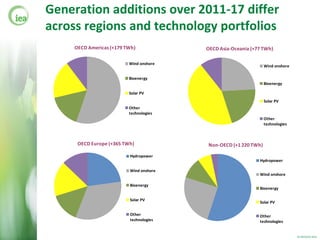
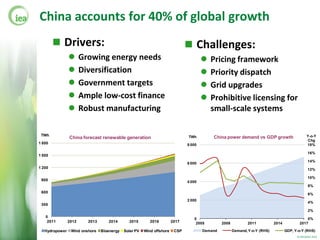
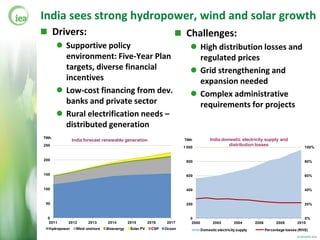
SlideShare a Scribd company logo
1 of 19
Download to read offline
Medium-Term Renewable Energy
                  Market Report 2012
                                           Michael Waldron
                     Senior Renewable Energy Market Analyst


© OECD/IEA 2012
Objective and scope
 With the increasing role of a portfolio of maturing
  renewable technologies in the power mix…
 The IEA is publishing its first medium-term report focused
  on renewable energy
    Bottom-up, global renewable forecast of renewable electricity
     capacity and generation over 2011-17
    Detailed analysis of 12 OECD countries (Austria, Denmark, France,
     Germany, Italy, Japan, Norway, Spain, Sweden, Turkey, UK, US) and
     China, India, Brazil (~80% of world renewable electricity)


 For 2012 edition, focus on 8 technologies in power sector
  with some analysis on solar thermal heating
 Completes slate of IEA MT forecasts: oil, gas, coal
 Methodology consistent with other MT reports
                                                                   © OECD/IEA 2012
Global Overview


                  © OECD/IEA 2012
Key trends
 As a portfolio of renewable technologies matures, global
  renewable power generation is forecast to rise 40%
    Supported by policy/market frameworks and economic
     attractiveness in increasing range of countries and circumstances
    Technology cost developments, grid/system integration,
     cost/availability of financing also weigh as key variables
    High level of economic/policy uncertainty in some countries


 This projected growth is an acceleration vs previous period
    Growth is 60% higher over 2011-17 versus 2005-11


 Renewable deployment is projected to spread out
  geographically, with increased activity in emerging markets
    Deployment spurring economies of scale in some technologies -
     virtuous cycle of improved competition and cost reductions
                                                                   © OECD/IEA 2012
Growth in renewable power is forecast
to accelerate
 Hydropower remains the main renewable power source (+3.1% p.a.)
 Non-hydro renewable sources grow at double-digit annual
   percentage rates (+14.3% p.a.)

  TWh
               Global renewable electricity production and forecast
 7 000

 6 000

 5 000

 4 000

 3 000

 2 000

 1 000

    0
     2005 2006 2007 2008 2009 2010 2011 2012 2013 2014 2015 2016 2017
         Hydropower        Wind onshore      Bioenergy          Solar PV
         Geothermal        Wind offshore     CSP                Ocean

                                                                           © OECD/IEA 2012
Growth is led by non-OECD countries
 Non-OECD accounts for two-thirds of the overall growth
     China, Brazil, India lead; others grow significantly as well
 OECD growth still largely driven by Europe but Americas
  and Asia-Oceania make significant contributions
 TWh            Global renewable electricity production and forecast
7 000

6 000

5 000

4 000

3 000

2 000

1 000

   0
        2005 2006 2007 2008 2009 2010 2011 2012 2013 2014 2015 2016 2017
        OECD Americas     OECD Asia-Oceania   OECD Europe
        China             Brazil              India           Rest of non-OECD

                                                                                 © OECD/IEA 2012
Non-hydro technology deployment
spreads out
 Number of countries with cumulative capacity larger than 100MW
  (can cover consumption of 100k households) increases significantly
 Growth areas include Asia, Africa, Latin America and the Middle East

                                          Number of countries with installed
                                              capacity above 100 MW
  80
                                                                                                                              Non-OECD
                                                                                                                              OECD
  60


  40


  20


   0
              2011


                            2005


                                          2017


                                                        2011

                                                               2017


                                                                             2011


                                                                                           2005


                                                                                                         2017


                                                                                                                       2011


                                                                                                                                     2005

                                                                                                                                            2011
       2005


                     2017


                                   2011


                                                 2005


                                                                      2005


                                                                                    2017


                                                                                                  2011


                                                                                                                2005


                                                                                                                              2017


                                                                                                                                                    2017
        Onshore              Offshore            Bioenergy             Solar PV                   CSP           Geothermal              Ocean
         wind                 wind

                                                                                                                                                   © OECD/IEA 2012
Annual growth patterns for non-hydro
technologies vary significantly
 China becomes deployment leader
 OECD Europe deployment growth slows
 OECD Americas growth reflects US policy uncertainties
   GW
               Annual capacity additions , non-hydro technologies
   40

   35

   30

   25

   20

   15

   10

    5

    0
    2010       2011     2012      2013      2014       2015       2016      2017
           OECD AO    OECD AM      OECD EUR        China      Rest of non-OECD
                                                                                 © OECD/IEA 2012
Generation additions over 2011-17 differ
across regions and technology portfolios
    OECD Americas (+179 TWh)            OECD Asia-Oceania (+77 TWh)

                         Wind onshore
                                                                Wind onshore

                         Bioenergy
                                                                Bioenergy

                         Solar PV
                                                                Solar PV
                         Other
                         technologies
                                                                Other
                                                                technologies


     OECD Europe (+365 TWh)             Non-OECD (+1 220 TWh)

                         Hydropower
                                                             Hydropower

                         Wind onshore
                                                             Wind onshore

                         Bioenergy
                                                             Bioenergy

                         Solar PV
                                                             Solar PV

                         Other                               Other
                         technologies                        technologies


                                                                               © OECD/IEA 2012
Investment in renewable electricity
 Annual investment topped USD 250 billion in 2011
    Most recent quarterly data suggest some slowing


 Economic and credit risks weigh on medium-term picture
    European bank project finance and utility finance more strained


 Other sources/structures of finance play increasing role
    Development banks
    New institutional and non-traditional corporate investors
    Smaller scale financial innovation for small distributed capacity


 Ultimately, cost and availability of financing to depend
  most on prevailing policy and technology environments


                                                                    © OECD/IEA 2012
Renewable technologies compete better in a
wider range of circumstances
 Renewable generation in general still more expensive
  than bulk power but…
      Hydropower and geothermal mostly competitive
      Onshore wind competes well in good resource areas
      Solar PV approaches peak gen. costs in places with summer peak
      Residential PV can be cheaper than average retail power prices

         USD/MWh      Levelised costs of power generation
                           Utility scale                    Small scale
          500

          400

          300

          200

          100

           0


                                                                          © OECD/IEA 2012
Country and Regional Outlooks


                                © OECD/IEA 2012
US renewable generation to grow steadily
 Average renewable growth of 2.4% annually over 2011-17
 Non-hydropower growth at stronger rate, + 8.4% annually
    Onshore wind, solar PV and bioenergy grow strongest
    CSP and geothermal growth are large in global terms
 % of total power gen: 9% (2005), 13% (2011), 14-15% (2017)

      TWh
                            United States renewable generation and forecast
      700

      600

      500

      400

      300

      200

      100

       0
        2005     2006    2007   2008     2009   2010    2011   2012   2013   2014   2015   2016   2017

            Hydropower    Wind onshore      Bioenergy     Solar PV    Geothermal    CSP    Wind offshore

                                                                                                           © OECD/IEA 2012
State mandates drive the US picture
 Main US deployment drivers: state RPSs, federal financial
   incentive levels, ample grid capacity, innovative financing


  Source: DSIRE (March 2012).                              © OECD/IEA 2012
But other challenges remain in the US
 Main US deployment challenges:
    Duration of federal incentives
          Wind production tax credit (PTC) expires at end-2012; but investment
           tax credit for solar goes through 2016
    Competition with natural gas
    Cost and availability of tax equity finance
    GW                           US wind capacity growth
    10
                                                                    Forecast based
                                                                    on expiration of
                                                                    PTC at end-2012
     8


     6
            Expiration of federal PTC
     4


     2


     0
         1998   2000    2002    2004    2006   2008   2010   2012     2014    2016
                                                                                       © OECD/IEA 2012
China accounts for 40% of global growth
         Drivers:                                                             Challenges:
                      Growing energy needs                                                Pricing framework
                      Diversification                                                     Priority dispatch
                      Government targets                                                  Grid upgrades
                      Ample low-cost finance                                              Prohibitive licensing for
                      Robust manufacturing                                                 small-scale systems

 TWh

1 800
         Challenges: generation
           China forecast renewable                                           TWh

                                                                              8 000
                                                                                             China power demand vs GDP growth                      Y-o-Y
                                                                                                                                                    Chg
                                                                                                                                                   18%

1 500
                      Pricing framework                                                                                                           16%


                
                                                                                                                                                   14%
1 200                  Priority dispatch                                      6 000
                                                                                                                                                   12%

 900                  Grid upgrades                                          4 000
                                                                                                                                                   10%

                                                                                                                                                    8%
 600                  Prohibitive licensing for                                                                                                    6%

 300
                       small-scale systems                                    2 000
                                                                                                                                                    4%

                                                                                                                                                    2%
   0
                                                                                 0                                                               0%
    2011        2012     2013      2014       2015        2016         2017       2005            2008           2011          2014          2017

   Hydropower    Wind onshore   Bioenergy   Solar PV   Wind offshore    CSP              Demand          Demand, Y-o-Y (RHS)          GDP, Y-o-Y (RHS)
                                                                               Source:                                                      © OECD/IEA 2012
India sees strong hydropower, wind and solar growth
 Drivers:                                                         Challenges:
       Supportive policy                                                 High distribution losses and
        environment: Five-Year Plan                                        regulated prices
        targets, diverse financial                                        Grid strengthening and
        incentives                                                         expansion needed
       Low-cost financing from dev.                                      Complex administrative
        banks and private sector                                           requirements for projects
       Rural electrification needs –
        distributed generation
TWh
               India forecast renewable generation                    TWh             India domestic electricity supply and
250
                                                                      1 000
                                                                                               distribution losses                          100%


200                                                                    800                                                                  80%


150                                                                    600                                                                  60%


100                                                                    400                                                                  40%


 50                                                                    200                                                                  20%


 0                                                                       0                                                                 0%
  2011     2012       2013     2014        2015        2016    2017       2000          2002        2004       2006         2008       2010
  Hydropower    Wind onshore   Bioenergy    Solar PV    CSP   Ocean              Domestic electricity supply          Percentage losses (RHS)
                                                                                                                                       © OECD/IEA 2012
Brazil’s hydropower and wind grow strongly
 Drivers:                                                          Challenges:
        Government sponsored power                                       Adequate margins for wind
         auctions                                                          projects (?)
        Cost reductions – wind recently                                  Environmental licensing
         outbid natural gas                                               Economic attractiveness of
        Pipeline of hydropower projects                                   solar PV (?)
        Low-cost financing from dev.
         banks and private sector

 TWh
              Brazil forecast renewable generation                            Brazil average auction price for new wind
 600                                                               160

 500                                                               140

                                                                   120
 400
                                                                   100
 300
                                                                    80

 200
                                                                    60

 100                                                                40
                                                                                     BRL per megawatt-hour
                                                                    20
  0                                                                                  USD per megawatt-hour
   2011       2012    2013     2014     2015       2016     2017
                                                                    0
        Hydropower    Wind onshore     Bioenergy      Solar PV            2009     2010    2010      2011     2011     2011
                                                                         Reserve   A-3    Reserve     A-3    Reserve   A-5
                                                                                                                          © OECD/IEA 2012
Thank You
    &
Questions


            © OECD/IEA 2012

More Related Content

Similar to Medium-Term Renewable Energy Market Report 2012

Global New Vehicle Fuel Economy Update - Alex Körner, François Cuenot - Inter...
Global New Vehicle Fuel Economy Update - Alex Körner, François Cuenot - Inter...Global New Vehicle Fuel Economy Update - Alex Körner, François Cuenot - Inter...
Global New Vehicle Fuel Economy Update - Alex Körner, François Cuenot - Inter...WRI Ross Center for Sustainable Cities
 
Town Hall with Congressman Patrick McHenry 2012
Town Hall with Congressman Patrick McHenry 2012Town Hall with Congressman Patrick McHenry 2012
Town Hall with Congressman Patrick McHenry 2012CongressmanPatrickMcHenry
 
MItigation Strategy Sample- Spanish Basque Country
MItigation Strategy Sample- Spanish Basque CountryMItigation Strategy Sample- Spanish Basque Country
MItigation Strategy Sample- Spanish Basque CountryAlejo Etchart Ortiz
 
The International Energy Agency’s Efficient World Scenario
The International Energy Agency’s Efficient World ScenarioThe International Energy Agency’s Efficient World Scenario
The International Energy Agency’s Efficient World ScenarioLeonardo ENERGY
 
The International Energy Agency’s Efficient World Scenario
The International Energy Agency’s Efficient World ScenarioThe International Energy Agency’s Efficient World Scenario
The International Energy Agency’s Efficient World ScenarioLeonardo ENERGY
 
Medium term renewable energy market report 2012 - launch presentation
Medium term renewable energy market report 2012 - launch presentationMedium term renewable energy market report 2012 - launch presentation
Medium term renewable energy market report 2012 - launch presentationInternational Energy Agency
 
EMEA Corporate Occupier Conditions : Industrial occupiers respond to economic...
EMEA Corporate Occupier Conditions : Industrial occupiers respond to economic...EMEA Corporate Occupier Conditions : Industrial occupiers respond to economic...
EMEA Corporate Occupier Conditions : Industrial occupiers respond to economic...JLL France
 
Jones Lang LaSalle EMEA Corporate Occupier Conditions Industrial December 2011
Jones Lang LaSalle EMEA Corporate Occupier Conditions Industrial December 2011Jones Lang LaSalle EMEA Corporate Occupier Conditions Industrial December 2011
Jones Lang LaSalle EMEA Corporate Occupier Conditions Industrial December 2011hoet
 
The role of electric vehicles in a clean energy future - IEA Executive Director
The role of electric vehicles in a clean energy future - IEA Executive DirectorThe role of electric vehicles in a clean energy future - IEA Executive Director
The role of electric vehicles in a clean energy future - IEA Executive DirectorInternational Energy Agency
 
Energy efficiency trends in the EU: Have we got off track?
Energy efficiency trends in the EU: Have we got off track?Energy efficiency trends in the EU: Have we got off track?
Energy efficiency trends in the EU: Have we got off track?Leonardo ENERGY
 
Energy efficiency trends in the EU: Have we got off track?
Energy efficiency trends in the EU: Have we got off track?Energy efficiency trends in the EU: Have we got off track?
Energy efficiency trends in the EU: Have we got off track?Diedert Debusscher
 
Global Energy Markets in Transition: Implications for the economy, environmen...
Global Energy Markets in Transition: Implications for the economy, environmen...Global Energy Markets in Transition: Implications for the economy, environmen...
Global Energy Markets in Transition: Implications for the economy, environmen...International Energy Agency
 
Mk presentation rome 14 nov 2012
Mk presentation rome 14 nov 2012Mk presentation rome 14 nov 2012
Mk presentation rome 14 nov 2012Elsevier Events
 
CCS Role in Global Emission Reductions Bo Diczalusy IEA
CCS Role in Global Emission Reductions Bo Diczalusy IEACCS Role in Global Emission Reductions Bo Diczalusy IEA
CCS Role in Global Emission Reductions Bo Diczalusy IEAGlobal CCS Institute
 

Similar to Medium-Term Renewable Energy Market Report 2012 (20)

Global New Vehicle Fuel Economy Update - Alex Körner, François Cuenot - Inter...
Global New Vehicle Fuel Economy Update - Alex Körner, François Cuenot - Inter...Global New Vehicle Fuel Economy Update - Alex Körner, François Cuenot - Inter...
Global New Vehicle Fuel Economy Update - Alex Körner, François Cuenot - Inter...
 
Town Hall with Congressman Patrick McHenry 2012
Town Hall with Congressman Patrick McHenry 2012Town Hall with Congressman Patrick McHenry 2012
Town Hall with Congressman Patrick McHenry 2012
 
Introduction to Energy Technology Roadmaps
Introduction to Energy Technology RoadmapsIntroduction to Energy Technology Roadmaps
Introduction to Energy Technology Roadmaps
 
MItigation Strategy Sample- Spanish Basque Country
MItigation Strategy Sample- Spanish Basque CountryMItigation Strategy Sample- Spanish Basque Country
MItigation Strategy Sample- Spanish Basque Country
 
Energy Efficiency 2018 - South African Webinar
Energy Efficiency 2018 - South African Webinar Energy Efficiency 2018 - South African Webinar
Energy Efficiency 2018 - South African Webinar
 
The International Energy Agency’s Efficient World Scenario
The International Energy Agency’s Efficient World ScenarioThe International Energy Agency’s Efficient World Scenario
The International Energy Agency’s Efficient World Scenario
 
The International Energy Agency’s Efficient World Scenario
The International Energy Agency’s Efficient World ScenarioThe International Energy Agency’s Efficient World Scenario
The International Energy Agency’s Efficient World Scenario
 
Medium term renewable energy market report 2012 - launch presentation
Medium term renewable energy market report 2012 - launch presentationMedium term renewable energy market report 2012 - launch presentation
Medium term renewable energy market report 2012 - launch presentation
 
EMEA Corporate Occupier Conditions : Industrial occupiers respond to economic...
EMEA Corporate Occupier Conditions : Industrial occupiers respond to economic...EMEA Corporate Occupier Conditions : Industrial occupiers respond to economic...
EMEA Corporate Occupier Conditions : Industrial occupiers respond to economic...
 
Jones Lang LaSalle EMEA Corporate Occupier Conditions Industrial December 2011
Jones Lang LaSalle EMEA Corporate Occupier Conditions Industrial December 2011Jones Lang LaSalle EMEA Corporate Occupier Conditions Industrial December 2011
Jones Lang LaSalle EMEA Corporate Occupier Conditions Industrial December 2011
 
SE4ALL 02 Global Tracking Framework
SE4ALL 02 Global Tracking FrameworkSE4ALL 02 Global Tracking Framework
SE4ALL 02 Global Tracking Framework
 
The role of electric vehicles in a clean energy future - IEA Executive Director
The role of electric vehicles in a clean energy future - IEA Executive DirectorThe role of electric vehicles in a clean energy future - IEA Executive Director
The role of electric vehicles in a clean energy future - IEA Executive Director
 
Energy efficiency trends in the EU: Have we got off track?
Energy efficiency trends in the EU: Have we got off track?Energy efficiency trends in the EU: Have we got off track?
Energy efficiency trends in the EU: Have we got off track?
 
Energy efficiency trends in the EU: Have we got off track?
Energy efficiency trends in the EU: Have we got off track?Energy efficiency trends in the EU: Have we got off track?
Energy efficiency trends in the EU: Have we got off track?
 
Renewable Energy Financing - An IEA Perspective
Renewable Energy Financing - An IEA PerspectiveRenewable Energy Financing - An IEA Perspective
Renewable Energy Financing - An IEA Perspective
 
Global Energy Markets in Transition: Implications for the economy, environmen...
Global Energy Markets in Transition: Implications for the economy, environmen...Global Energy Markets in Transition: Implications for the economy, environmen...
Global Energy Markets in Transition: Implications for the economy, environmen...
 
Mk presentation rome 14 nov 2012
Mk presentation rome 14 nov 2012Mk presentation rome 14 nov 2012
Mk presentation rome 14 nov 2012
 
Energy Efficiency 2017: Launch Presentation
Energy Efficiency 2017: Launch PresentationEnergy Efficiency 2017: Launch Presentation
Energy Efficiency 2017: Launch Presentation
 
Moving Beyond First Year Savings - Nelson
Moving Beyond First Year Savings - NelsonMoving Beyond First Year Savings - Nelson
Moving Beyond First Year Savings - Nelson
 
CCS Role in Global Emission Reductions Bo Diczalusy IEA
CCS Role in Global Emission Reductions Bo Diczalusy IEACCS Role in Global Emission Reductions Bo Diczalusy IEA
CCS Role in Global Emission Reductions Bo Diczalusy IEA
 

More from International Energy Agency

IEA Executive Director Presentation to G20 Energy Ministers Session
IEA Executive Director Presentation to G20 Energy Ministers SessionIEA Executive Director Presentation to G20 Energy Ministers Session
IEA Executive Director Presentation to G20 Energy Ministers SessionInternational Energy Agency
 
World Energy Investment Launch Presentation - 14th May 2019
World Energy Investment Launch Presentation - 14th May 2019World Energy Investment Launch Presentation - 14th May 2019
World Energy Investment Launch Presentation - 14th May 2019International Energy Agency
 
What role will nuclear power play in meeting energy security and climate goals?
What role will nuclear power play in meeting energy security and climate goals?What role will nuclear power play in meeting energy security and climate goals?
What role will nuclear power play in meeting energy security and climate goals?International Energy Agency
 
Webinar on the Outlook for Fuels, 23rd November 2018
Webinar on the Outlook for Fuels, 23rd November 2018Webinar on the Outlook for Fuels, 23rd November 2018
Webinar on the Outlook for Fuels, 23rd November 2018International Energy Agency
 
IEA Webinar: Energy Efficiency Market Report 2018 (Portuguese version)
IEA Webinar: Energy Efficiency Market Report 2018 (Portuguese version)IEA Webinar: Energy Efficiency Market Report 2018 (Portuguese version)
IEA Webinar: Energy Efficiency Market Report 2018 (Portuguese version)International Energy Agency
 
IEA Webinar: Energy Efficiency Market Report 2018 (Spanish version)
IEA Webinar: Energy Efficiency Market Report 2018 (Spanish version)IEA Webinar: Energy Efficiency Market Report 2018 (Spanish version)
IEA Webinar: Energy Efficiency Market Report 2018 (Spanish version)International Energy Agency
 
IEA Webinar: Energy Efficiency Market Report 2018
IEA Webinar: Energy Efficiency Market Report 2018IEA Webinar: Energy Efficiency Market Report 2018
IEA Webinar: Energy Efficiency Market Report 2018International Energy Agency
 
LNG: Driving global gas growth & improving flexibility
LNG: Driving global gas growth & improving flexibilityLNG: Driving global gas growth & improving flexibility
LNG: Driving global gas growth & improving flexibilityInternational Energy Agency
 
Global energy prospects and their implications for Indonesia
Global energy prospects and their implications for IndonesiaGlobal energy prospects and their implications for Indonesia
Global energy prospects and their implications for IndonesiaInternational Energy Agency
 
Natural gas and LNG in the Future of Global Energy
Natural gas and LNG in the Future of Global EnergyNatural gas and LNG in the Future of Global Energy
Natural gas and LNG in the Future of Global EnergyInternational Energy Agency
 

More from International Energy Agency (20)

IEA Executive Director Presentation to G20 Energy Ministers Session
IEA Executive Director Presentation to G20 Energy Ministers SessionIEA Executive Director Presentation to G20 Energy Ministers Session
IEA Executive Director Presentation to G20 Energy Ministers Session
 
World Energy Investment Launch Presentation - 14th May 2019
World Energy Investment Launch Presentation - 14th May 2019World Energy Investment Launch Presentation - 14th May 2019
World Energy Investment Launch Presentation - 14th May 2019
 
The LNG opportunity for Europe
The LNG opportunity for EuropeThe LNG opportunity for Europe
The LNG opportunity for Europe
 
What role will nuclear power play in meeting energy security and climate goals?
What role will nuclear power play in meeting energy security and climate goals?What role will nuclear power play in meeting energy security and climate goals?
What role will nuclear power play in meeting energy security and climate goals?
 
Webinar on Sustainable Development Scenario
Webinar on Sustainable Development ScenarioWebinar on Sustainable Development Scenario
Webinar on Sustainable Development Scenario
 
WEO-2018 Electricity Webinar
WEO-2018 Electricity WebinarWEO-2018 Electricity Webinar
WEO-2018 Electricity Webinar
 
Webinar on the Outlook for Fuels, 23rd November 2018
Webinar on the Outlook for Fuels, 23rd November 2018Webinar on the Outlook for Fuels, 23rd November 2018
Webinar on the Outlook for Fuels, 23rd November 2018
 
IEA Webinar: Energy Efficiency Market Report 2018 (Portuguese version)
IEA Webinar: Energy Efficiency Market Report 2018 (Portuguese version)IEA Webinar: Energy Efficiency Market Report 2018 (Portuguese version)
IEA Webinar: Energy Efficiency Market Report 2018 (Portuguese version)
 
IEA Webinar: Energy Efficiency Market Report 2018 (Spanish version)
IEA Webinar: Energy Efficiency Market Report 2018 (Spanish version)IEA Webinar: Energy Efficiency Market Report 2018 (Spanish version)
IEA Webinar: Energy Efficiency Market Report 2018 (Spanish version)
 
IEA Webinar: Energy Efficiency Market Report 2018
IEA Webinar: Energy Efficiency Market Report 2018IEA Webinar: Energy Efficiency Market Report 2018
IEA Webinar: Energy Efficiency Market Report 2018
 
Producer Economies Webinar
Producer Economies WebinarProducer Economies Webinar
Producer Economies Webinar
 
Hydrogen: Accelerating & Expanding Deployment
Hydrogen: Accelerating & Expanding Deployment Hydrogen: Accelerating & Expanding Deployment
Hydrogen: Accelerating & Expanding Deployment
 
LNG: Driving global gas growth & improving flexibility
LNG: Driving global gas growth & improving flexibilityLNG: Driving global gas growth & improving flexibility
LNG: Driving global gas growth & improving flexibility
 
Global energy prospects and their implications for Indonesia
Global energy prospects and their implications for IndonesiaGlobal energy prospects and their implications for Indonesia
Global energy prospects and their implications for Indonesia
 
Natural gas and LNG in the Future of Global Energy
Natural gas and LNG in the Future of Global EnergyNatural gas and LNG in the Future of Global Energy
Natural gas and LNG in the Future of Global Energy
 
Water and the Sustainable Development Scenario
Water and the Sustainable Development ScenarioWater and the Sustainable Development Scenario
Water and the Sustainable Development Scenario
 
Low carbon Transition in the Cement Industry
Low carbon Transition in the Cement IndustryLow carbon Transition in the Cement Industry
Low carbon Transition in the Cement Industry
 
Low carbon Transition in the Cement Industry
Low carbon Transition in the Cement IndustryLow carbon Transition in the Cement Industry
Low carbon Transition in the Cement Industry
 
Global energy markets: today & tomorrow
Global energy markets: today & tomorrowGlobal energy markets: today & tomorrow
Global energy markets: today & tomorrow
 
Oil 2018 - Launch Presentation
Oil 2018 - Launch PresentationOil 2018 - Launch Presentation
Oil 2018 - Launch Presentation
 

Recently uploaded

Unraveling Multimodality with Large Language Models.pdf
Unraveling Multimodality with Large Language Models.pdfUnraveling Multimodality with Large Language Models.pdf
Unraveling Multimodality with Large Language Models.pdfAlex Barbosa Coqueiro
 
Advanced Test Driven-Development @ php[tek] 2024
Advanced Test Driven-Development @ php[tek] 2024Advanced Test Driven-Development @ php[tek] 2024
Advanced Test Driven-Development @ php[tek] 2024Scott Keck-Warren
 
Dev Dives: Streamline document processing with UiPath Studio Web
Dev Dives: Streamline document processing with UiPath Studio WebDev Dives: Streamline document processing with UiPath Studio Web
Dev Dives: Streamline document processing with UiPath Studio WebUiPathCommunity
 
APIForce Zurich 5 April Automation LPDG
APIForce Zurich 5 April  Automation LPDGAPIForce Zurich 5 April  Automation LPDG
APIForce Zurich 5 April Automation LPDGMarianaLemus7
 
Are Multi-Cloud and Serverless Good or Bad?
Are Multi-Cloud and Serverless Good or Bad?Are Multi-Cloud and Serverless Good or Bad?
Are Multi-Cloud and Serverless Good or Bad?Mattias Andersson
 
Unleash Your Potential - Namagunga Girls Coding Club
Unleash Your Potential - Namagunga Girls Coding ClubUnleash Your Potential - Namagunga Girls Coding Club
Unleash Your Potential - Namagunga Girls Coding ClubKalema Edgar
 
My Hashitalk Indonesia April 2024 Presentation
My Hashitalk Indonesia April 2024 PresentationMy Hashitalk Indonesia April 2024 Presentation
My Hashitalk Indonesia April 2024 PresentationRidwan Fadjar
 
Kotlin Multiplatform & Compose Multiplatform - Starter kit for pragmatics
Kotlin Multiplatform & Compose Multiplatform - Starter kit for pragmaticsKotlin Multiplatform & Compose Multiplatform - Starter kit for pragmatics
Kotlin Multiplatform & Compose Multiplatform - Starter kit for pragmaticscarlostorres15106
 
Install Stable Diffusion in windows machine
Install Stable Diffusion in windows machineInstall Stable Diffusion in windows machine
Install Stable Diffusion in windows machinePadma Pradeep
 
My INSURER PTE LTD - Insurtech Innovation Award 2024
My INSURER PTE LTD - Insurtech Innovation Award 2024My INSURER PTE LTD - Insurtech Innovation Award 2024
My INSURER PTE LTD - Insurtech Innovation Award 2024The Digital Insurer
 
"LLMs for Python Engineers: Advanced Data Analysis and Semantic Kernel",Oleks...
"LLMs for Python Engineers: Advanced Data Analysis and Semantic Kernel",Oleks..."LLMs for Python Engineers: Advanced Data Analysis and Semantic Kernel",Oleks...
"LLMs for Python Engineers: Advanced Data Analysis and Semantic Kernel",Oleks...Fwdays
 
Pigging Solutions in Pet Food Manufacturing
Pigging Solutions in Pet Food ManufacturingPigging Solutions in Pet Food Manufacturing
Pigging Solutions in Pet Food ManufacturingPigging Solutions
 
AI as an Interface for Commercial Buildings
AI as an Interface for Commercial BuildingsAI as an Interface for Commercial Buildings
AI as an Interface for Commercial BuildingsMemoori
 
New from BookNet Canada for 2024: BNC BiblioShare - Tech Forum 2024
New from BookNet Canada for 2024: BNC BiblioShare - Tech Forum 2024New from BookNet Canada for 2024: BNC BiblioShare - Tech Forum 2024
New from BookNet Canada for 2024: BNC BiblioShare - Tech Forum 2024BookNet Canada
 
Pigging Solutions Piggable Sweeping Elbows
Pigging Solutions Piggable Sweeping ElbowsPigging Solutions Piggable Sweeping Elbows
Pigging Solutions Piggable Sweeping ElbowsPigging Solutions
 
Build your next Gen AI Breakthrough - April 2024
Build your next Gen AI Breakthrough - April 2024Build your next Gen AI Breakthrough - April 2024
Build your next Gen AI Breakthrough - April 2024Neo4j
 
"Federated learning: out of reach no matter how close",Oleksandr Lapshyn
"Federated learning: out of reach no matter how close",Oleksandr Lapshyn"Federated learning: out of reach no matter how close",Oleksandr Lapshyn
"Federated learning: out of reach no matter how close",Oleksandr LapshynFwdays
 
Scanning the Internet for External Cloud Exposures via SSL Certs
Scanning the Internet for External Cloud Exposures via SSL CertsScanning the Internet for External Cloud Exposures via SSL Certs
Scanning the Internet for External Cloud Exposures via SSL CertsRizwan Syed
 
Transcript: New from BookNet Canada for 2024: BNC BiblioShare - Tech Forum 2024
Transcript: New from BookNet Canada for 2024: BNC BiblioShare - Tech Forum 2024Transcript: New from BookNet Canada for 2024: BNC BiblioShare - Tech Forum 2024
Transcript: New from BookNet Canada for 2024: BNC BiblioShare - Tech Forum 2024BookNet Canada
 

Recently uploaded (20)

Unraveling Multimodality with Large Language Models.pdf
Unraveling Multimodality with Large Language Models.pdfUnraveling Multimodality with Large Language Models.pdf
Unraveling Multimodality with Large Language Models.pdf
 
Advanced Test Driven-Development @ php[tek] 2024
Advanced Test Driven-Development @ php[tek] 2024Advanced Test Driven-Development @ php[tek] 2024
Advanced Test Driven-Development @ php[tek] 2024
 
Dev Dives: Streamline document processing with UiPath Studio Web
Dev Dives: Streamline document processing with UiPath Studio WebDev Dives: Streamline document processing with UiPath Studio Web
Dev Dives: Streamline document processing with UiPath Studio Web
 
APIForce Zurich 5 April Automation LPDG
APIForce Zurich 5 April  Automation LPDGAPIForce Zurich 5 April  Automation LPDG
APIForce Zurich 5 April Automation LPDG
 
Are Multi-Cloud and Serverless Good or Bad?
Are Multi-Cloud and Serverless Good or Bad?Are Multi-Cloud and Serverless Good or Bad?
Are Multi-Cloud and Serverless Good or Bad?
 
Unleash Your Potential - Namagunga Girls Coding Club
Unleash Your Potential - Namagunga Girls Coding ClubUnleash Your Potential - Namagunga Girls Coding Club
Unleash Your Potential - Namagunga Girls Coding Club
 
My Hashitalk Indonesia April 2024 Presentation
My Hashitalk Indonesia April 2024 PresentationMy Hashitalk Indonesia April 2024 Presentation
My Hashitalk Indonesia April 2024 Presentation
 
Kotlin Multiplatform & Compose Multiplatform - Starter kit for pragmatics
Kotlin Multiplatform & Compose Multiplatform - Starter kit for pragmaticsKotlin Multiplatform & Compose Multiplatform - Starter kit for pragmatics
Kotlin Multiplatform & Compose Multiplatform - Starter kit for pragmatics
 
Install Stable Diffusion in windows machine
Install Stable Diffusion in windows machineInstall Stable Diffusion in windows machine
Install Stable Diffusion in windows machine
 
My INSURER PTE LTD - Insurtech Innovation Award 2024
My INSURER PTE LTD - Insurtech Innovation Award 2024My INSURER PTE LTD - Insurtech Innovation Award 2024
My INSURER PTE LTD - Insurtech Innovation Award 2024
 
"LLMs for Python Engineers: Advanced Data Analysis and Semantic Kernel",Oleks...
"LLMs for Python Engineers: Advanced Data Analysis and Semantic Kernel",Oleks..."LLMs for Python Engineers: Advanced Data Analysis and Semantic Kernel",Oleks...
"LLMs for Python Engineers: Advanced Data Analysis and Semantic Kernel",Oleks...
 
Pigging Solutions in Pet Food Manufacturing
Pigging Solutions in Pet Food ManufacturingPigging Solutions in Pet Food Manufacturing
Pigging Solutions in Pet Food Manufacturing
 
AI as an Interface for Commercial Buildings
AI as an Interface for Commercial BuildingsAI as an Interface for Commercial Buildings
AI as an Interface for Commercial Buildings
 
New from BookNet Canada for 2024: BNC BiblioShare - Tech Forum 2024
New from BookNet Canada for 2024: BNC BiblioShare - Tech Forum 2024New from BookNet Canada for 2024: BNC BiblioShare - Tech Forum 2024
New from BookNet Canada for 2024: BNC BiblioShare - Tech Forum 2024
 
Pigging Solutions Piggable Sweeping Elbows
Pigging Solutions Piggable Sweeping ElbowsPigging Solutions Piggable Sweeping Elbows
Pigging Solutions Piggable Sweeping Elbows
 
Build your next Gen AI Breakthrough - April 2024
Build your next Gen AI Breakthrough - April 2024Build your next Gen AI Breakthrough - April 2024
Build your next Gen AI Breakthrough - April 2024
 
Hot Sexy call girls in Panjabi Bagh 🔝 9953056974 🔝 Delhi escort Service
Hot Sexy call girls in Panjabi Bagh 🔝 9953056974 🔝 Delhi escort ServiceHot Sexy call girls in Panjabi Bagh 🔝 9953056974 🔝 Delhi escort Service
Hot Sexy call girls in Panjabi Bagh 🔝 9953056974 🔝 Delhi escort Service
 
"Federated learning: out of reach no matter how close",Oleksandr Lapshyn
"Federated learning: out of reach no matter how close",Oleksandr Lapshyn"Federated learning: out of reach no matter how close",Oleksandr Lapshyn
"Federated learning: out of reach no matter how close",Oleksandr Lapshyn
 
Scanning the Internet for External Cloud Exposures via SSL Certs
Scanning the Internet for External Cloud Exposures via SSL CertsScanning the Internet for External Cloud Exposures via SSL Certs
Scanning the Internet for External Cloud Exposures via SSL Certs
 
Transcript: New from BookNet Canada for 2024: BNC BiblioShare - Tech Forum 2024
Transcript: New from BookNet Canada for 2024: BNC BiblioShare - Tech Forum 2024Transcript: New from BookNet Canada for 2024: BNC BiblioShare - Tech Forum 2024
Transcript: New from BookNet Canada for 2024: BNC BiblioShare - Tech Forum 2024
 

Medium-Term Renewable Energy Market Report 2012

  • 1. Medium-Term Renewable Energy Market Report 2012 Michael Waldron Senior Renewable Energy Market Analyst © OECD/IEA 2012
  • 2. Objective and scope  With the increasing role of a portfolio of maturing renewable technologies in the power mix…  The IEA is publishing its first medium-term report focused on renewable energy  Bottom-up, global renewable forecast of renewable electricity capacity and generation over 2011-17  Detailed analysis of 12 OECD countries (Austria, Denmark, France, Germany, Italy, Japan, Norway, Spain, Sweden, Turkey, UK, US) and China, India, Brazil (~80% of world renewable electricity)  For 2012 edition, focus on 8 technologies in power sector with some analysis on solar thermal heating  Completes slate of IEA MT forecasts: oil, gas, coal  Methodology consistent with other MT reports © OECD/IEA 2012
  • 3. Global Overview © OECD/IEA 2012
  • 4. Key trends  As a portfolio of renewable technologies matures, global renewable power generation is forecast to rise 40%  Supported by policy/market frameworks and economic attractiveness in increasing range of countries and circumstances  Technology cost developments, grid/system integration, cost/availability of financing also weigh as key variables  High level of economic/policy uncertainty in some countries  This projected growth is an acceleration vs previous period  Growth is 60% higher over 2011-17 versus 2005-11  Renewable deployment is projected to spread out geographically, with increased activity in emerging markets  Deployment spurring economies of scale in some technologies - virtuous cycle of improved competition and cost reductions © OECD/IEA 2012
  • 5. Growth in renewable power is forecast to accelerate  Hydropower remains the main renewable power source (+3.1% p.a.)  Non-hydro renewable sources grow at double-digit annual percentage rates (+14.3% p.a.) TWh Global renewable electricity production and forecast 7 000 6 000 5 000 4 000 3 000 2 000 1 000 0 2005 2006 2007 2008 2009 2010 2011 2012 2013 2014 2015 2016 2017 Hydropower Wind onshore Bioenergy Solar PV Geothermal Wind offshore CSP Ocean © OECD/IEA 2012
  • 6. Growth is led by non-OECD countries  Non-OECD accounts for two-thirds of the overall growth  China, Brazil, India lead; others grow significantly as well  OECD growth still largely driven by Europe but Americas and Asia-Oceania make significant contributions TWh Global renewable electricity production and forecast 7 000 6 000 5 000 4 000 3 000 2 000 1 000 0 2005 2006 2007 2008 2009 2010 2011 2012 2013 2014 2015 2016 2017 OECD Americas OECD Asia-Oceania OECD Europe China Brazil India Rest of non-OECD © OECD/IEA 2012
  • 7. Non-hydro technology deployment spreads out  Number of countries with cumulative capacity larger than 100MW (can cover consumption of 100k households) increases significantly  Growth areas include Asia, Africa, Latin America and the Middle East Number of countries with installed capacity above 100 MW 80 Non-OECD OECD 60 40 20 0 2011 2005 2017 2011 2017 2011 2005 2017 2011 2005 2011 2005 2017 2011 2005 2005 2017 2011 2005 2017 2017 Onshore Offshore Bioenergy Solar PV CSP Geothermal Ocean wind wind © OECD/IEA 2012
  • 8. Annual growth patterns for non-hydro technologies vary significantly  China becomes deployment leader  OECD Europe deployment growth slows  OECD Americas growth reflects US policy uncertainties GW Annual capacity additions , non-hydro technologies 40 35 30 25 20 15 10 5 0 2010 2011 2012 2013 2014 2015 2016 2017 OECD AO OECD AM OECD EUR China Rest of non-OECD © OECD/IEA 2012
  • 9. Generation additions over 2011-17 differ across regions and technology portfolios OECD Americas (+179 TWh) OECD Asia-Oceania (+77 TWh) Wind onshore Wind onshore Bioenergy Bioenergy Solar PV Solar PV Other technologies Other technologies OECD Europe (+365 TWh) Non-OECD (+1 220 TWh) Hydropower Hydropower Wind onshore Wind onshore Bioenergy Bioenergy Solar PV Solar PV Other Other technologies technologies © OECD/IEA 2012
  • 10. Investment in renewable electricity  Annual investment topped USD 250 billion in 2011  Most recent quarterly data suggest some slowing  Economic and credit risks weigh on medium-term picture  European bank project finance and utility finance more strained  Other sources/structures of finance play increasing role  Development banks  New institutional and non-traditional corporate investors  Smaller scale financial innovation for small distributed capacity  Ultimately, cost and availability of financing to depend most on prevailing policy and technology environments © OECD/IEA 2012
  • 11. Renewable technologies compete better in a wider range of circumstances  Renewable generation in general still more expensive than bulk power but…  Hydropower and geothermal mostly competitive  Onshore wind competes well in good resource areas  Solar PV approaches peak gen. costs in places with summer peak  Residential PV can be cheaper than average retail power prices USD/MWh Levelised costs of power generation Utility scale Small scale 500 400 300 200 100 0 © OECD/IEA 2012
  • 12. Country and Regional Outlooks © OECD/IEA 2012
  • 13. US renewable generation to grow steadily  Average renewable growth of 2.4% annually over 2011-17  Non-hydropower growth at stronger rate, + 8.4% annually  Onshore wind, solar PV and bioenergy grow strongest  CSP and geothermal growth are large in global terms  % of total power gen: 9% (2005), 13% (2011), 14-15% (2017) TWh United States renewable generation and forecast 700 600 500 400 300 200 100 0 2005 2006 2007 2008 2009 2010 2011 2012 2013 2014 2015 2016 2017 Hydropower Wind onshore Bioenergy Solar PV Geothermal CSP Wind offshore © OECD/IEA 2012
  • 14. State mandates drive the US picture  Main US deployment drivers: state RPSs, federal financial incentive levels, ample grid capacity, innovative financing Source: DSIRE (March 2012). © OECD/IEA 2012
  • 15. But other challenges remain in the US  Main US deployment challenges:  Duration of federal incentives  Wind production tax credit (PTC) expires at end-2012; but investment tax credit for solar goes through 2016  Competition with natural gas  Cost and availability of tax equity finance GW US wind capacity growth 10 Forecast based on expiration of PTC at end-2012 8 6 Expiration of federal PTC 4 2 0 1998 2000 2002 2004 2006 2008 2010 2012 2014 2016 © OECD/IEA 2012
  • 16. China accounts for 40% of global growth  Drivers:  Challenges:  Growing energy needs  Pricing framework  Diversification  Priority dispatch  Government targets  Grid upgrades  Ample low-cost finance  Prohibitive licensing for  Robust manufacturing small-scale systems TWh 1 800  Challenges: generation China forecast renewable TWh 8 000 China power demand vs GDP growth Y-o-Y Chg 18% 1 500  Pricing framework 16%  14% 1 200 Priority dispatch 6 000 12% 900  Grid upgrades 4 000 10% 8% 600  Prohibitive licensing for 6% 300 small-scale systems 2 000 4% 2% 0 0 0% 2011 2012 2013 2014 2015 2016 2017 2005 2008 2011 2014 2017 Hydropower Wind onshore Bioenergy Solar PV Wind offshore CSP Demand Demand, Y-o-Y (RHS) GDP, Y-o-Y (RHS) Source: © OECD/IEA 2012
  • 17. India sees strong hydropower, wind and solar growth  Drivers:  Challenges:  Supportive policy  High distribution losses and environment: Five-Year Plan regulated prices targets, diverse financial  Grid strengthening and incentives expansion needed  Low-cost financing from dev.  Complex administrative banks and private sector requirements for projects  Rural electrification needs – distributed generation TWh India forecast renewable generation TWh India domestic electricity supply and 250 1 000 distribution losses 100% 200 800 80% 150 600 60% 100 400 40% 50 200 20% 0 0 0% 2011 2012 2013 2014 2015 2016 2017 2000 2002 2004 2006 2008 2010 Hydropower Wind onshore Bioenergy Solar PV CSP Ocean Domestic electricity supply Percentage losses (RHS) © OECD/IEA 2012
  • 18. Brazil’s hydropower and wind grow strongly  Drivers:  Challenges:  Government sponsored power  Adequate margins for wind auctions projects (?)  Cost reductions – wind recently  Environmental licensing outbid natural gas  Economic attractiveness of  Pipeline of hydropower projects solar PV (?)  Low-cost financing from dev. banks and private sector TWh Brazil forecast renewable generation Brazil average auction price for new wind 600 160 500 140 120 400 100 300 80 200 60 100 40 BRL per megawatt-hour 20 0 USD per megawatt-hour 2011 2012 2013 2014 2015 2016 2017 0 Hydropower Wind onshore Bioenergy Solar PV 2009 2010 2010 2011 2011 2011 Reserve A-3 Reserve A-3 Reserve A-5 © OECD/IEA 2012
  • 19. Thank You & Questions © OECD/IEA 2012