Download to read offline

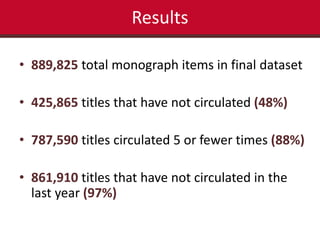
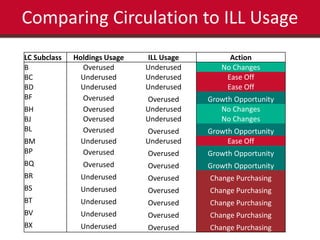

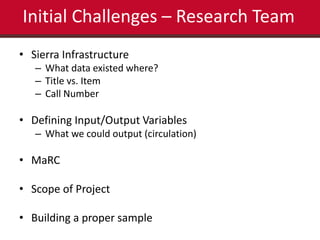
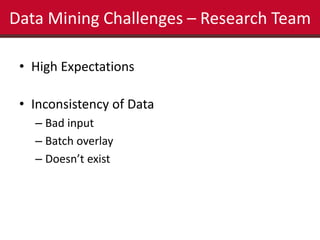


This document summarizes the results of a study analyzing circulation data and interlibrary loan (ILL) usage to evaluate the scope and coverage of a library's print collection. Some key findings include that 48% of titles have never circulated, 88% circulated 5 times or fewer, and 97% have not circulated in the last year. Subject areas with high ILL usage but low circulation may need increased purchasing. Challenges included inconsistencies in the library system data and scaling expectations about what data could be extracted and analyzed. The study aimed to identify areas of the collection that are over- or under-used to inform collection development and management decisions.


