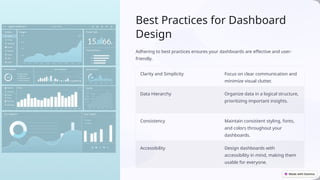
Creating Interactive
Dashboards and
Reports in Tableau
Tableau is a powerful data visualization tool that empowers you to
create compelling and interactive dashboards and reports.
Introduction to Tableau
Tableau is a user-friendly software that allows you to connect to various data
sources, transform data, and create visually appealing and insightful
dashboards.
1 Drag-and-Drop Interface
Tableau's intuitive drag-and-
drop interface makes creating
visualizations easy, even for
beginners.
2 Data Exploration
Explore your data interactively,
uncover hidden patterns, and
gain valuable insights.
3 Customization Options
Customize the look and feel of
your dashboards to align with
your brand and preferences.
4 Collaborative Features
Share your dashboards with
others and collaborate on data
analysis.
Data Preparation and Handling
Before creating visualizations, it's crucial to prepare and handle your data
effectively.
1 Connecting to Data Sources
Connect to a variety of data sources, including databases,
spreadsheets, and cloud platforms.
2 Data Cleaning and Transformation
Cleanse your data by removing duplicates, handling missing
values, and transforming data types.
3 Data Aggregation and Summarization
Aggregate and summarize your data to derive meaningful
insights and patterns.
Designing Effective Visualizations
Visualizations are the heart of your dashboards. They should effectively communicate insights and engage your audience.
Choosing the Right Chart
Type
Select chart types appropriate for
your data and the insights you want
to convey.
Color and Style
Use color palettes strategically and
ensure consistent styling for a
cohesive look.
Accessibility
Design visualizations with
accessibility in mind, ensuring they
are understandable for everyone.
Building Interactive Dashboards
Interactive dashboards allow users to explore data and uncover insights on their
own.
Dashboard Layout
Organize visualizations in a logical and visually appealing layout.
Filters and Controls
Add filters and controls to allow users to refine their analysis.
Storytelling
Guide users through your data using clear and concise narratives.
Enhancing Dashboards with
Actions and Interactions
Actions and interactions make your dashboards more dynamic and engaging.
Hover Effects
Provide additional information on
hover over visualizations.
Tooltips
Display detailed data points when
hovering over specific data
elements.
Drill-Down Capabilities
Allow users to explore data at
deeper levels with drill-down
features.
Parameter Controls
Use parameters to control how
your visualizations behave and
adjust data filtering.
Sharing and Collaborating with Tableau
Share your dashboards with others and collaborate on data analysis.
Sharing Options
Share dashboards online, embed them
in websites, or export them in various
formats.
Collaboration Tools
Use Tableau's collaboration features to
share feedback, edit dashboards, and
work together.
Data Governance
Manage data access and permissions
to ensure data security and integrity.
Best Practices for Dashboard
Design
Adhering to best practices ensures your dashboards are effective and user-
friendly.
Clarity and Simplicity Focus on clear communication and
minimize visual clutter.
Data Hierarchy Organize data in a logical structure,
prioritizing important insights.
Consistency Maintain consistent styling, fonts,
and colors throughout your
dashboards.
Accessibility Design dashboards with
accessibility in mind, making them
usable for everyone.
Conclusion and Q&A
By mastering Tableau, you can create powerful and interactive
dashboards that drive data-driven decisions.

Creating-Interactive-Dashboards-and-Reports-in-Tableau.pptx

  • 1.
    Creating Interactive Dashboards and Reportsin Tableau Tableau is a powerful data visualization tool that empowers you to create compelling and interactive dashboards and reports.
  • 2.
    Introduction to Tableau Tableauis a user-friendly software that allows you to connect to various data sources, transform data, and create visually appealing and insightful dashboards. 1 Drag-and-Drop Interface Tableau's intuitive drag-and- drop interface makes creating visualizations easy, even for beginners. 2 Data Exploration Explore your data interactively, uncover hidden patterns, and gain valuable insights. 3 Customization Options Customize the look and feel of your dashboards to align with your brand and preferences. 4 Collaborative Features Share your dashboards with others and collaborate on data analysis.
  • 3.
    Data Preparation andHandling Before creating visualizations, it's crucial to prepare and handle your data effectively. 1 Connecting to Data Sources Connect to a variety of data sources, including databases, spreadsheets, and cloud platforms. 2 Data Cleaning and Transformation Cleanse your data by removing duplicates, handling missing values, and transforming data types. 3 Data Aggregation and Summarization Aggregate and summarize your data to derive meaningful insights and patterns.
  • 4.
    Designing Effective Visualizations Visualizationsare the heart of your dashboards. They should effectively communicate insights and engage your audience. Choosing the Right Chart Type Select chart types appropriate for your data and the insights you want to convey. Color and Style Use color palettes strategically and ensure consistent styling for a cohesive look. Accessibility Design visualizations with accessibility in mind, ensuring they are understandable for everyone.
  • 5.
    Building Interactive Dashboards Interactivedashboards allow users to explore data and uncover insights on their own. Dashboard Layout Organize visualizations in a logical and visually appealing layout. Filters and Controls Add filters and controls to allow users to refine their analysis. Storytelling Guide users through your data using clear and concise narratives.
  • 6.
    Enhancing Dashboards with Actionsand Interactions Actions and interactions make your dashboards more dynamic and engaging. Hover Effects Provide additional information on hover over visualizations. Tooltips Display detailed data points when hovering over specific data elements. Drill-Down Capabilities Allow users to explore data at deeper levels with drill-down features. Parameter Controls Use parameters to control how your visualizations behave and adjust data filtering.
  • 7.
    Sharing and Collaboratingwith Tableau Share your dashboards with others and collaborate on data analysis. Sharing Options Share dashboards online, embed them in websites, or export them in various formats. Collaboration Tools Use Tableau's collaboration features to share feedback, edit dashboards, and work together. Data Governance Manage data access and permissions to ensure data security and integrity.
  • 8.
    Best Practices forDashboard Design Adhering to best practices ensures your dashboards are effective and user- friendly. Clarity and Simplicity Focus on clear communication and minimize visual clutter. Data Hierarchy Organize data in a logical structure, prioritizing important insights. Consistency Maintain consistent styling, fonts, and colors throughout your dashboards. Accessibility Design dashboards with accessibility in mind, making them usable for everyone.
  • 9.
    Conclusion and Q&A Bymastering Tableau, you can create powerful and interactive dashboards that drive data-driven decisions.