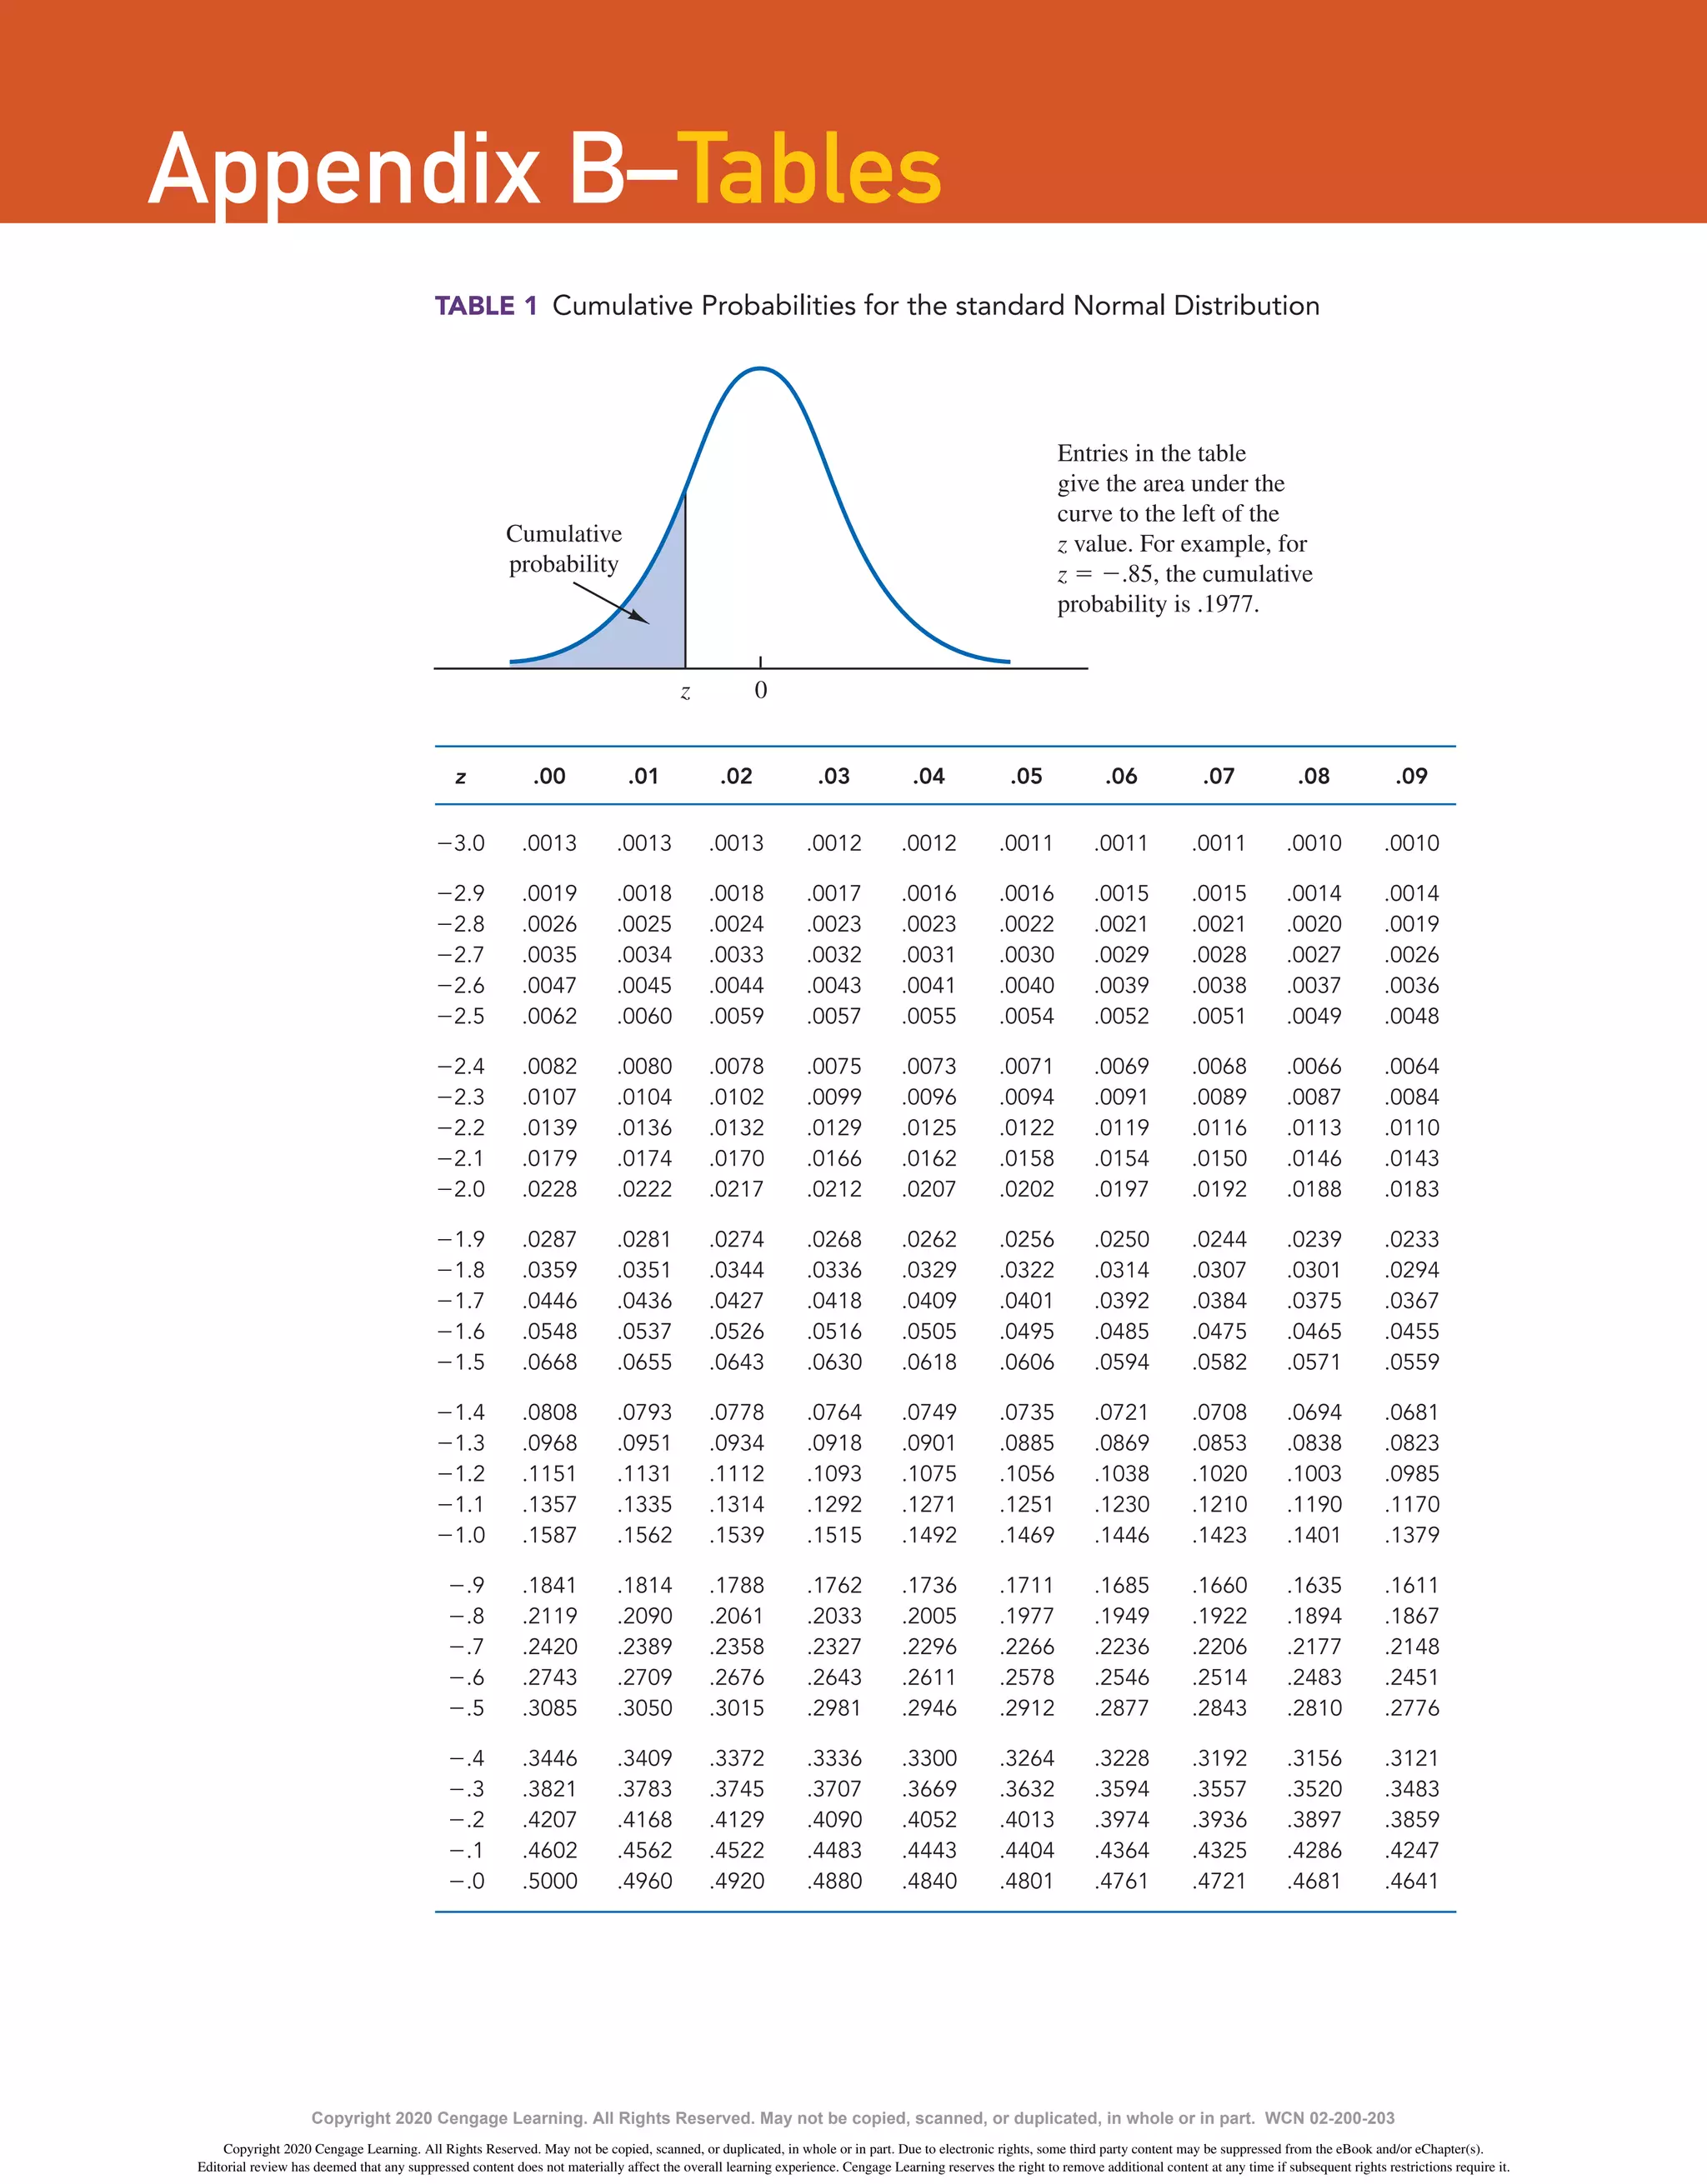
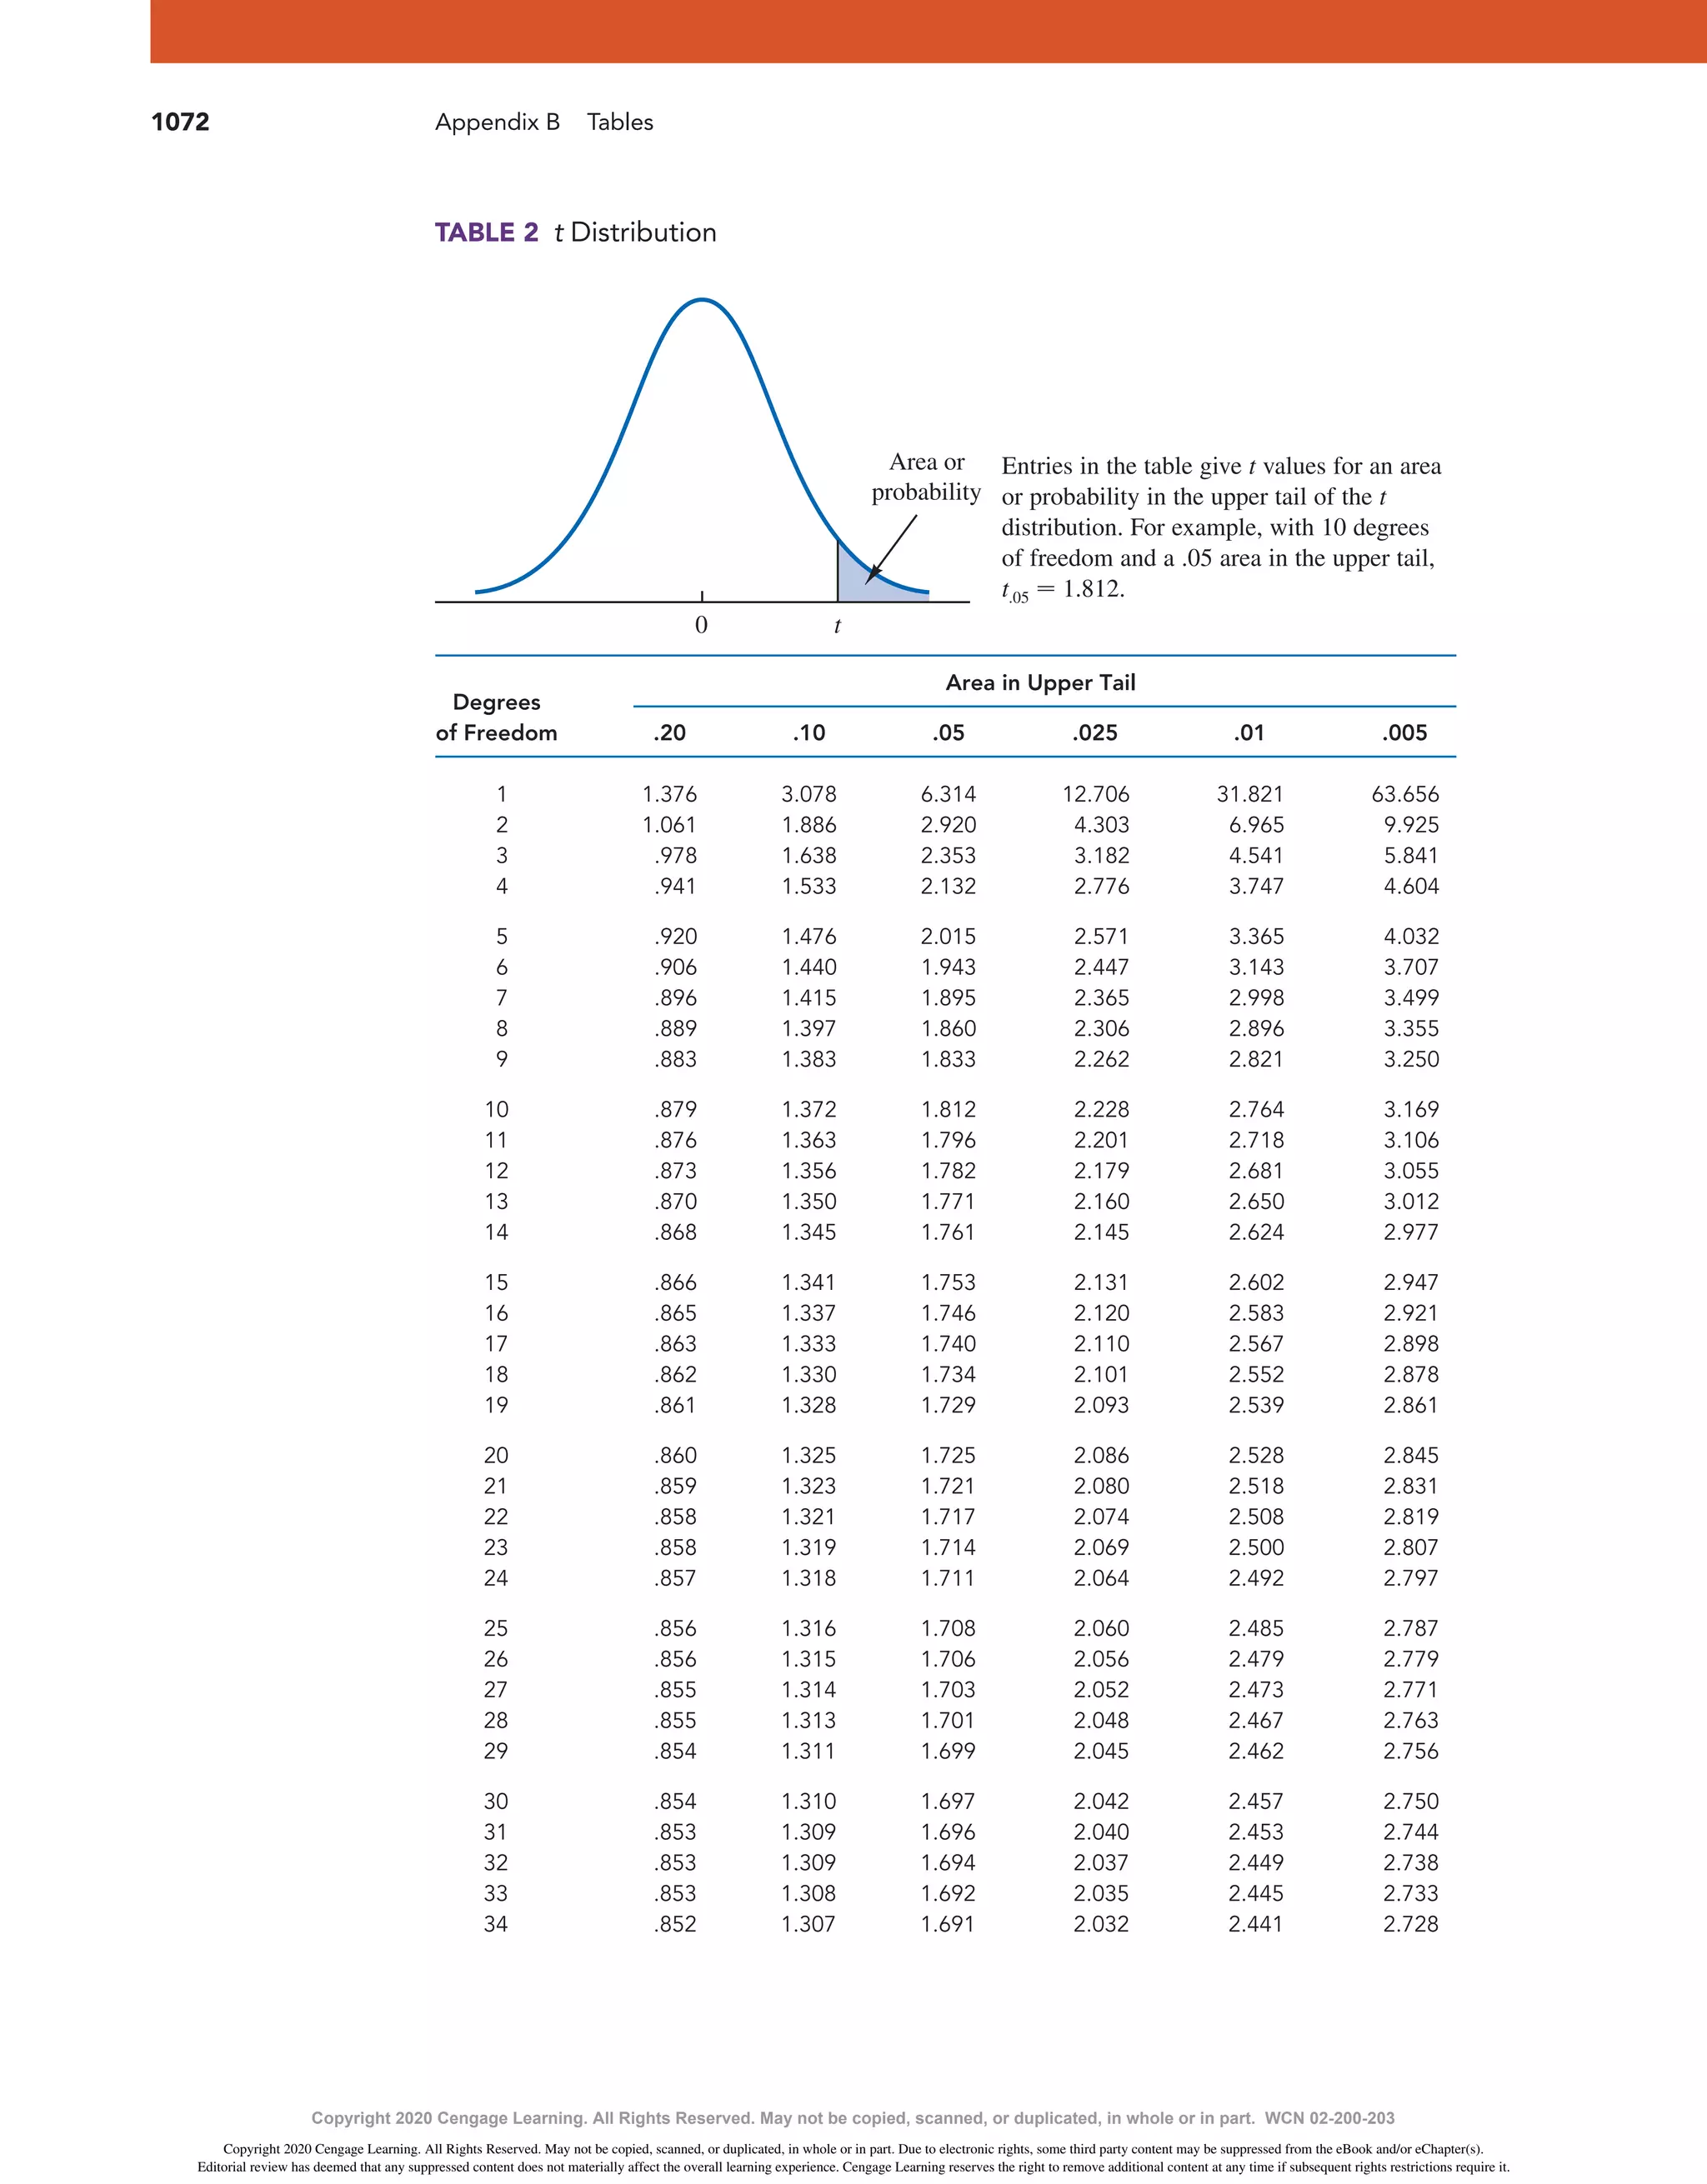
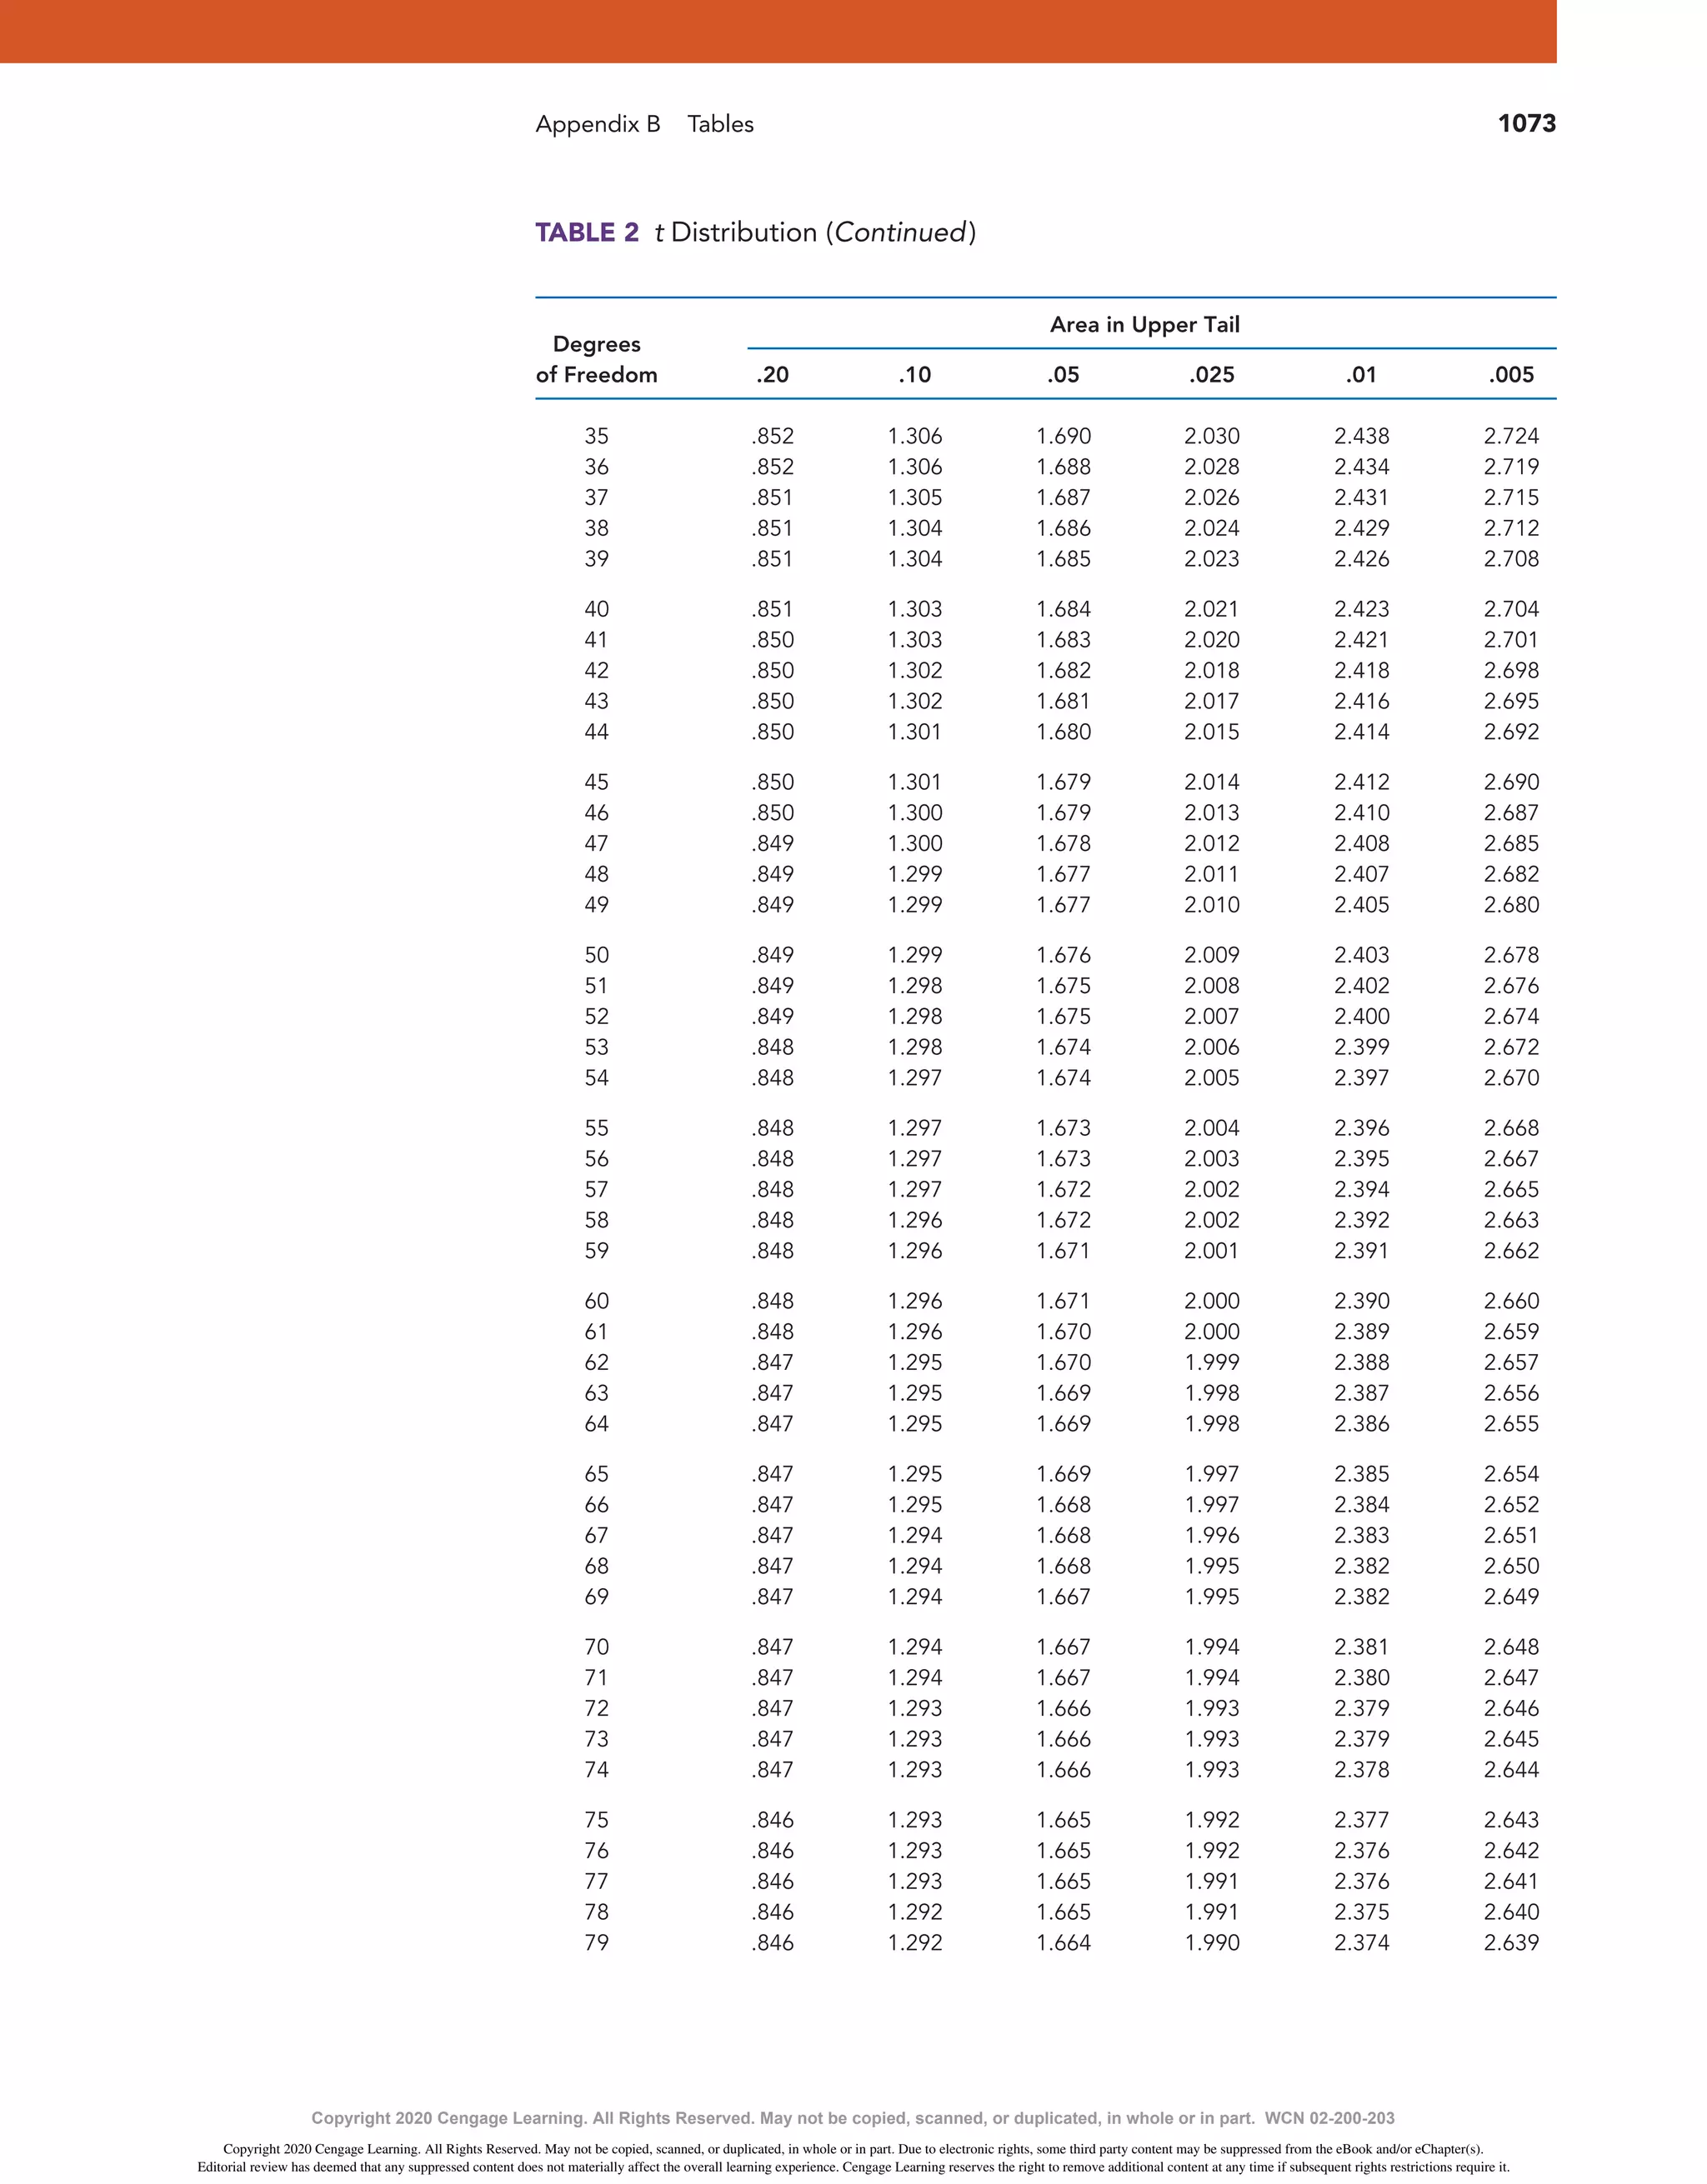
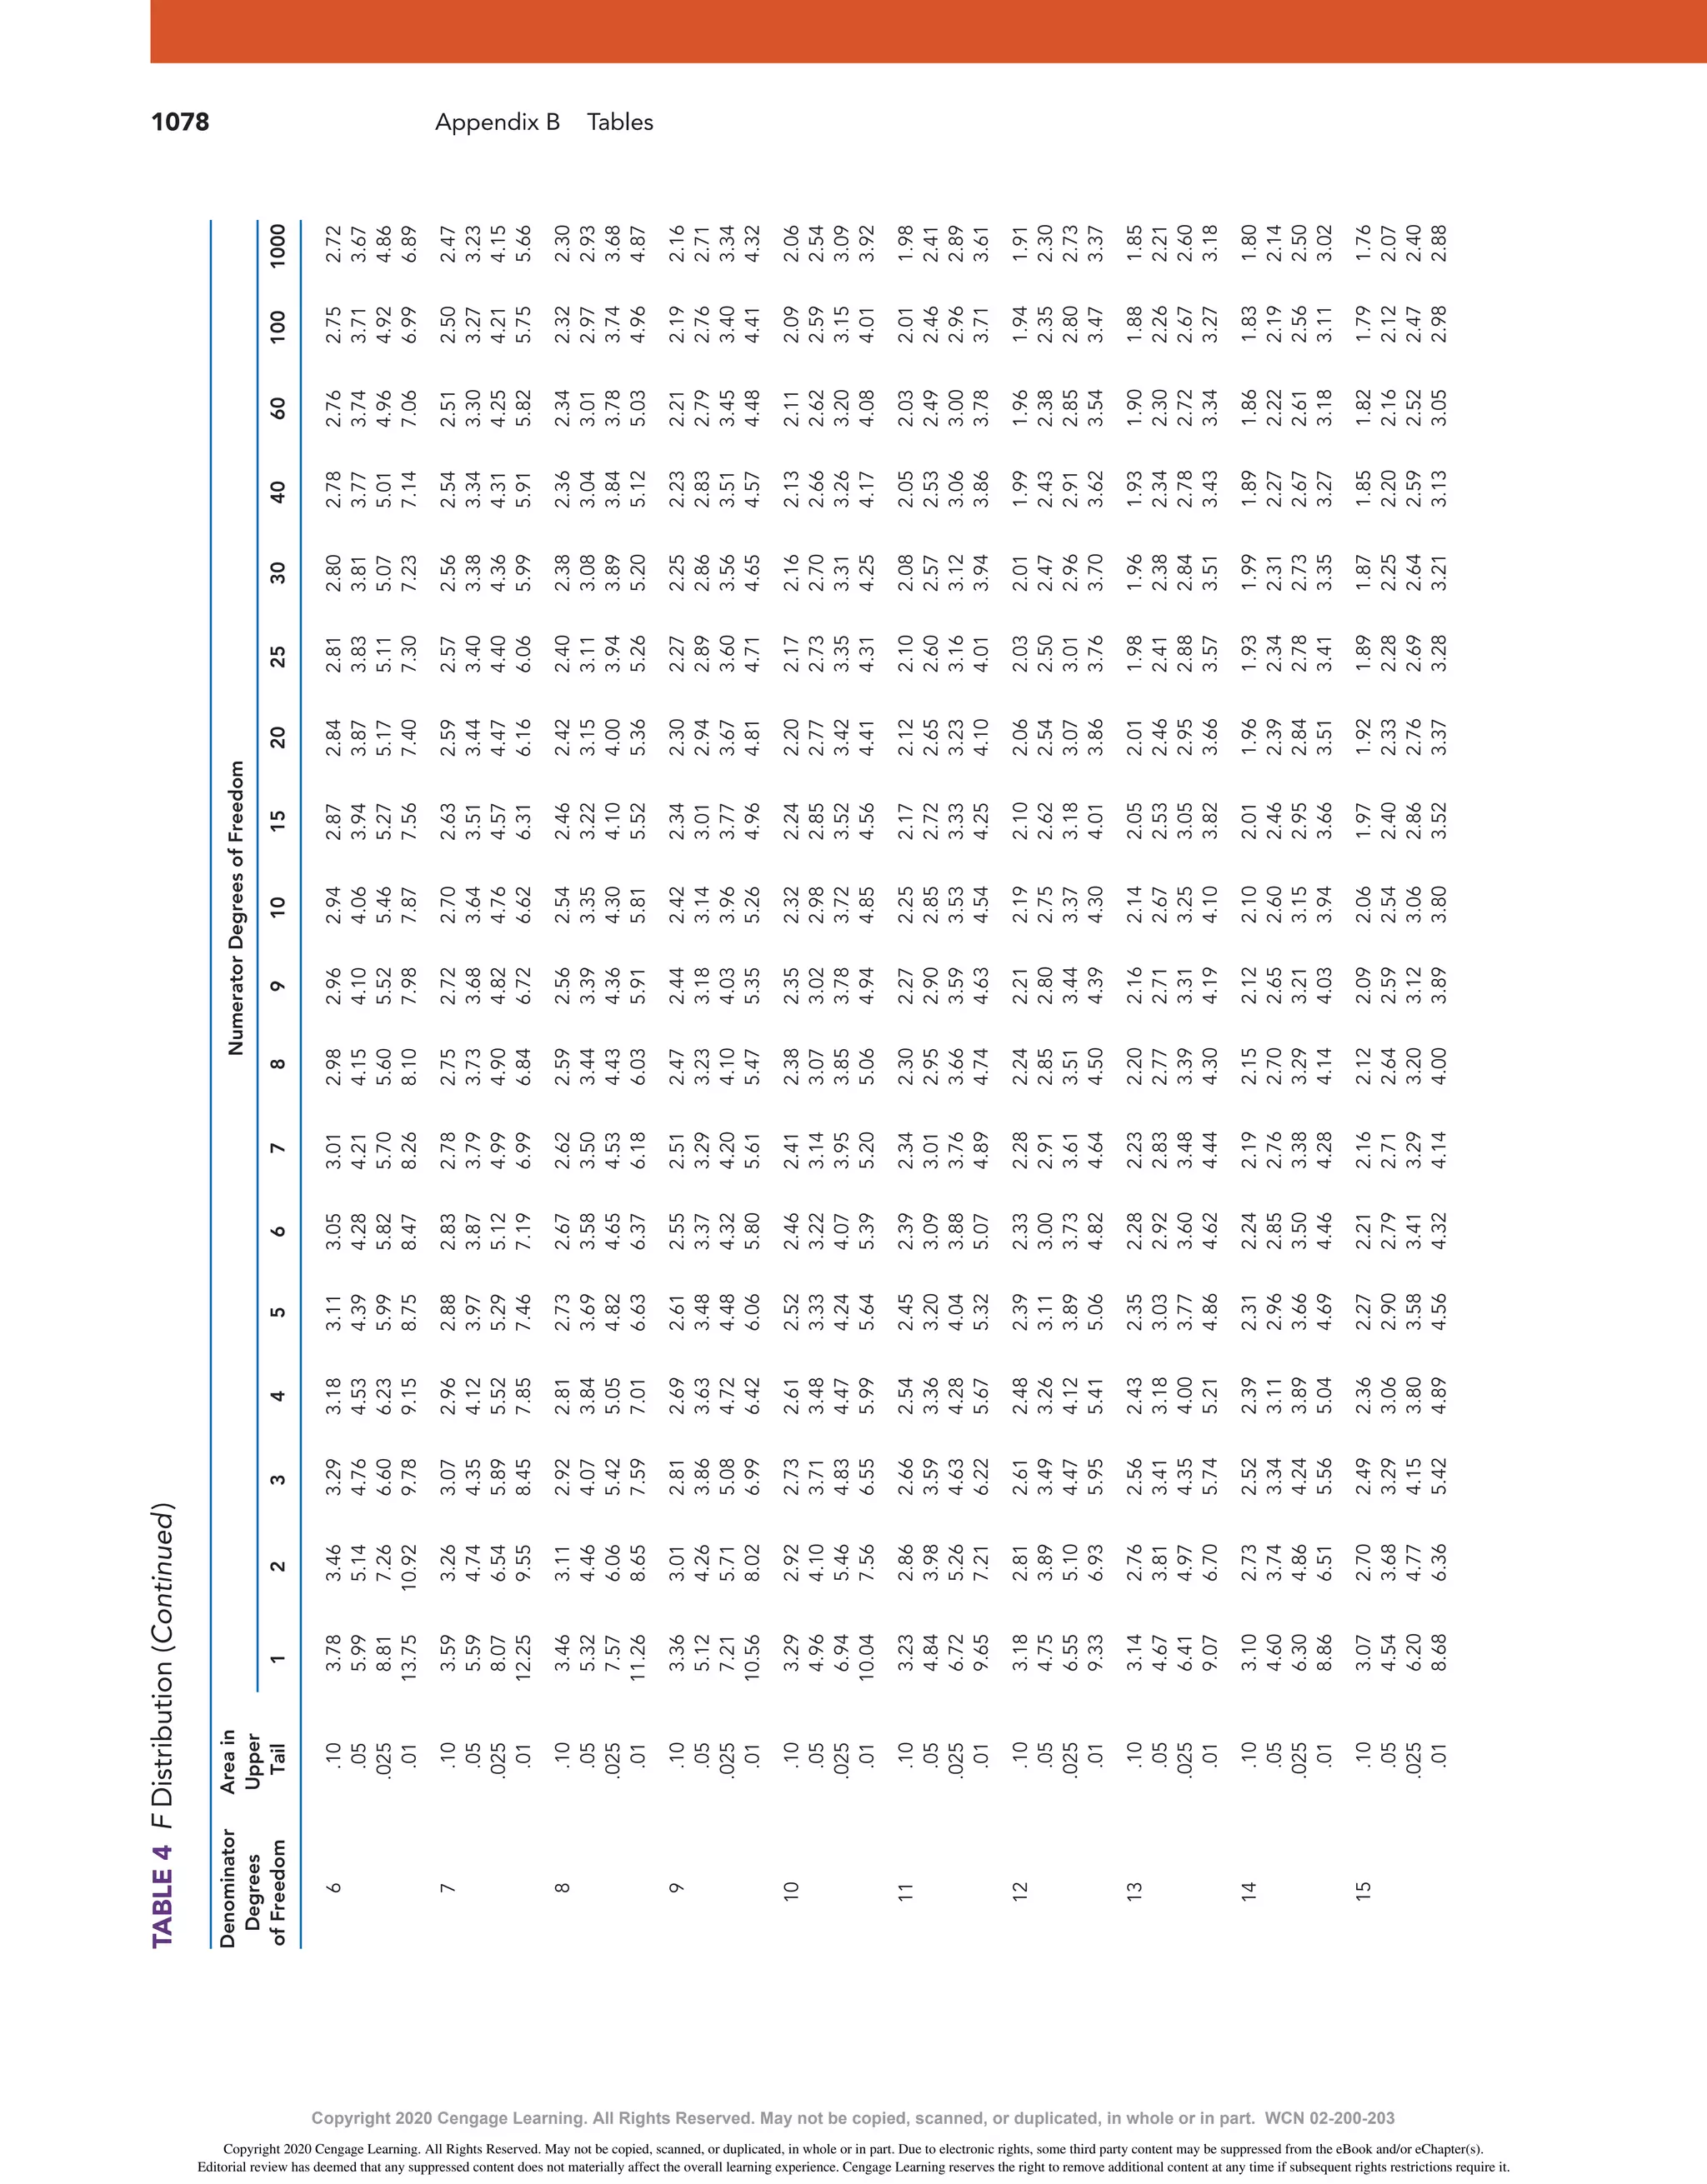
This document contains two tables providing statistical values. Table 1 provides cumulative probability values for the standard normal distribution for z-values ranging from -3 to 3. Table 2 provides critical t-values for selected probabilities and degrees of freedom ranging from 1 to 39. The tables can be used to determine the area under the normal or t-distribution curve for given values.