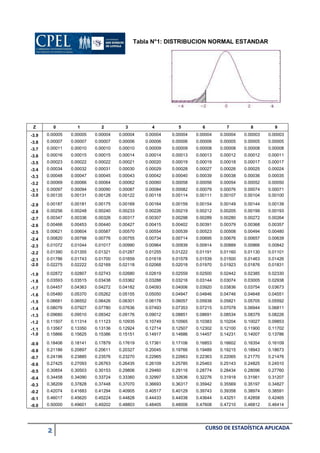
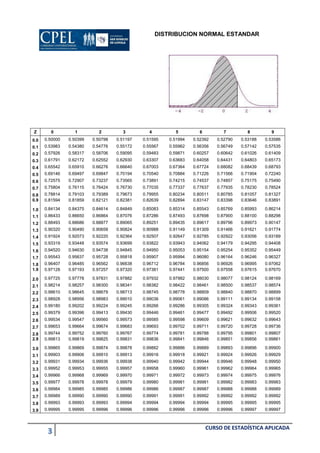
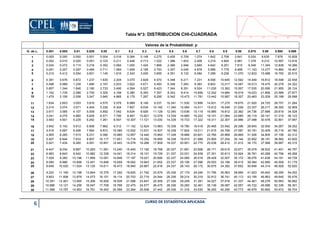
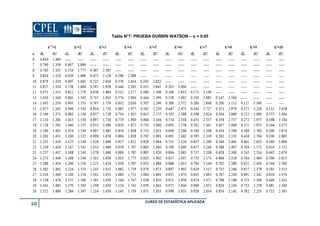
This document contains a table with statistical data showing the standard normal distribution. The table lists z-scores ranging from -3.9 to 2.7 across the top and the corresponding probability values for each z-score listed down the left side. The probability values indicate the percentage of the distribution that falls below that z-score.