Download to read offline
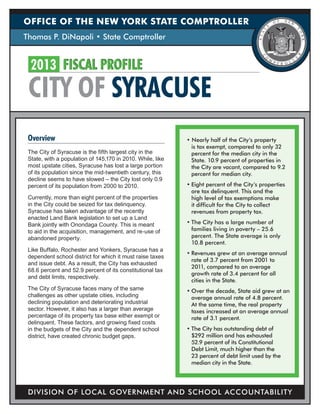


The 2013 fiscal profile of Syracuse highlights the city's significant challenges, including a high percentage of tax-exempt properties (49.5%), a poverty rate of 25.6%, and a notable portion of properties (8%) being tax delinquent. Syracuse has exhausted 52.9% of its constitutional debt limit and faces chronic budget gaps due to rising fixed costs and reliance on unstable state aid. The city's revenues have grown at a rate of 3.7% annually from 2001 to 2011, but the budget is under pressure with a projected depletion of fund balances in the coming years.