Download as PDF, PPTX

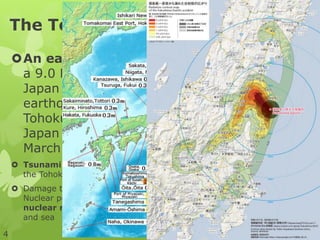
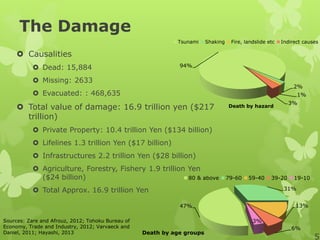
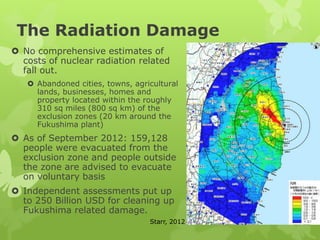
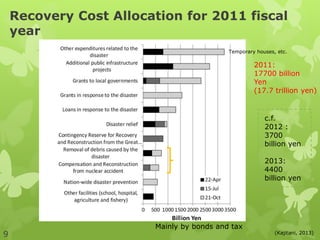
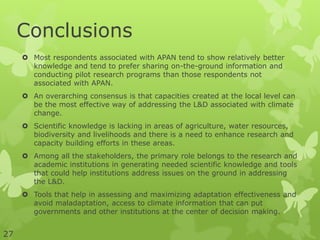


The document discusses the Tohoku disaster in Japan, detailing the catastrophic events of March 11, 2011, including a massive earthquake, tsunami, and nuclear fallout, which resulted in significant loss of life and extensive damages estimated at 16.9 trillion yen. It highlights key lessons on disaster management, the importance of community engagement, information sharing, and the ongoing challenges in recovery and adaptation to climate change effects. Additionally, it reflects on stakeholder perceptions regarding loss and damage from climate change, emphasizing the need for enhanced knowledge and local capacity to address these issues.


![REDD+ Dynamics: [not] A one size fit all solution](https://cdn.slidesharecdn.com/ss_thumbnails/efrianmuharromdinamikaredd6sept20163-161129081132-thumbnail.jpg?width=640&height=640&fit=bounds)


