Download as PDF, PPTX
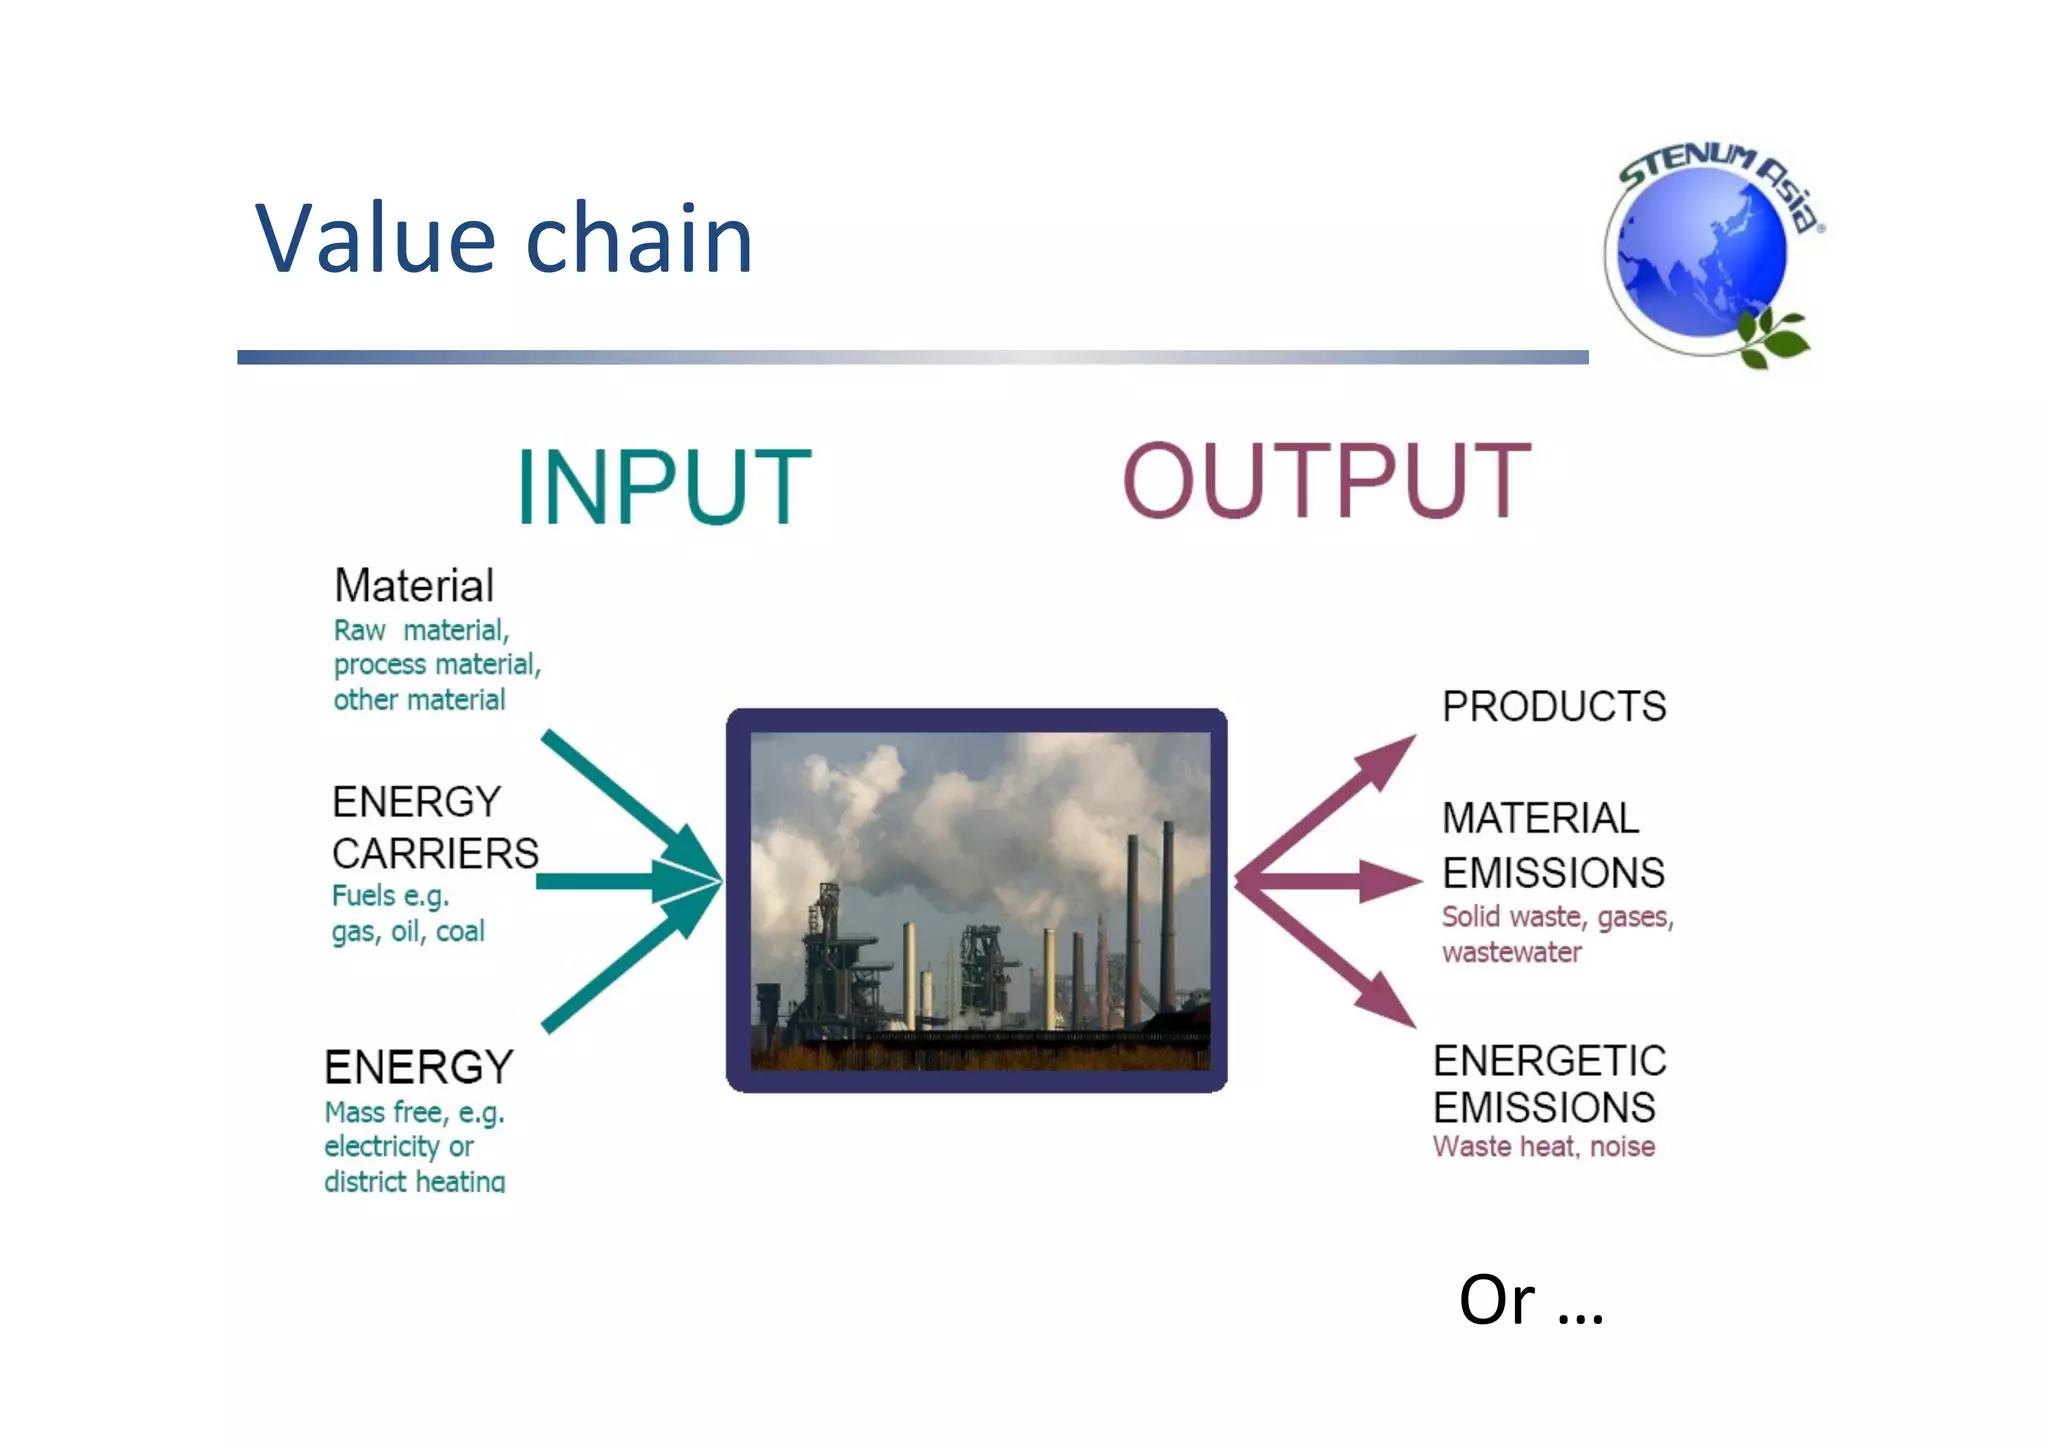
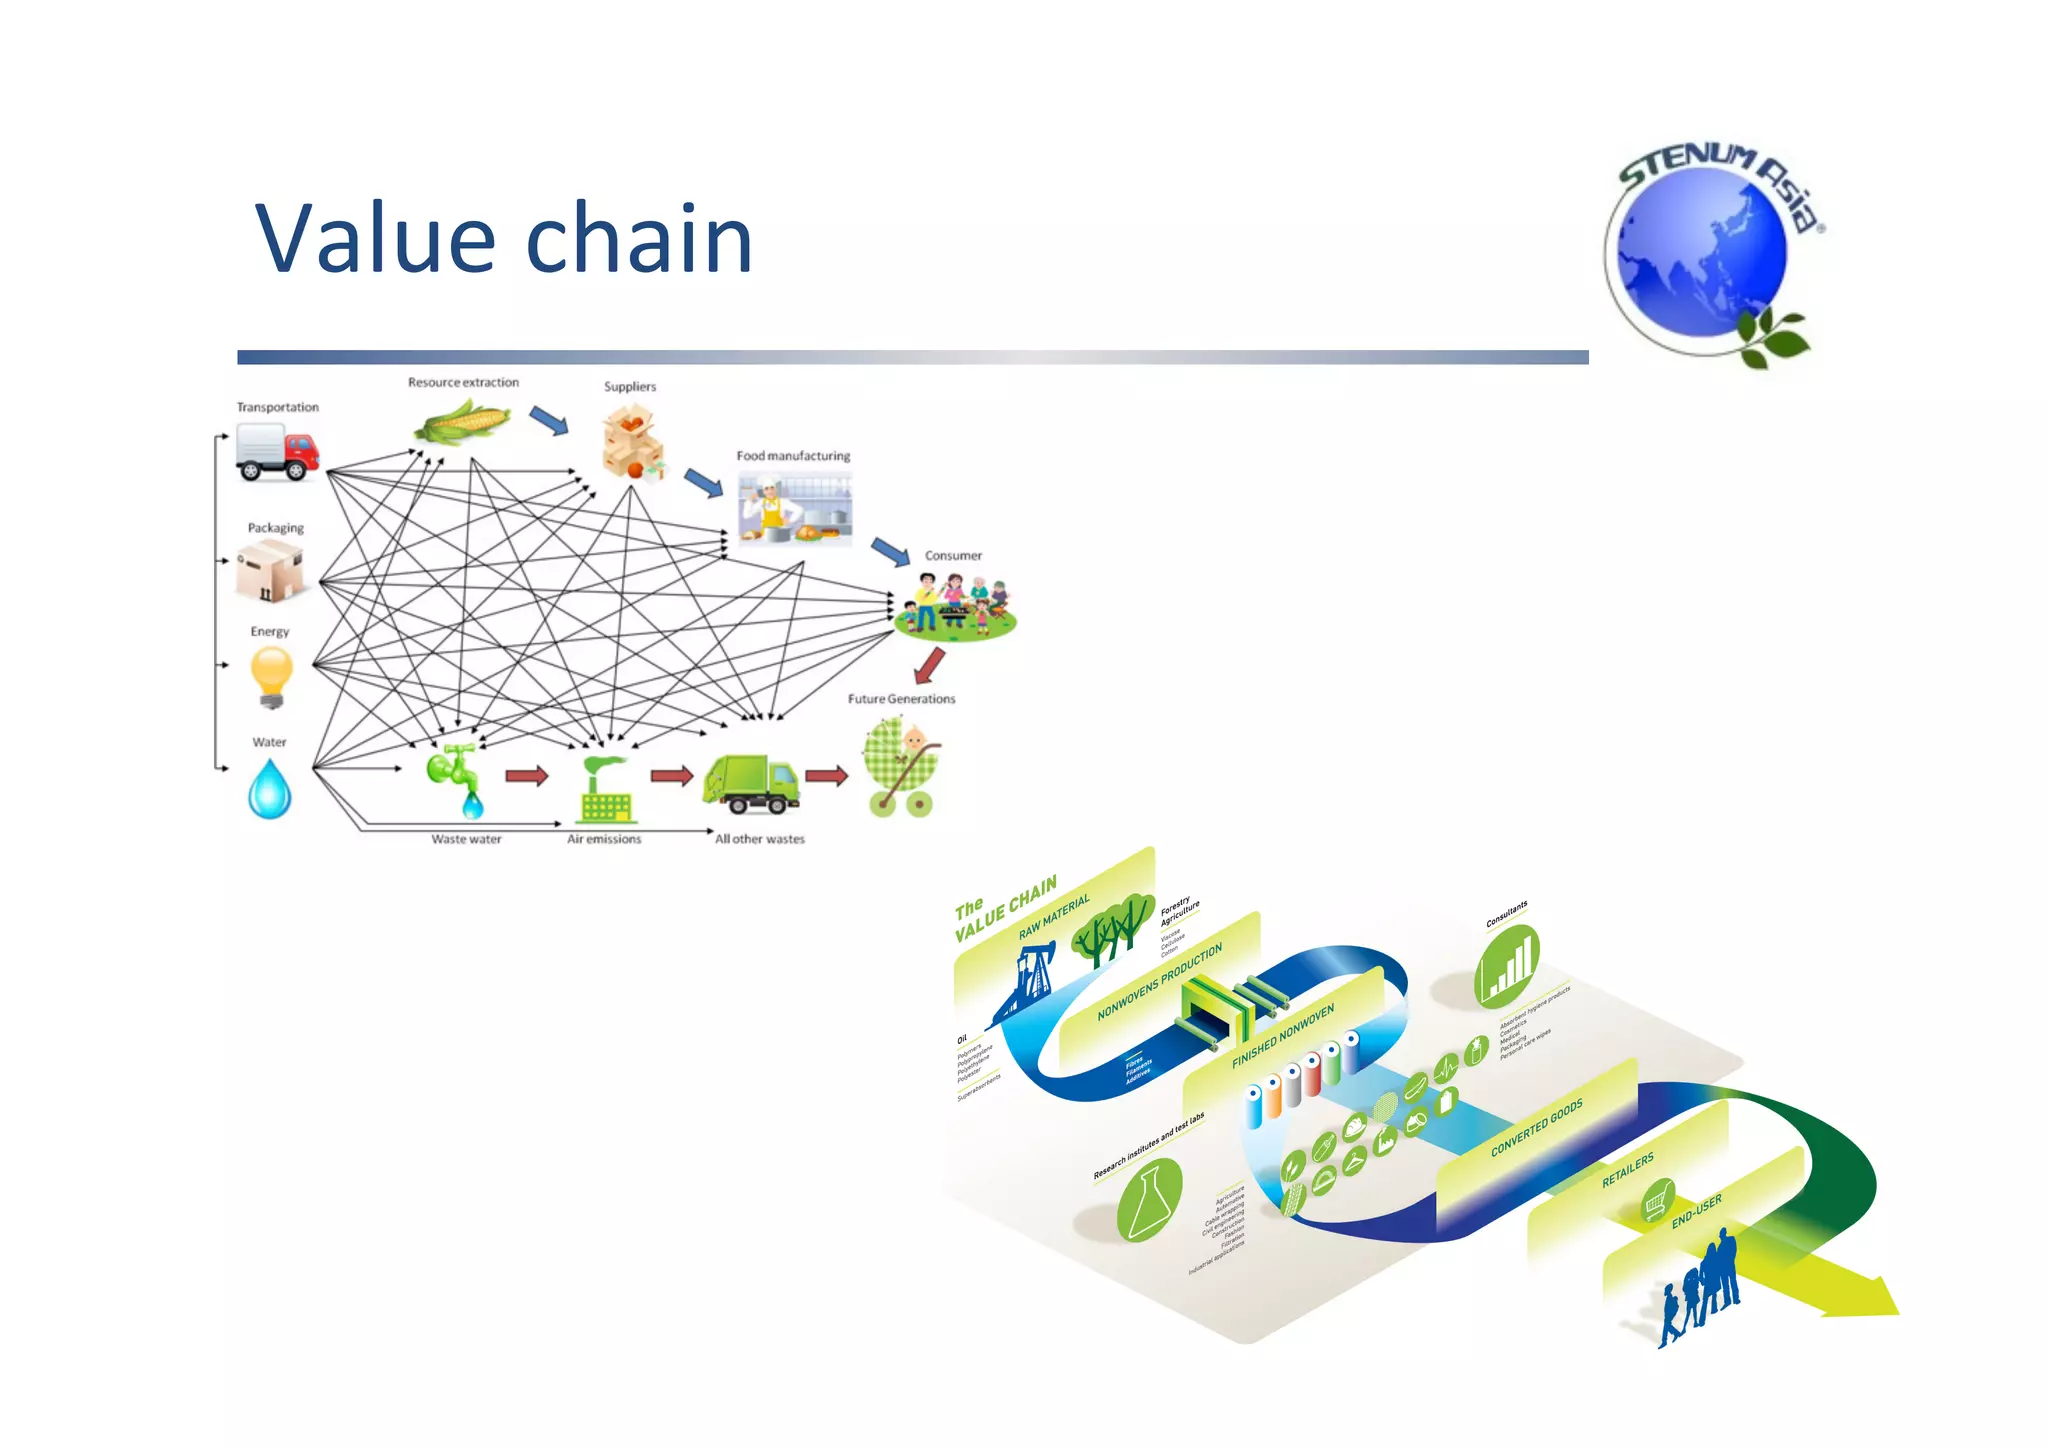
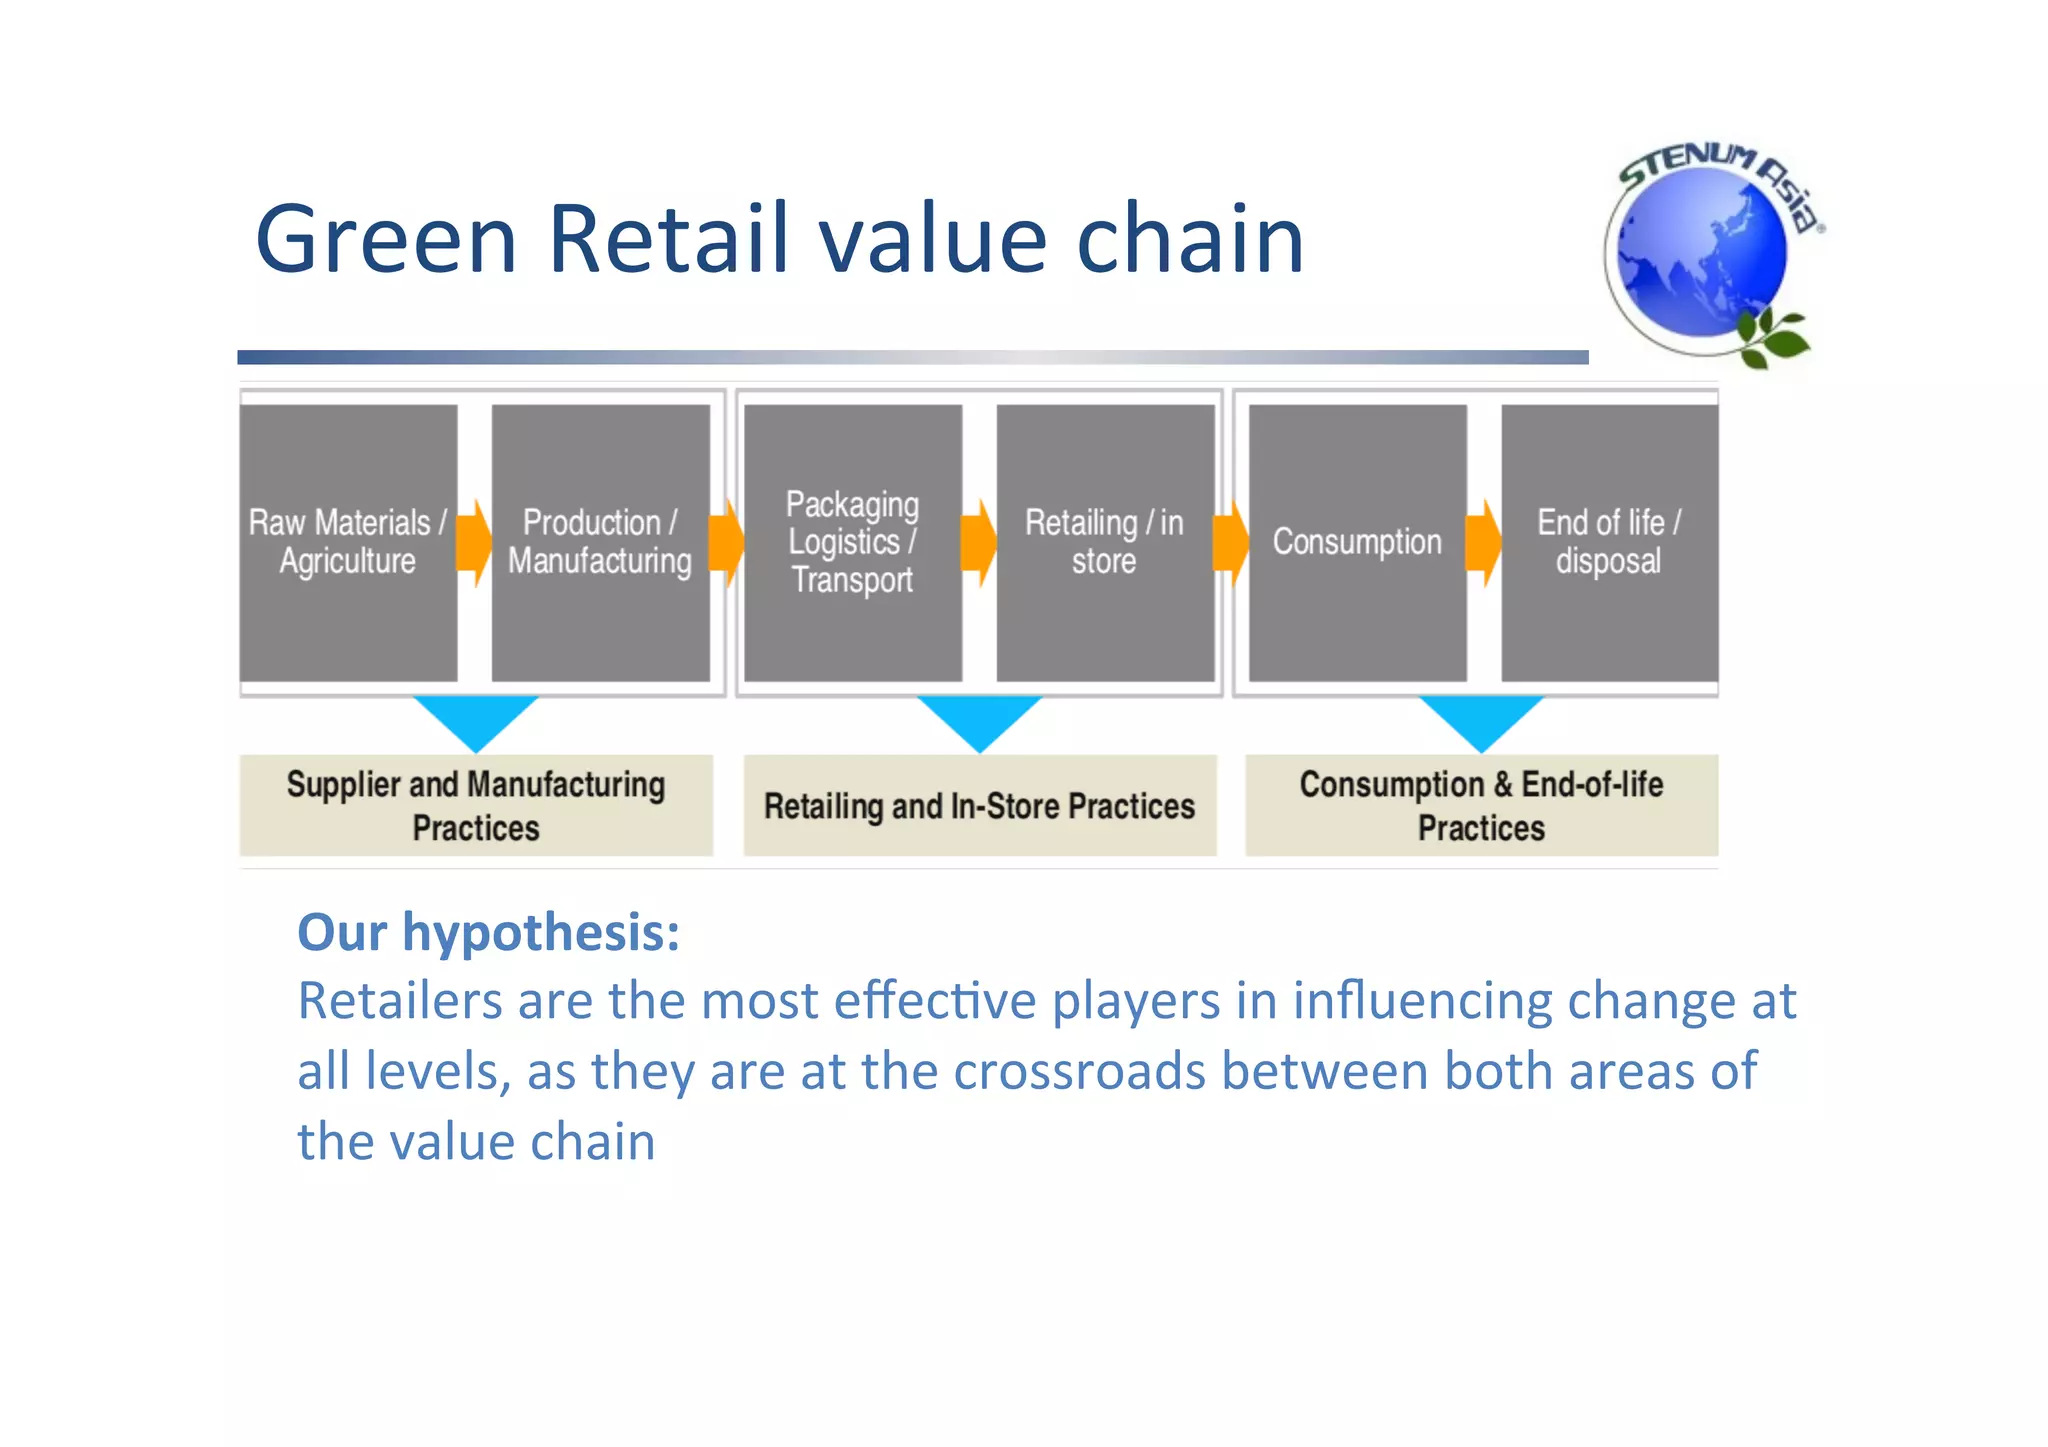
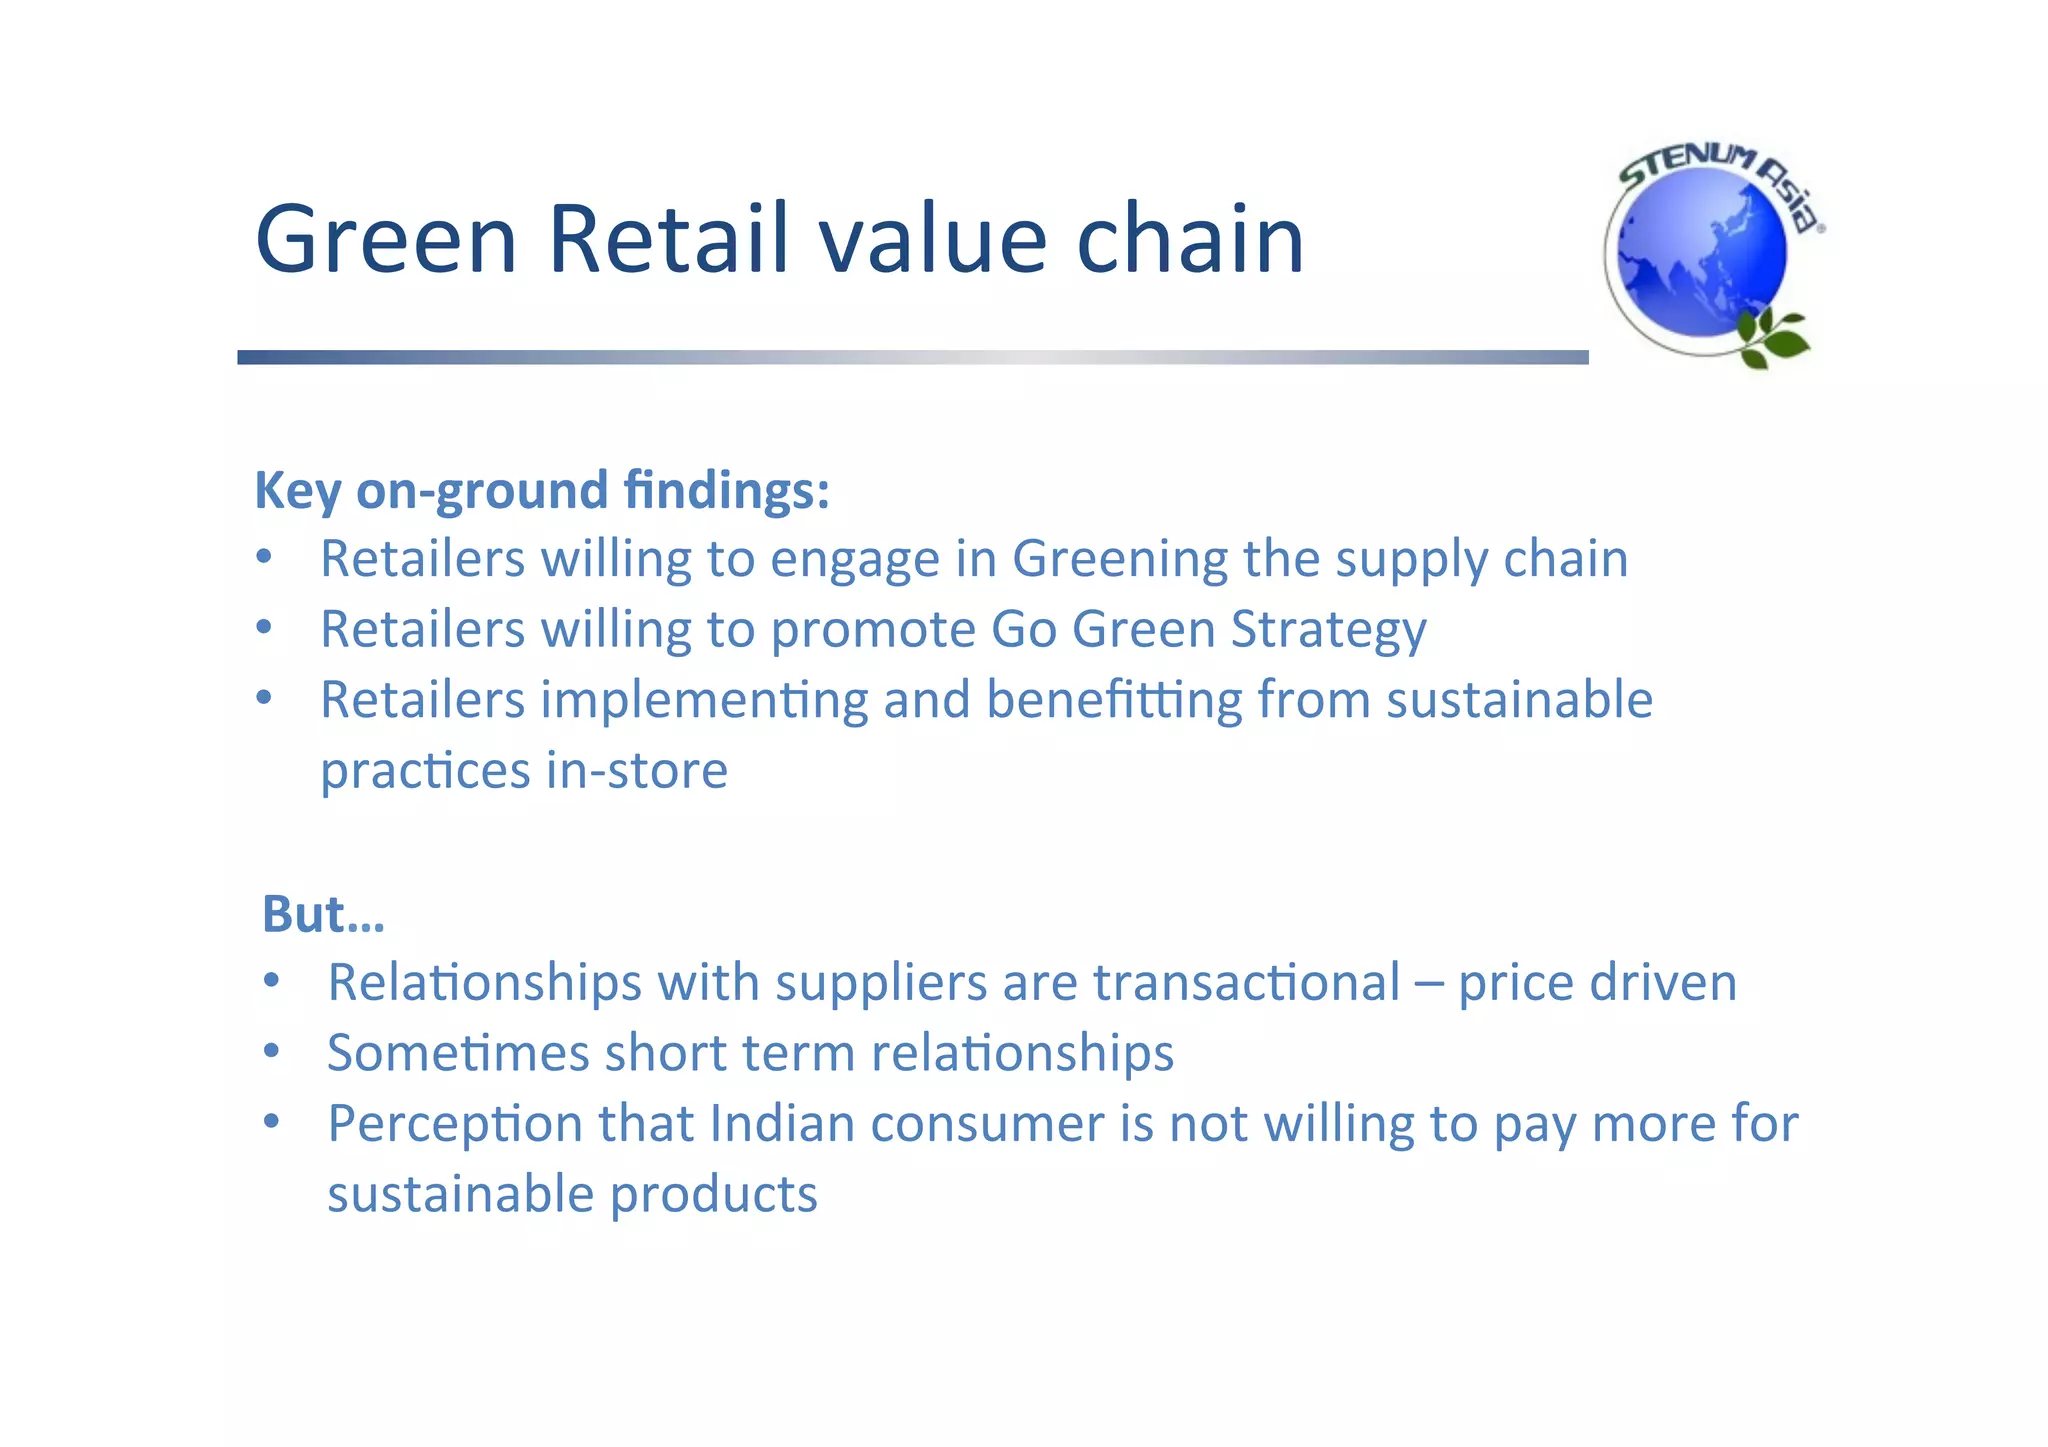
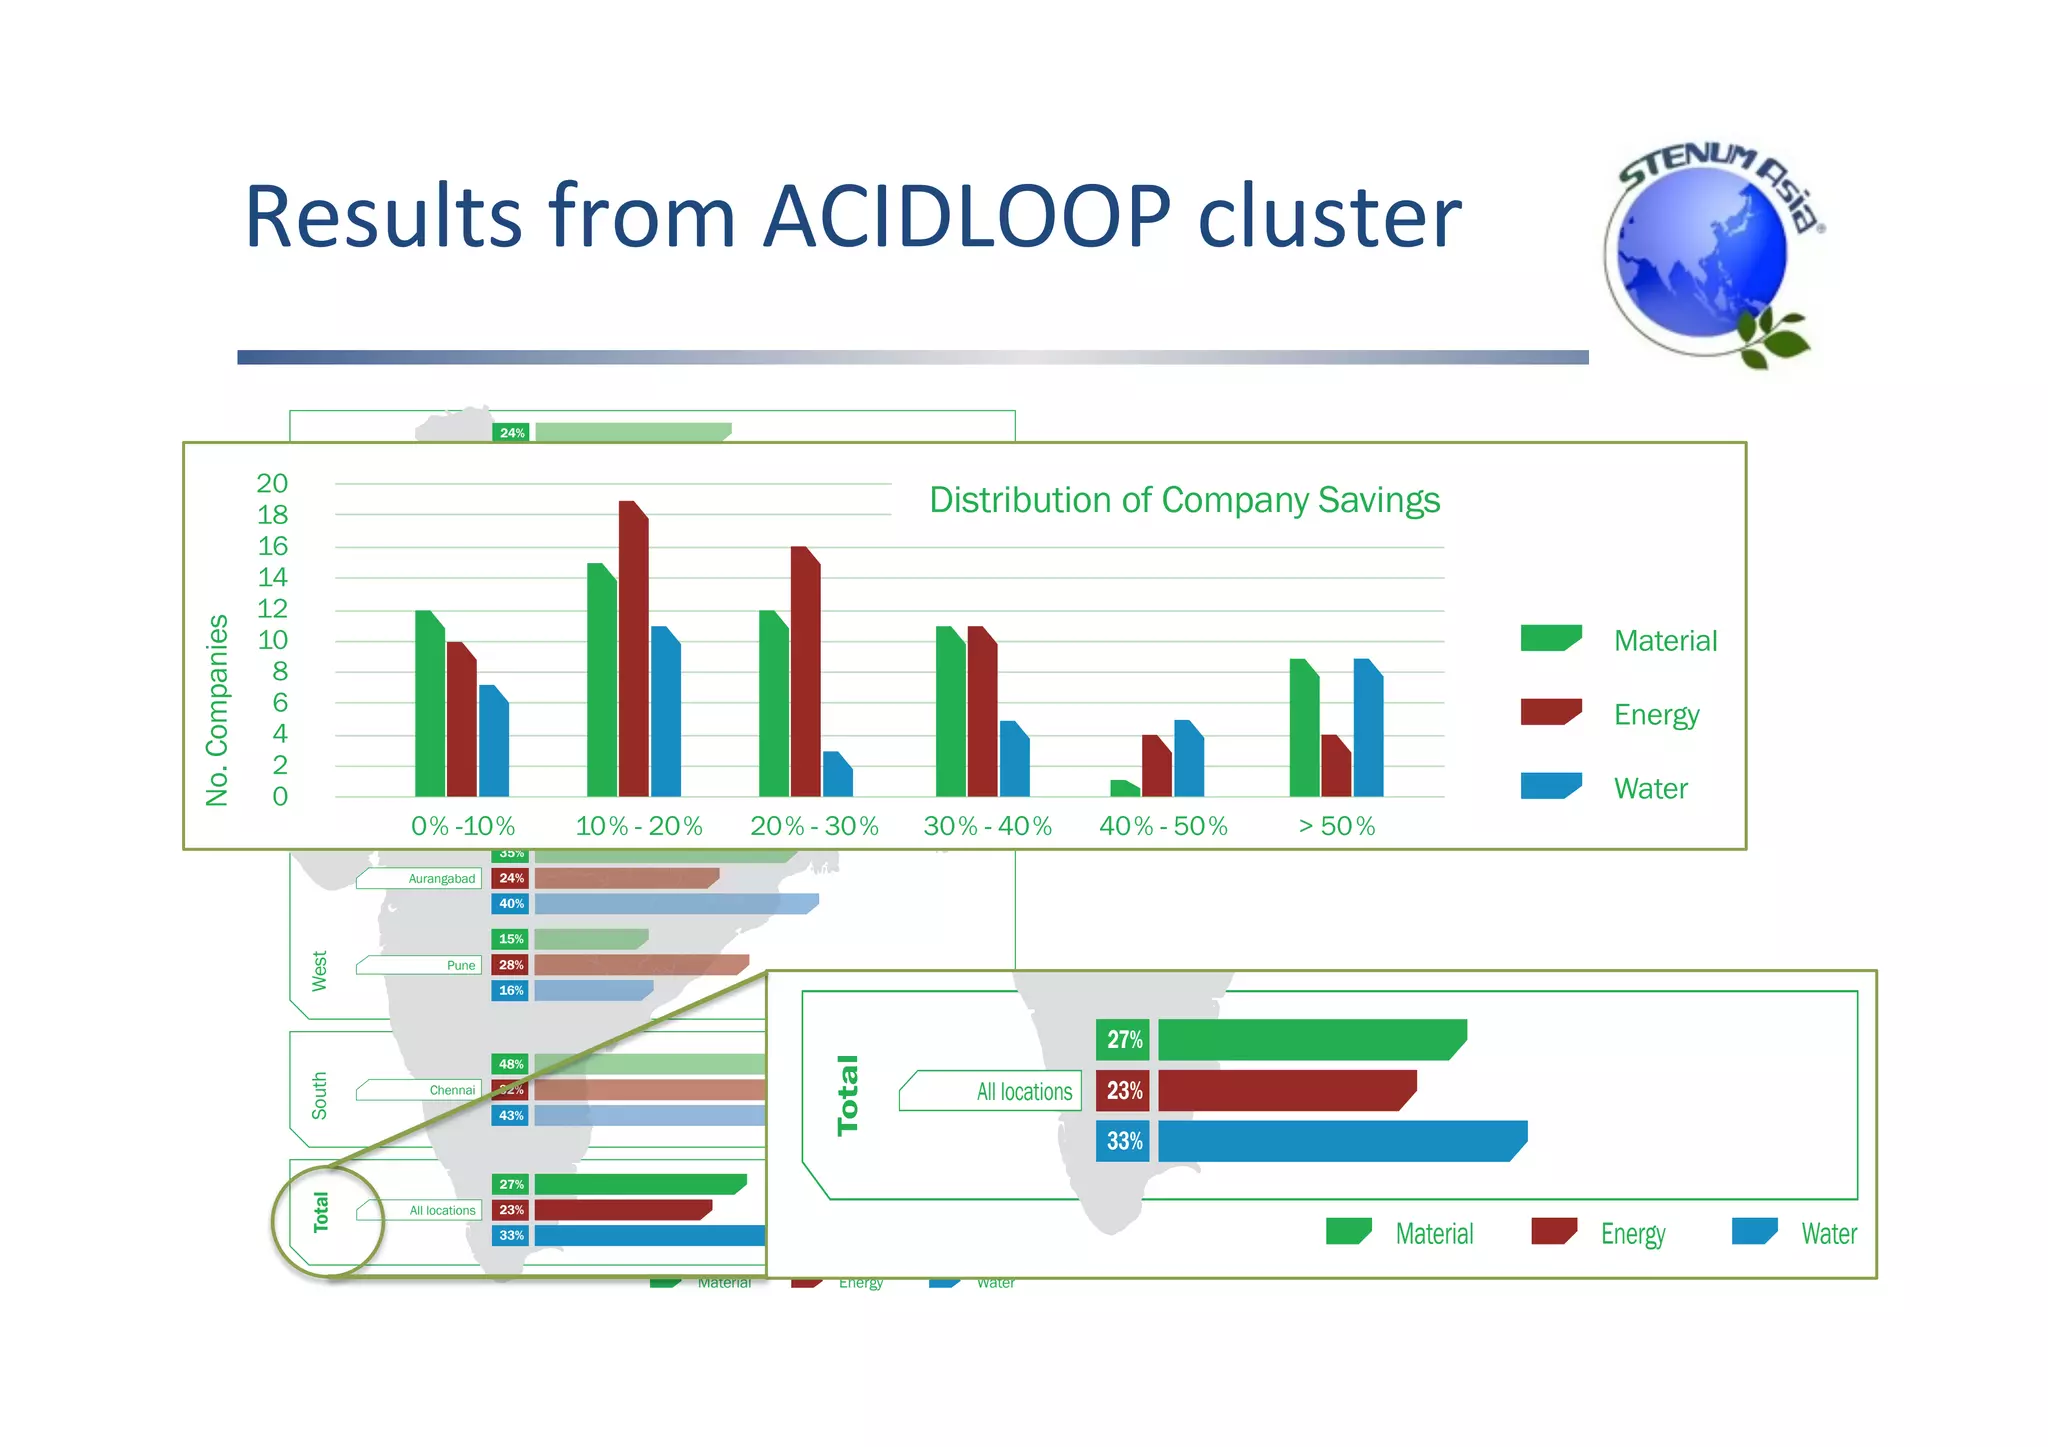
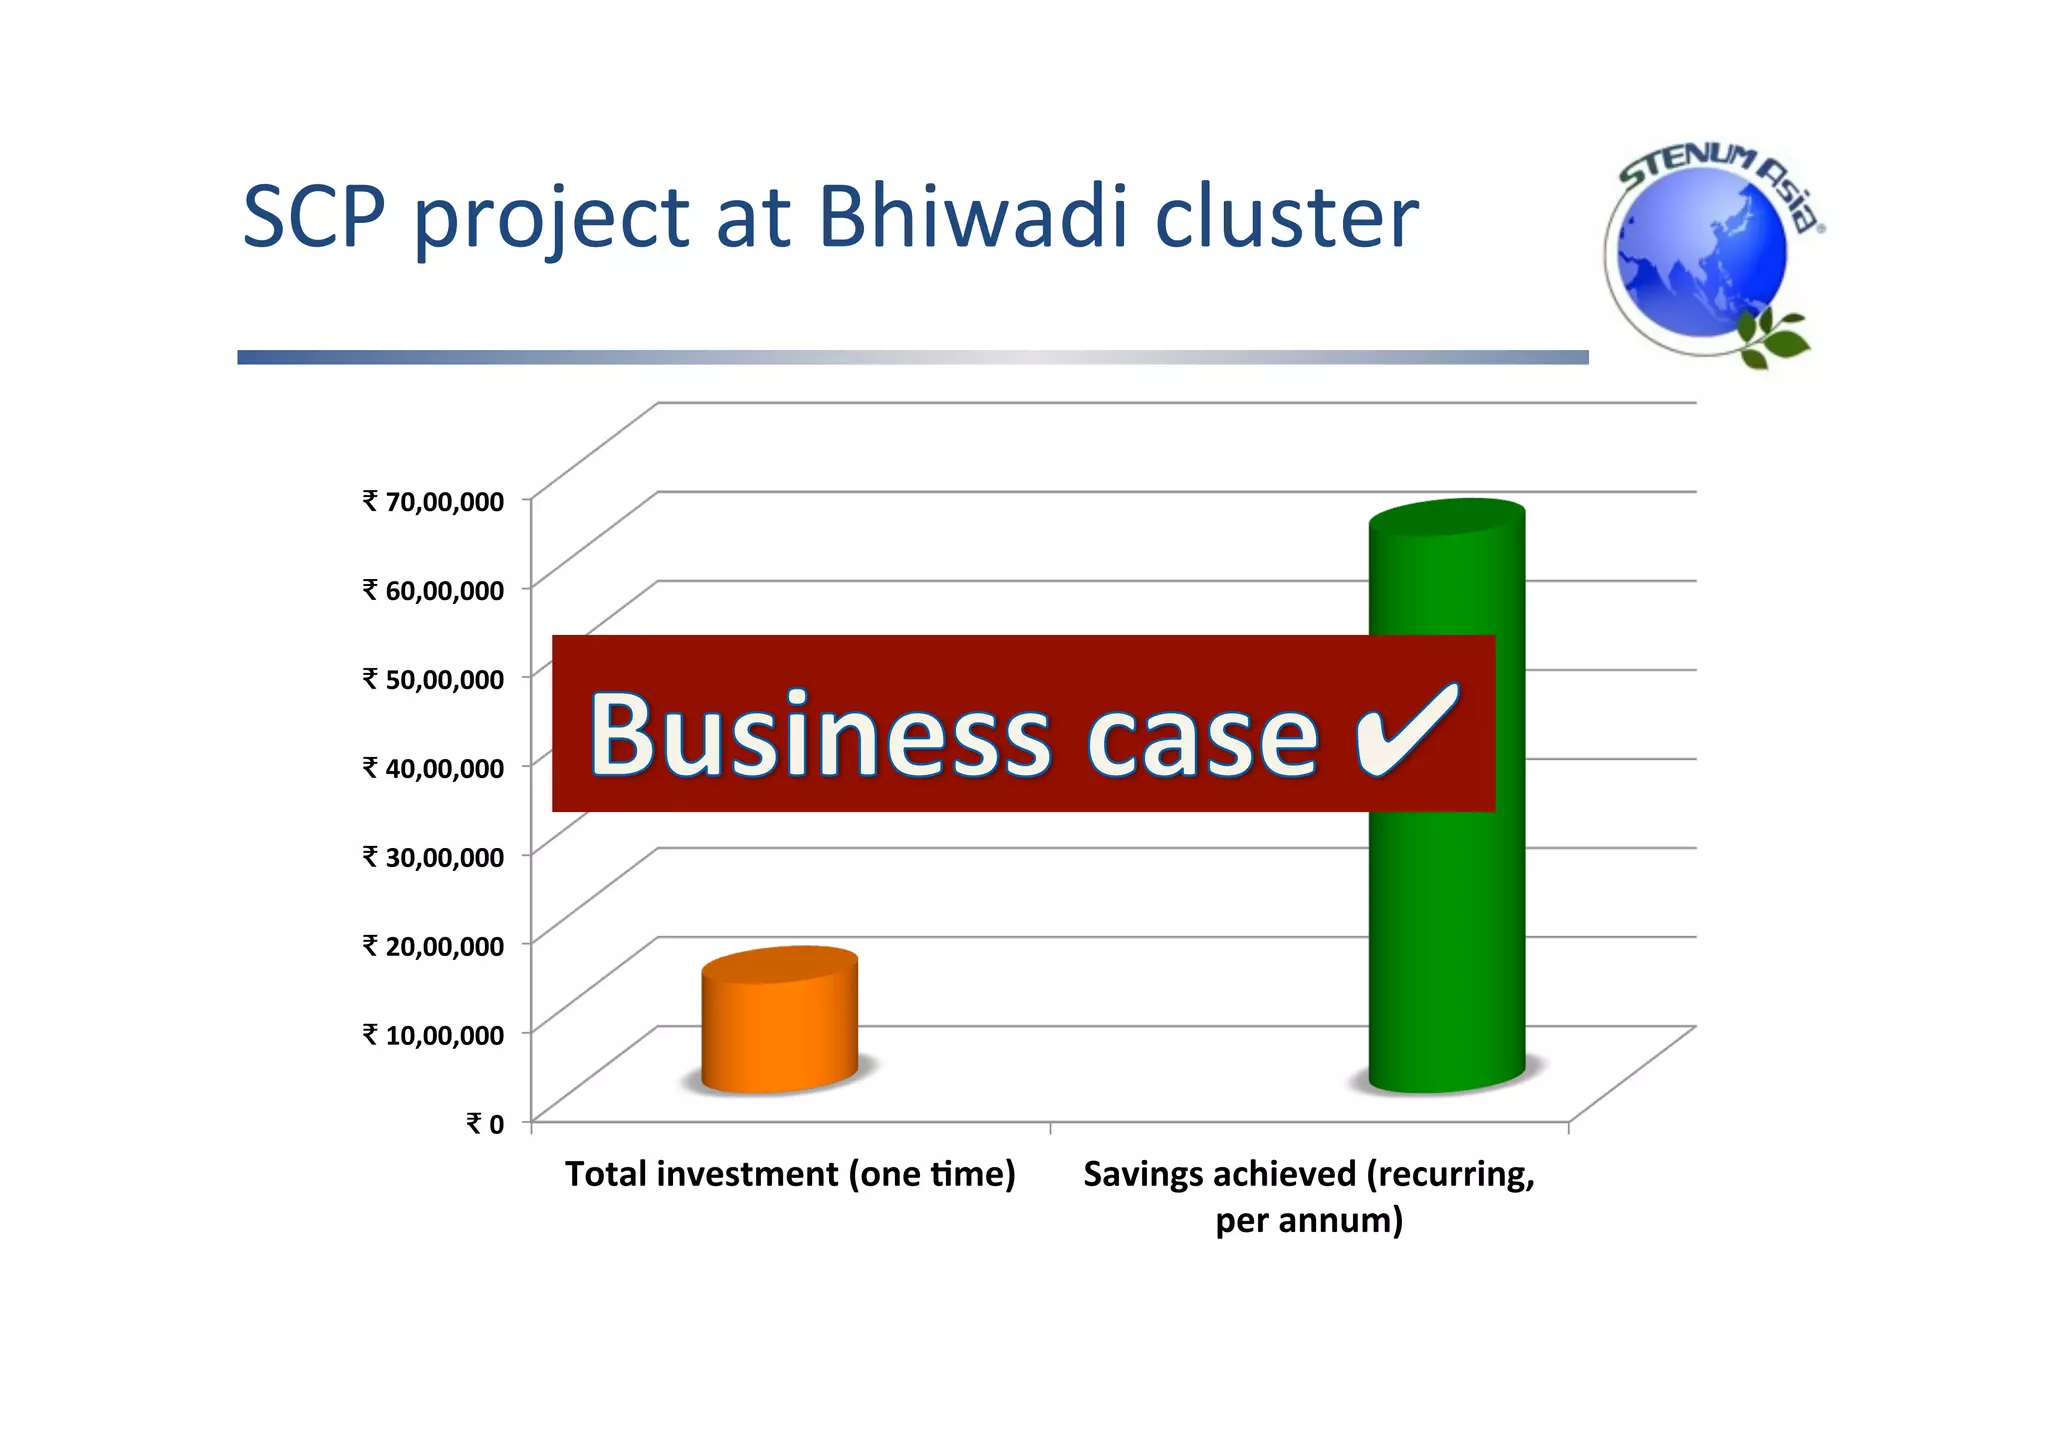
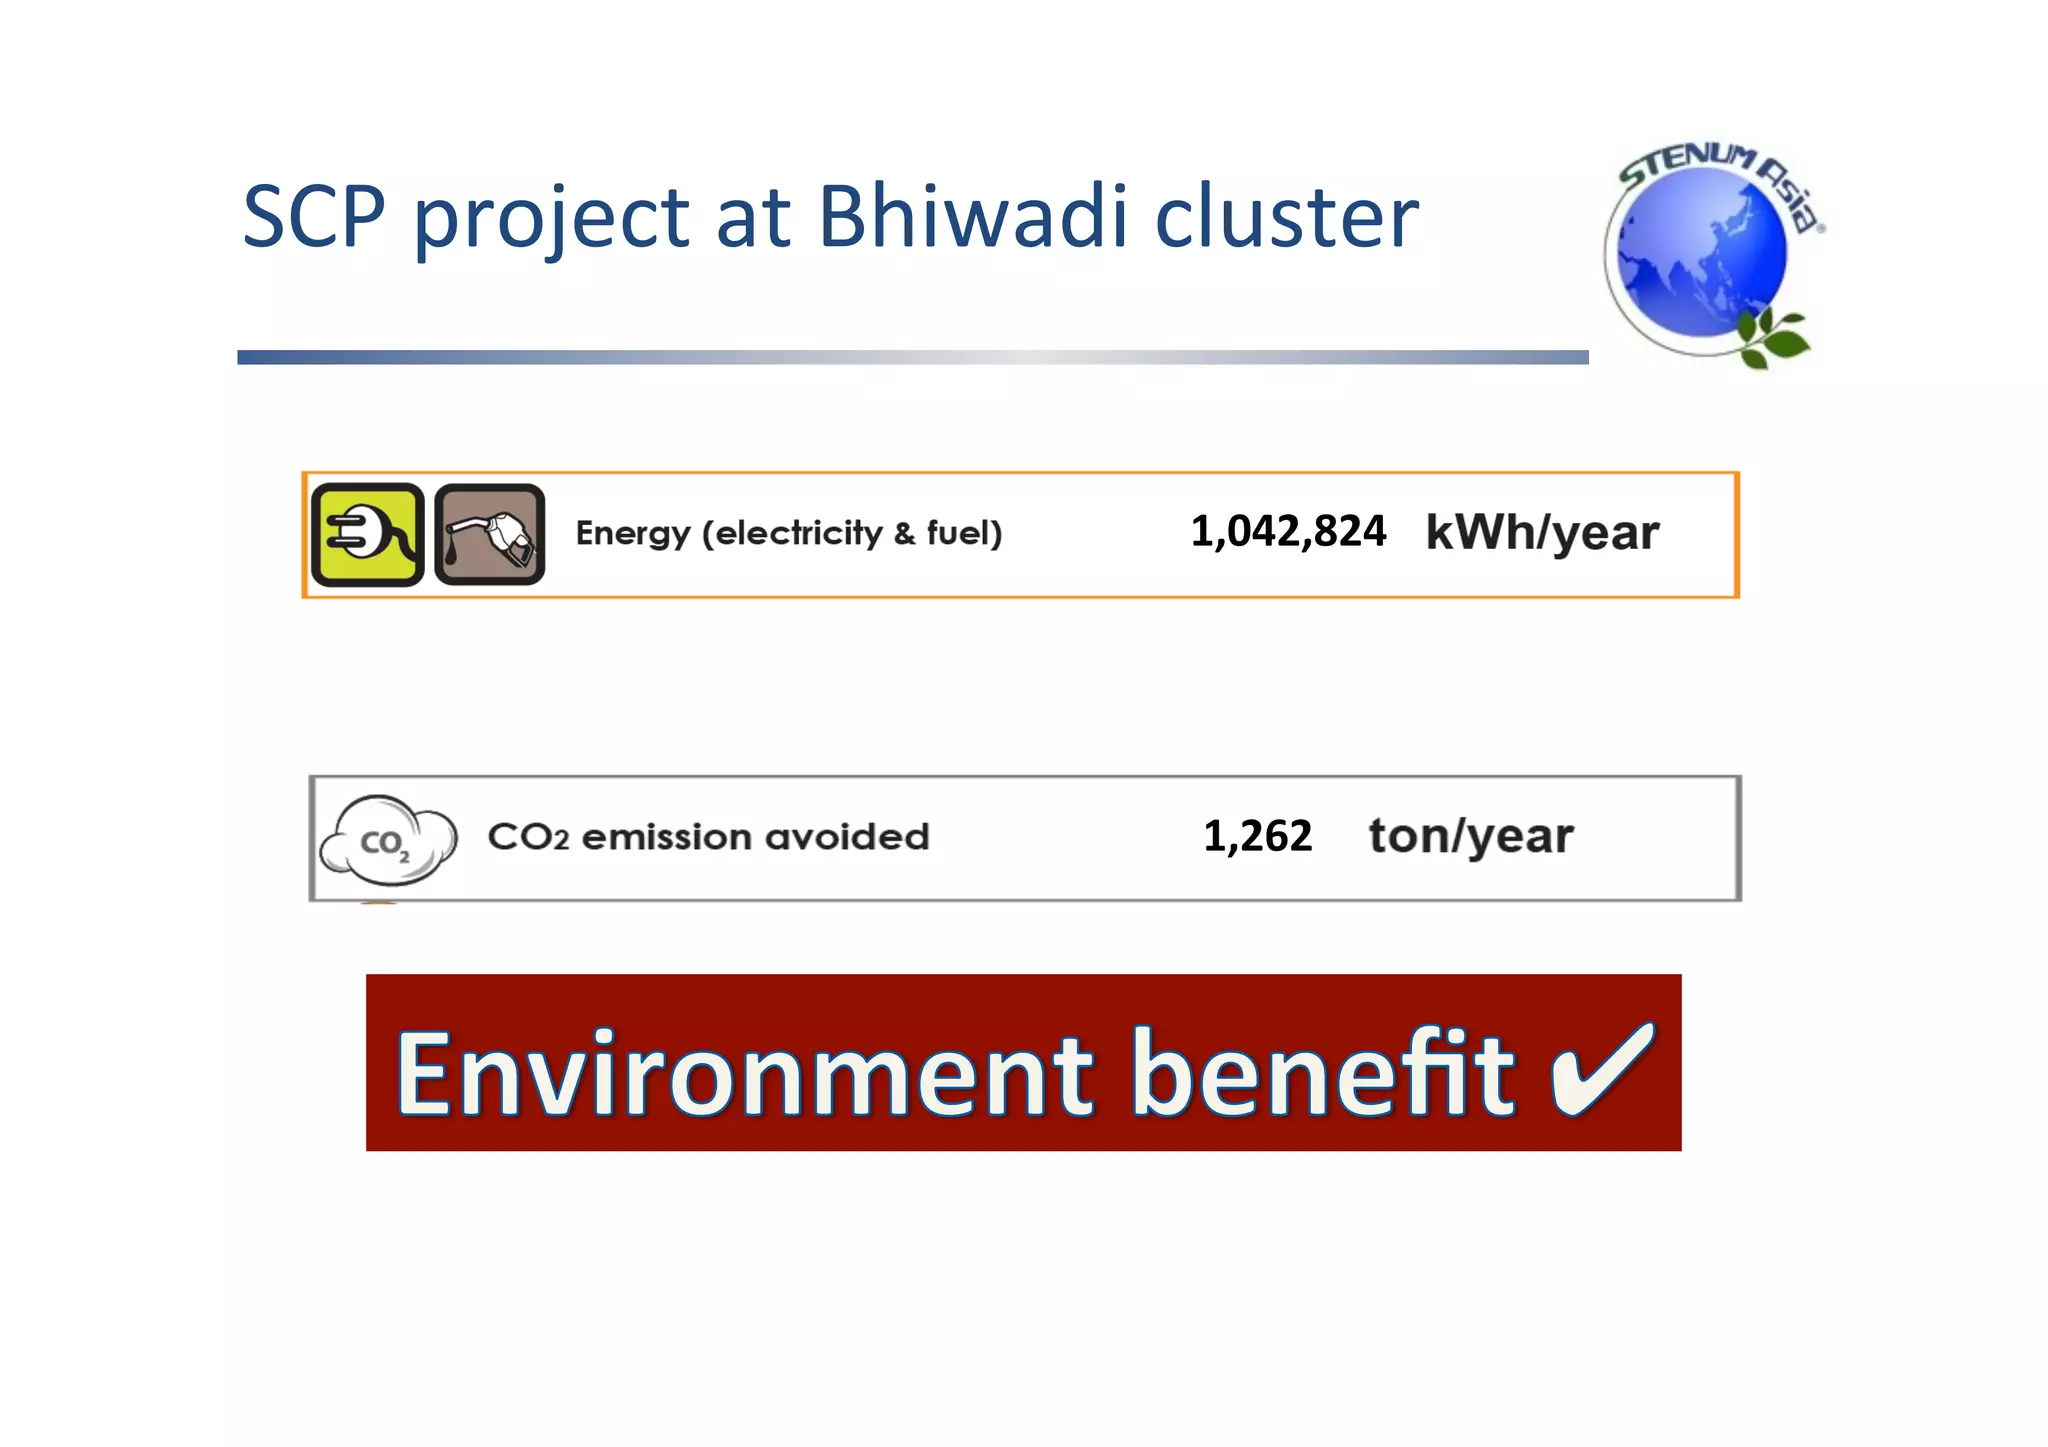
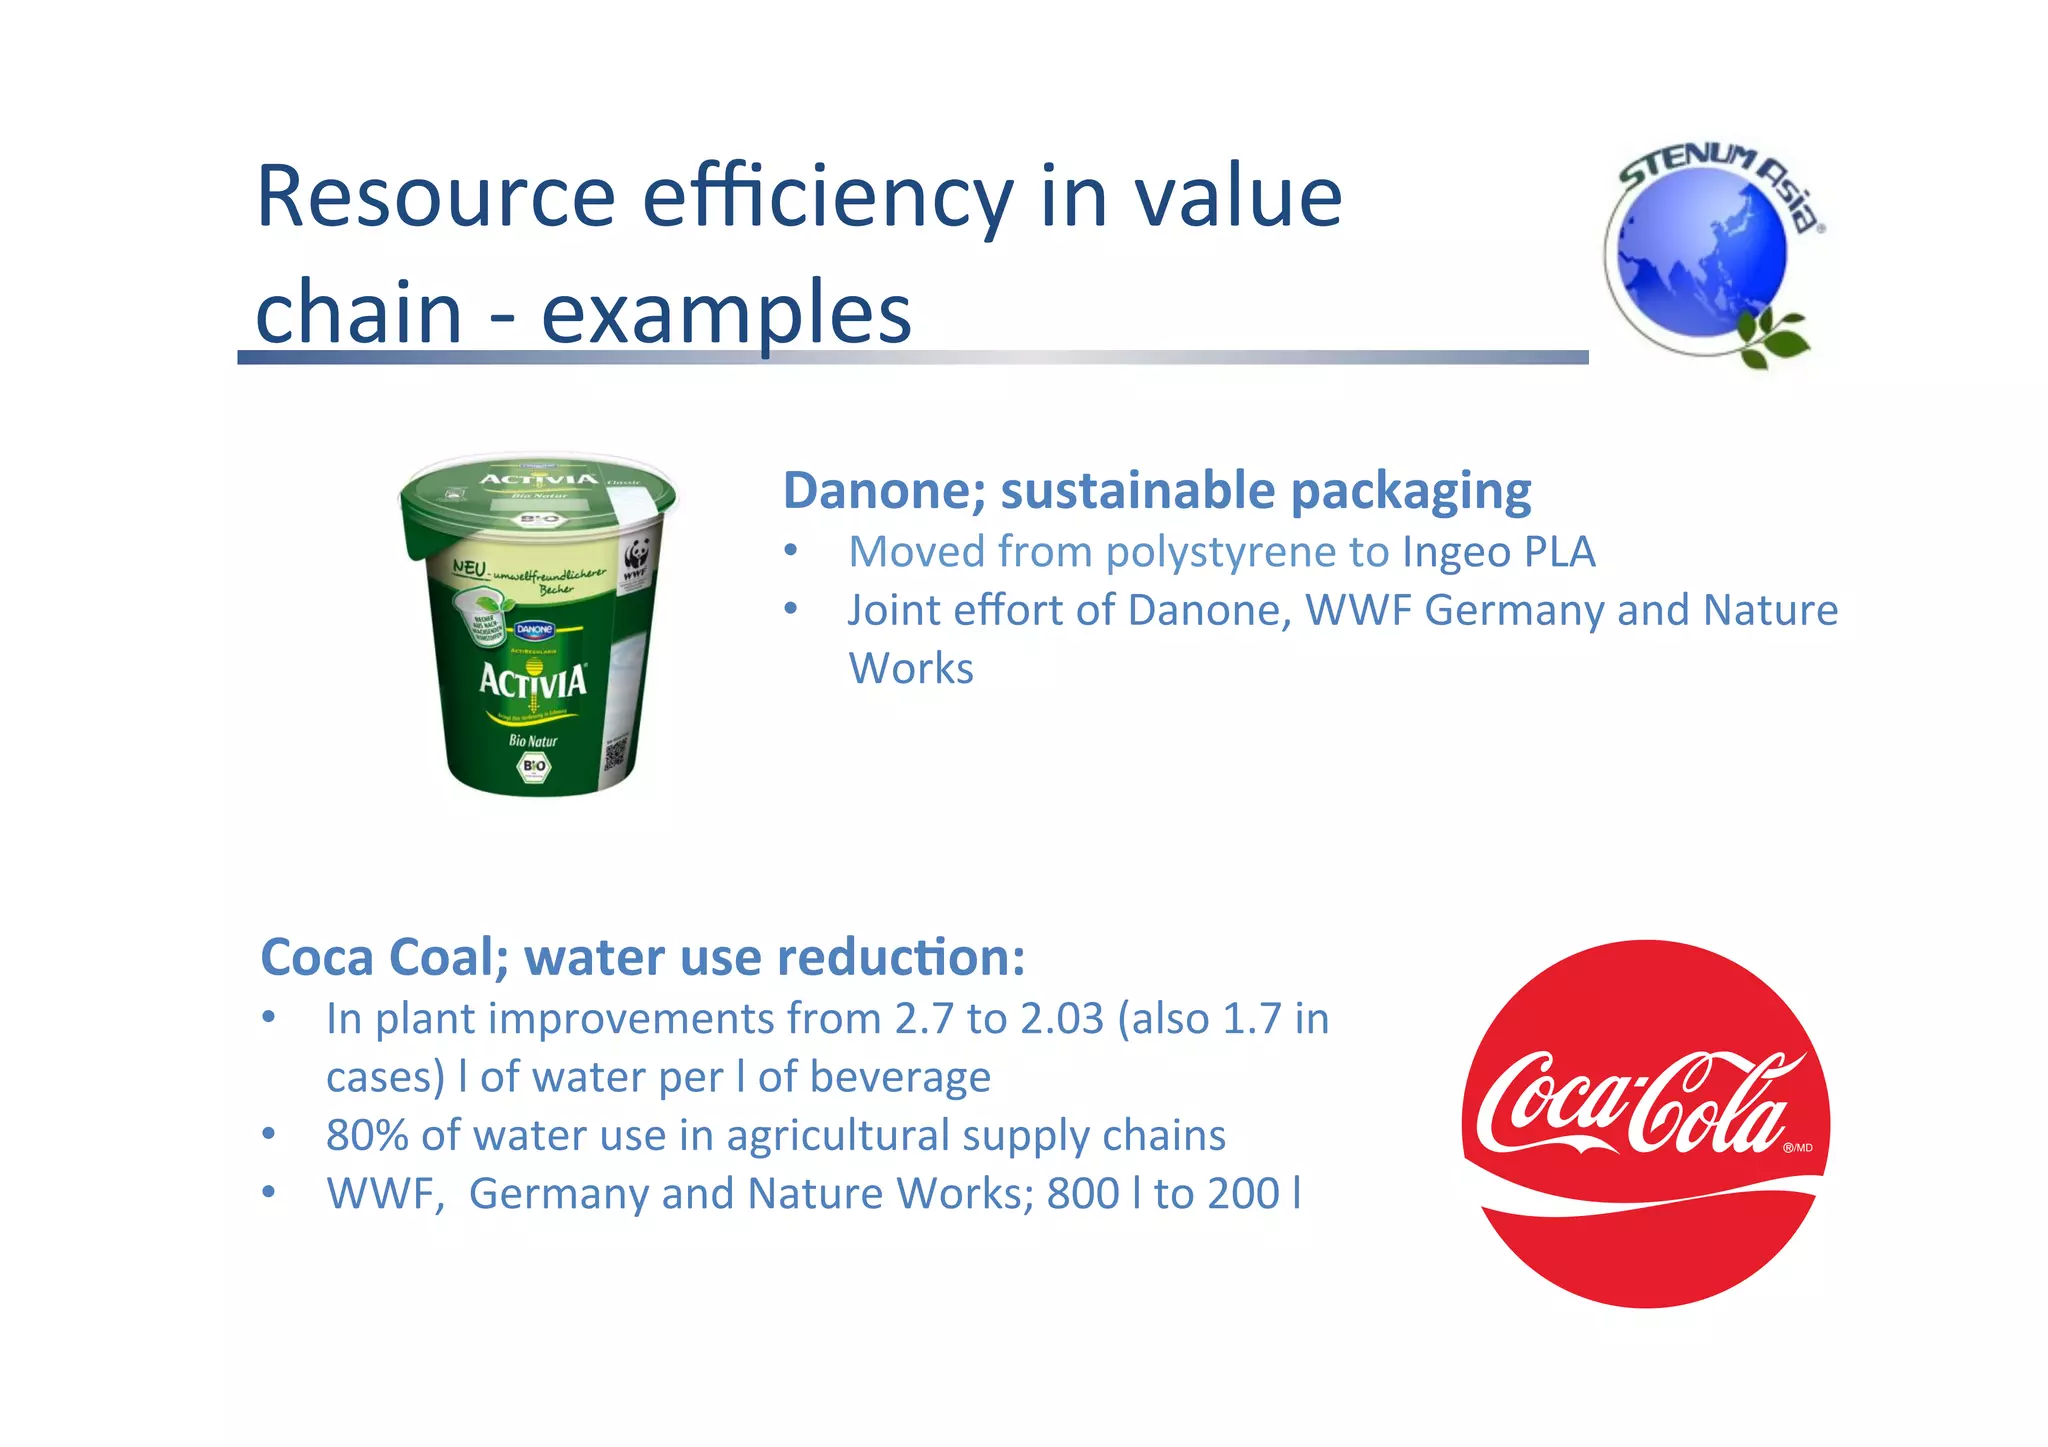
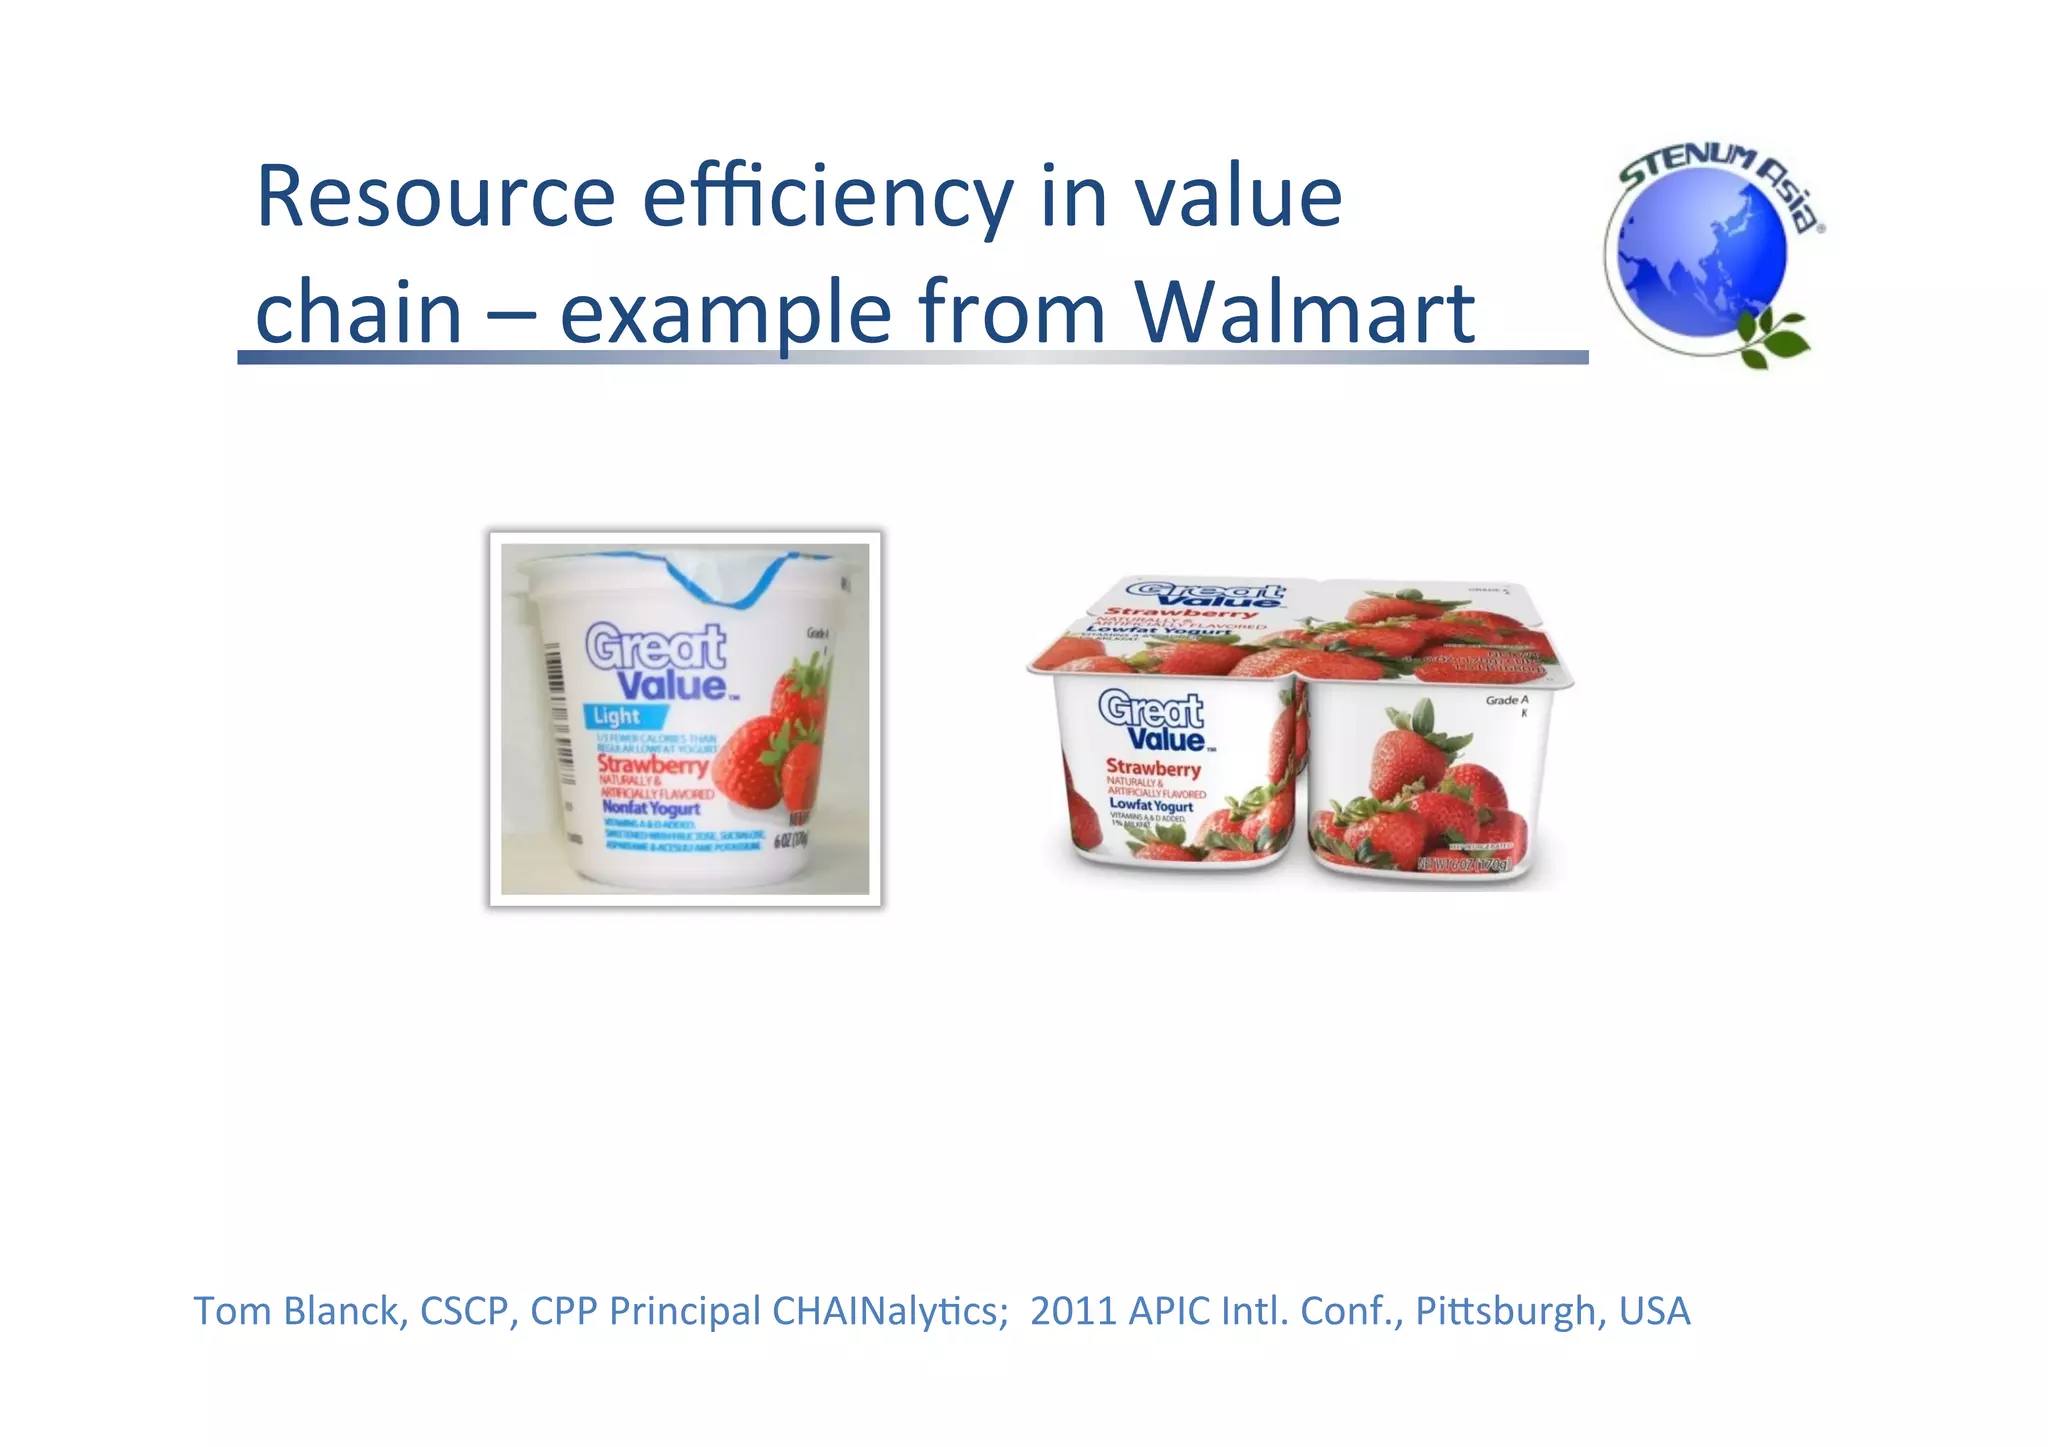
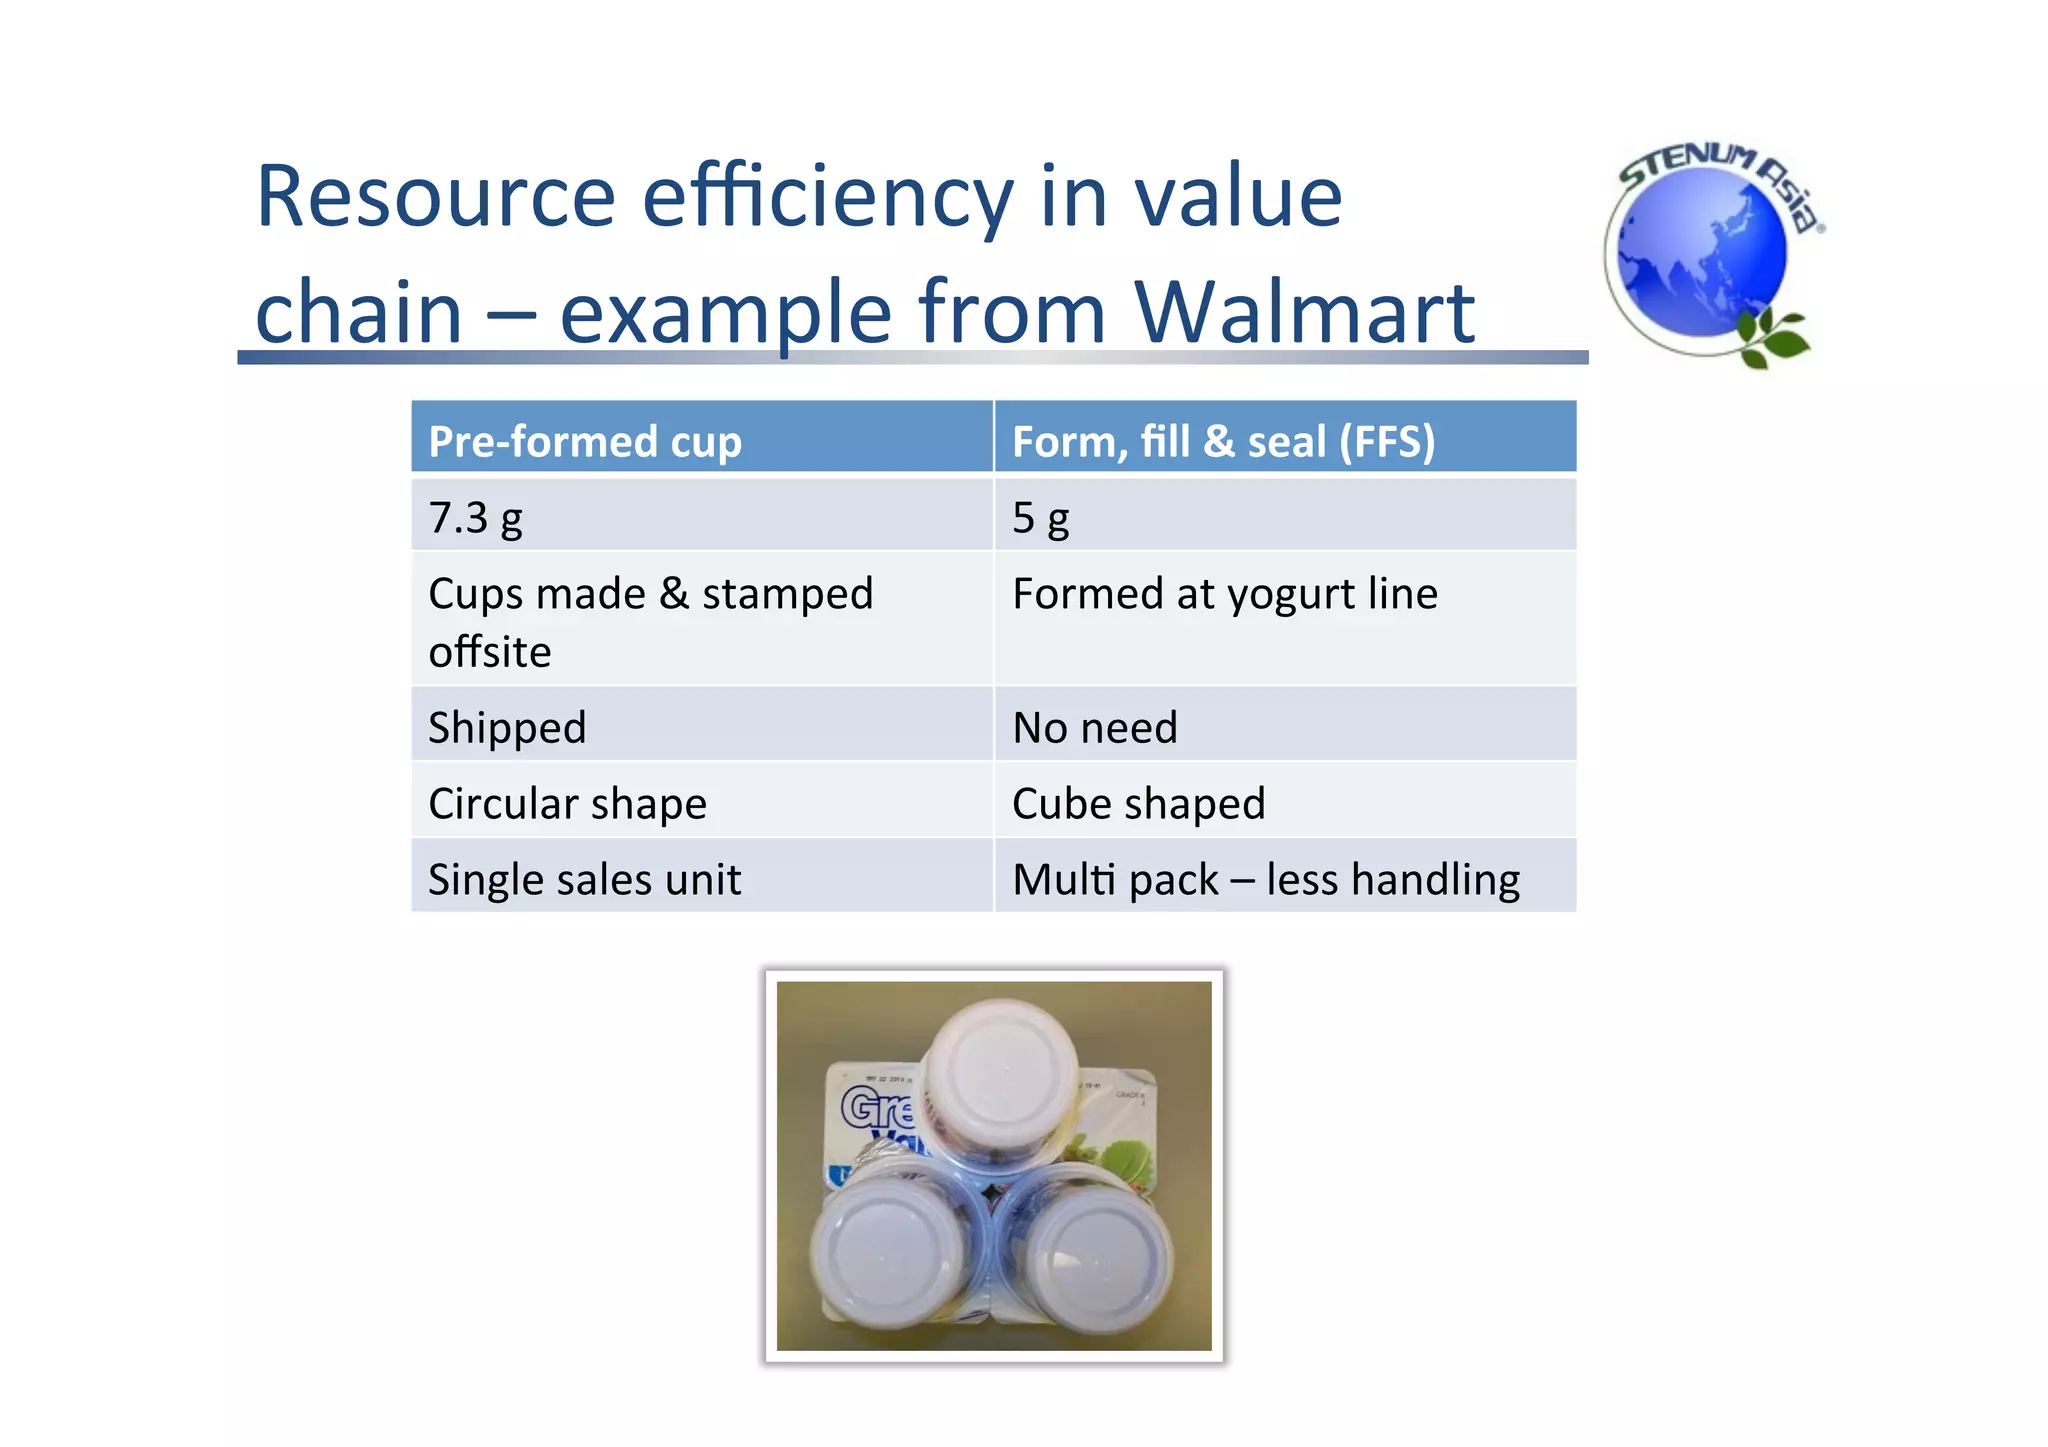
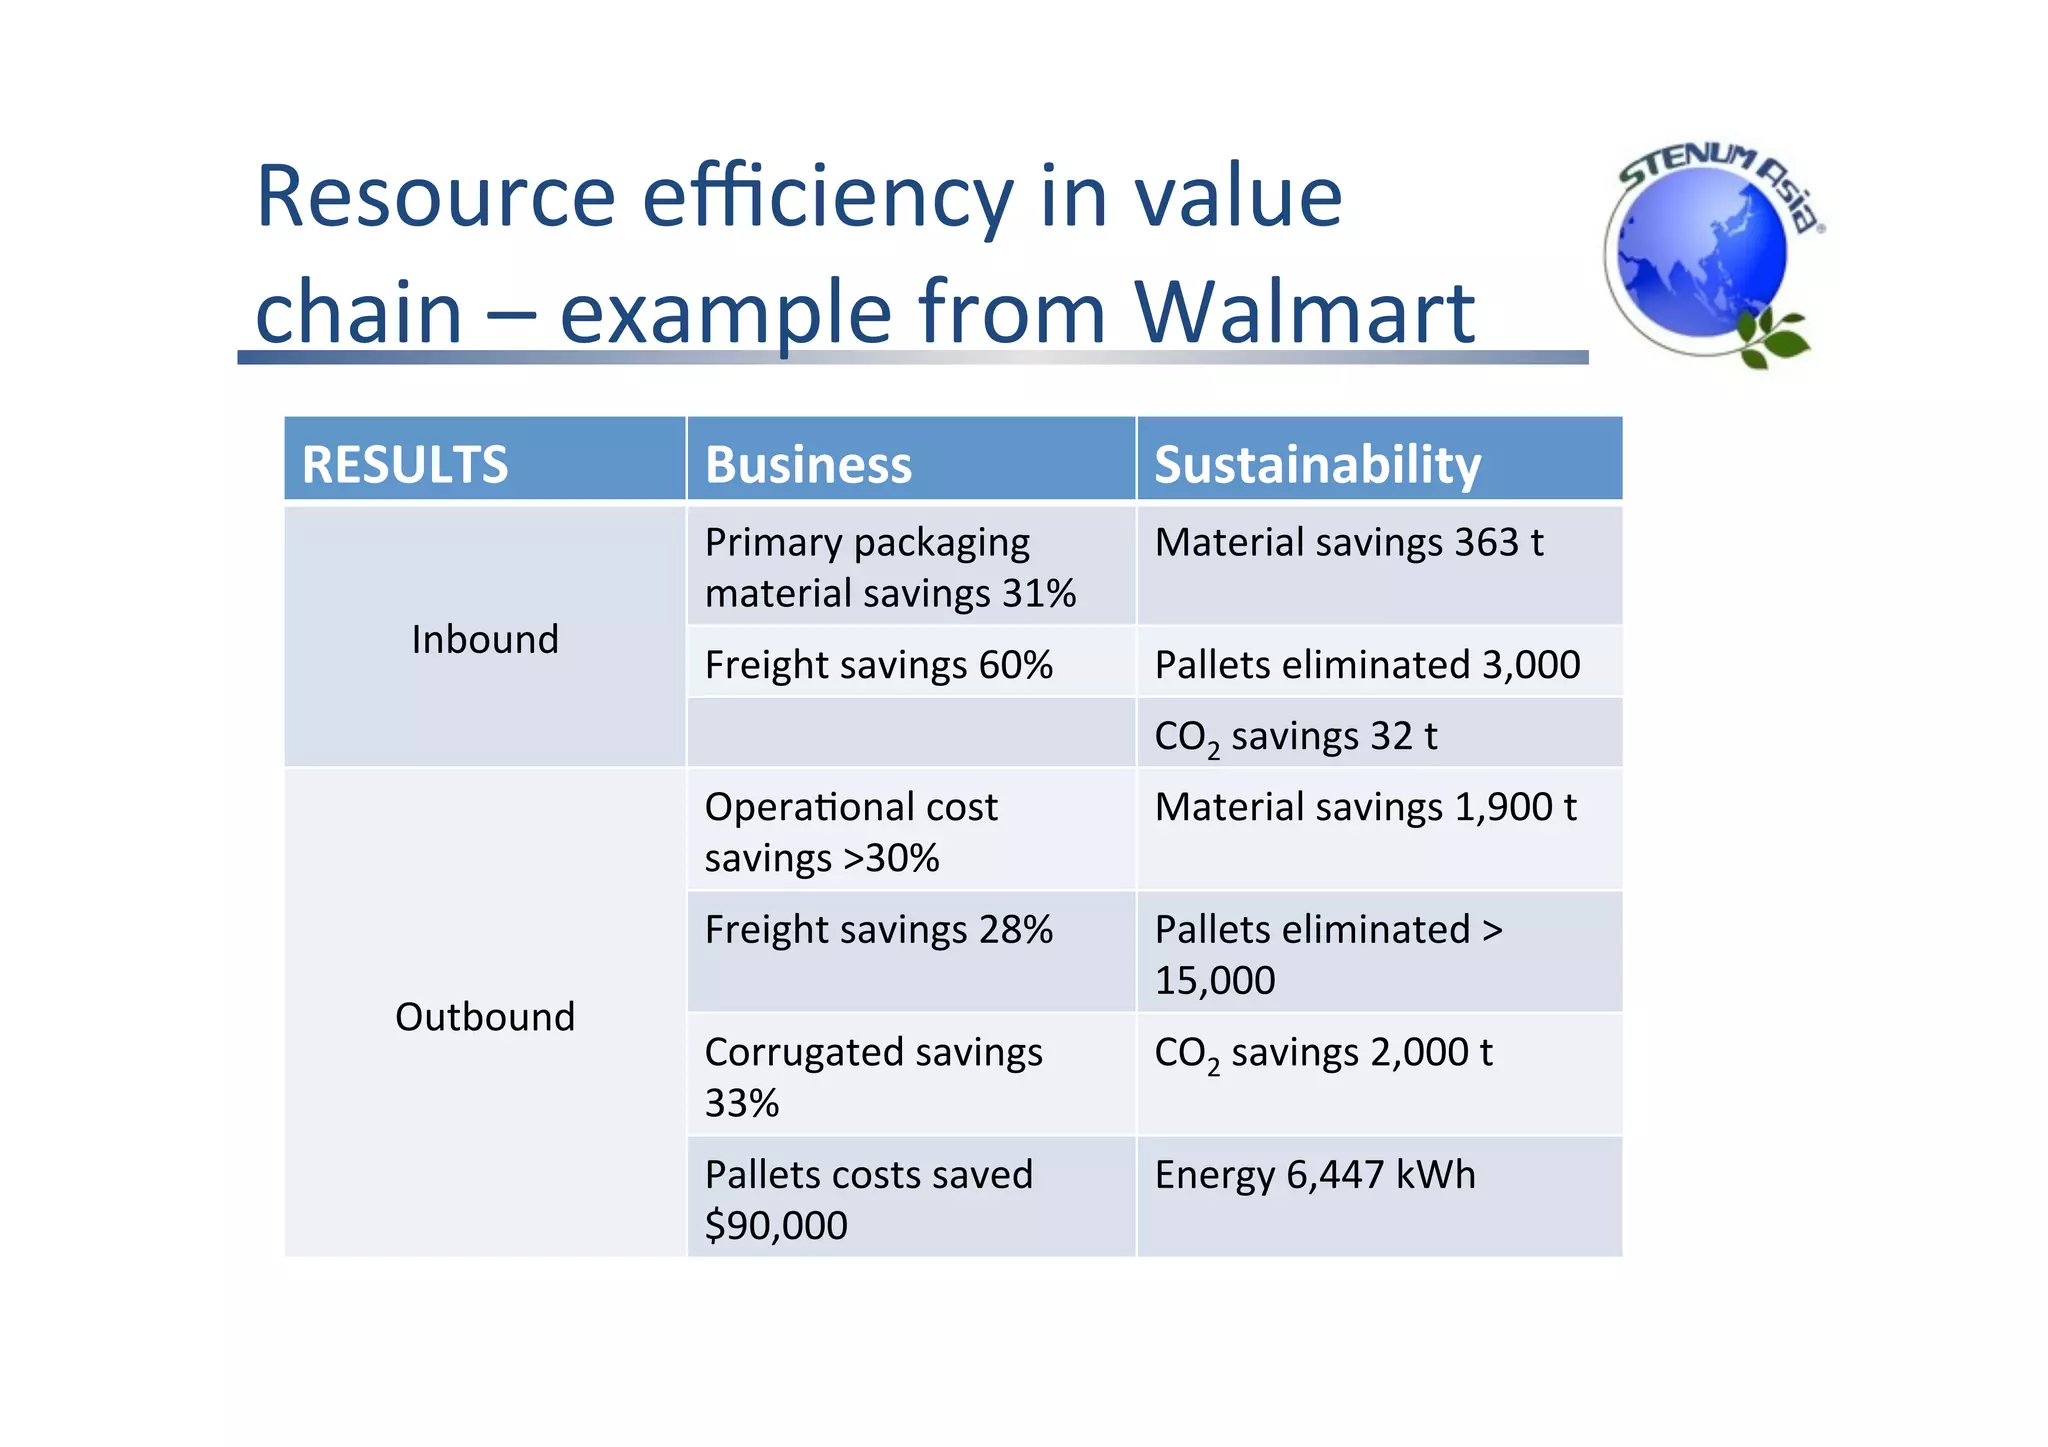


The document discusses the importance of integrating sustainable consumption and production (SCP) into business strategies, focusing on resource efficiency and waste minimization throughout the value chain. It highlights the benefits of sustainability, such as reduced carbon footprints, improved operational efficiencies, and enhanced brand loyalty, while also noting challenges like transactional supplier relationships and consumer price sensitivity. Examples from various companies illustrate successful SCP interventions and the measurable savings achieved in resource usage.


