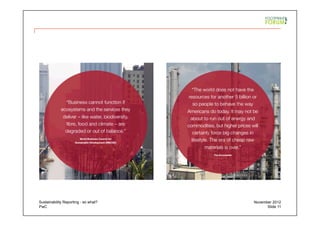
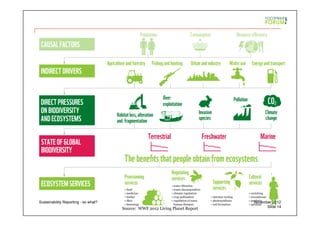
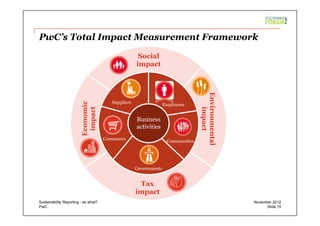
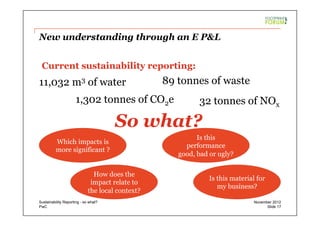
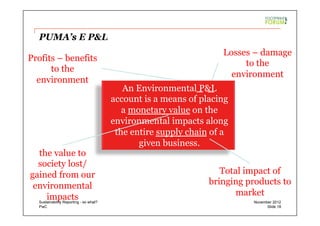
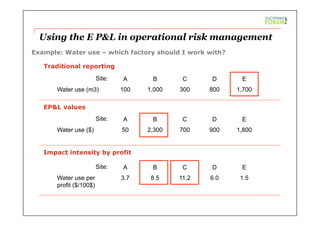
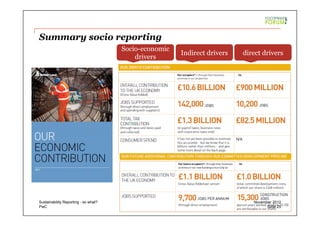
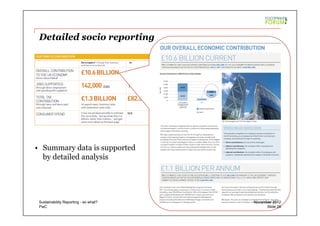
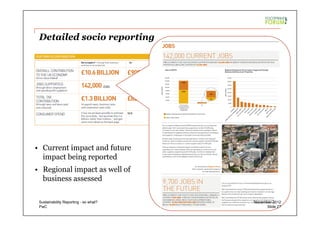
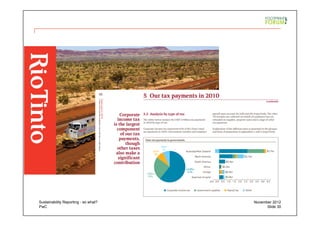
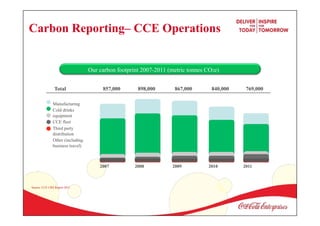
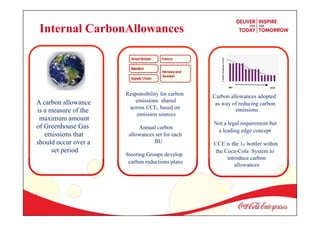
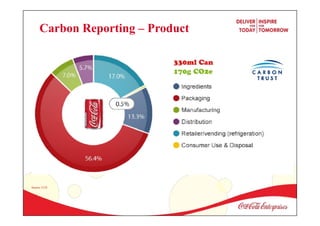
This document summarizes a presentation about sustainability reporting. It discusses why businesses should engage in sustainability reporting to protect and enhance value. Total impact reporting was presented as going beyond traditional reporting to measure environmental, social and economic impacts. Examples were given of companies like Puma and British Land conducting environmental profit and loss accounting and assessing wider socioeconomic impacts. The document emphasizes moving towards reporting on impacts and outcomes over outputs.
6. PwC
Sustainability reporting – so what?
• Why should businesses care about
sustainability reporting?
• Protecting and enhancing value
• Looking beyond traditional reporting
Slide 6
November 2012Sustainability Reporting - so what?
7. PwC Slide 7
November 2012Sustainability Reporting - so what?
Source: Footprint Network Annual Report 2011
8. PwC Slide 8
November 2012Sustainability Reporting - so what?
Source: Footprint Network Annual Report 2011
9. PwC
Rising business awareness of natural capital risk
1,000
500
250
100
50
Fiscal
crisis
Extreme
consumer price
volatility
Slowing Chinese
economy Corruption
Terrorism
Unlikely Likely Very likely
Regulatory
failures
Asset price
collapse
Geopolitical
conflict
Extreme energy
price volatility
Expectedimpact(BillionUSD)
Likelihood over next 10 years
Environmental risks
2009 2011
Climate
change
Flooding
Storms
and
cyclones
Air
pollution
Water
security
Biodiversity
loss
Economic and
geopolitical risks 2011
Source: World Economic Forum Global Risks Report (2009 – 2011)
Slide 9
November 2012Sustainability Reporting - so what?
10. PwC
Slide 10
November 2012Sustainability Reporting - so what?
17. PwC
Current sustainability reporting:
New understanding through an E P&L
11,032 m3 of water
1,302 tonnes of CO2e
89 tonnes of waste
32 tonnes of NOx
So what?
Which impacts is
more significant ?
Is this
performance
good, bad or ugly?
How does the
impact relate to
the local context?
Is this material for
my business?
Slide 17
November 2012Sustainability Reporting - so what?
18. PwC
Losses – damage
to the
environment
Profits – benefits
to the
environment
PUMA’s E P&L
An Environmental P&L
account is a means of placing
a monetary value on the
environmental impacts along
the entire supply chain of a
given business.
the value to
society lost/
gained from our
environmental
impacts
Total impact of
bringing products to
market
Slide 18
November 2012Sustainability Reporting - so what?
19. PwC
What impacts are covered?
GHG emissions Water consumption
Air pollutionLand use Waste
Slide 19
November 2012Sustainability Reporting - so what?
20. PwC
What impacts are covered?
Manufacturing: Apparel, shoes and accessories
Tier 1
Tier 3
Tier 2
Outsourcing: Embroiderers, printers, outsole
producers
Processing: Tanneries, chemical companies, oil
refiners
Raw materials: Cotton farming, cattle ranching, oil
drilling
Operation
s
Operations: Offices, shops, business travel,
warehouses, logistics
Slide 20
November 2012Sustainability Reporting - so what?
22. Climate
change
Example valuation methodology: Climate change
Impacts
Activity
Greenhouse
gases
Ecosystem
changes
Fuel use
Agriculture
Electricity
generation
Deforestation
Loss of
economic
productivity
Health impacts
23. Site: A B C D E
Water use (m3) 100 1,000 300 800 1,700
Traditional reporting
Site: A B C D E
Water use ($) 50 2,300 700 900 1,800
EP&L values
Site: A B C D E
Water use per
profit ($/100$)
3.7 8.5 11.2 6.0 1.5
Impact intensity by profit
Example: Water use – which factory should I work with?
Using the E P&L in operational risk management
24. PwC
Example: British Land’s wider socio-
economic impacts
Slide 24
November 2012Sustainability Reporting - so what?
26. PwC
Detailed socio reporting
Direct drivers
• Summary data is supported
by detailed analysis
Slide 26
November 2012Sustainability Reporting - so what?
27. PwC
Detailed socio reporting
Direct drivers
• Current impact and future
impact being reported
• Regional impact as well of
business assessed
Slide 27
November 2012Sustainability Reporting - so what?
28. PwC
Example: Rio Tinto Tax Reporting
Slide 28
November 2012Sustainability Reporting - so what?
31. PwC
And finally?
Is this the future of measurement &
reporting?
Slide 31
November 2012Sustainability Reporting - so what?
32. Will reporting IMPACTS be the next BIG thing?
In 2002, only 30 of the UK’s FTSE
100 companies had a standalone
CR report and only 7% engaged
with stakeholders.
Today, nearly 80% of the world’s
largest 250 companies report on
CR performance.
37. Coca-Cola Enterprises:
a local business
•
•
•
•
•
•
$8.3 billion revenue
30 billion servings annually to
170 million consumers
6 consecutive years of volume and
operating income growth
17 manufacturing facilities
13,250 employees
40+ brands
38. • Holistic approach – sustainability integrated
in core business
• Taking broad responsibility – up and down
the value chain
• Compelling vision – of sustainable future
• Strong Leadership and governance
• Provision of innovative solutions – to
global problems
• Leading edge aspirations – leaders aim
high and set targets that they may not know
how to achieve
• Transparency – honest communication
• Focusing on material issues – in areas of
expertise but must be best practice across all
areas
• Collaborating and networking
Stakeholder Roundtable
40. Our Commitment
Energy and Climate Change
We aim to reduce the average
carbon footprint across all of our
products, in all packaging
formats, by a third.
We will reduce the carbon footprint of the drink in your
hand by a third by delivering carbon reductions
throughout our entire value chain.
Asignificant stretch
requiring significant value
chain collaboration – we
don’t have all the answers
Six major elements – ingredients,
packaging, manufacturing,
transportation, refrigeration and
recycling.
We aim to deliver carbon
reductions while growing
our business
43. Our carbon footprint 2007-2011 (metric tonnes CO2e)
Manufacturing
Cold drinks
equipment
CCE fleet
Third party
distribution
Other (including
business travel)
Total 857,000 898,000 867,000 840,000 769,000
2007 2008 2009 2010 2011
Carbon Reporting– CCE Operations
Source: CCE CRS Report 2011
44. CarbonFootprintCO2et
A carbon allowance
is a measure of the
maximum amount
of Greenhouse Gas
emissions that
should occur over a
set period
Responsibility for carbon
emissions shared
across CCE, based on
emission sources
Annual carbon
allowances set for each
BU
Steering Groups develop
carbon reductions plans
2007 2020
Carbon allowances adopted
as way of reducing carbon
emissions
Not a legal requirement but
a leading edge concept
CCE is the 1st bottler within
the Coca-Cola System to
introduce carbon
allowances
Internal CarbonAllowances
48. Supplier Engagement
• Sustainability – key part of our supplier
rela3onships
• Supplier Scorecard -‐ 25% on sustainability
• Annual Supplier Sustainability Summit
• Annual ‘CRS
Supplier
of
the
Year’
Award
• Carbon Reduc3on challenge issued to
suppliers
• New partnership with EcoVadis
49. A system of Microsoft Excel-based tools and
databases to assess actual and forecast
performance against the overall 1/3 commitment
plus the underlying sub-commitments of CCE’s
Sustainability Plan.
Carbon Reporting – Value Chain Tool
Modelling for all
elements of the
Value Chain
51. Four key elements:
• Protect our water sources
• Reduce our use of water
• Recycle 100% of our waste water.
• Replenish the water used in our beverages,
where sourced from areas of water stress.
We will look at where our use of water
has the greatest impact across our
value chain, work with our suppliers to
minimize impacts and ensure that the
sugar we use is sustainable.
Our commitment
Water Stewardship
We want to lead the beverage industry in
water efficiency and manufacture 1 liter
of product with 1.2 liters water by 2020.
We will set the standard for water efficiency, establish a
water sustainable operation and minimize water impacts
throughout our entire value chain.
56. • Adopt a value chain approach
• Understand the data
• Keep track of methodologies
• Set stretch commitments
o Align with stakeholder expectations
• Transparency is key – it is ok not to know
all the answers!
Conclusions
57. Follow us on our journey
www.cokecce.com
www.facebook.com/CokeCCE
@CokeCCE, @JoeFranses
@LucindaHensman