
Recommended
Recommended
More Related Content
What's hot
What's hot (19)
Similar to Sustainability Assessment in Buildings-A new tool
Similar to Sustainability Assessment in Buildings-A new tool (20)
More from sabnisajit
Recently uploaded
Recently uploaded (20)
Sustainability Assessment in Buildings-A new tool
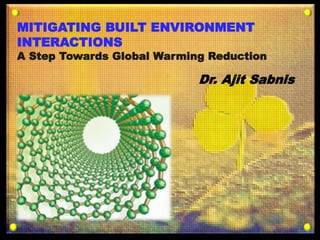
- 1. 1 MITIGATING BUILT ENVIRONMENT INTERACTIONS A Step Towards Global Warming Reduction Dr. Ajit Sabnis
- 2. 2 What is Built Environment The term Built Environment refers to the human-made surroundings that provide the setting for human activity, ranging in scale from buildings to parks to infrastructure projects. It has been defined as "the human- made space in which people live, work, Commute and recreate on a day-to-day basis." ANTHROPOGENIC ACTIVITIES
- 3. 3 BEINTERACTIONS Construction Materials Embodied Energy Greenhouse Gasses I1 I2I3 I I = I1 + I2 + I3 Synergy Effect
- 4. 4 ZC = Figure of Merit as defined in Equation 1; EEC = Embodied Energy Coefficient = EE / EE (stone) ECC = Embodied Carbon Coefficient = ECe / ECe (stone) TEC = Transport Energy Coefficient = 0.00285 / EE µ = Time Coefficient = EEC x (Design Period / GWP Period) INTERACTION EQUATIONS ZC = E/ρ x Cm x 1/Ca SDI = I1 + I2 + I3 I1= √ (ZC x EEC x TEC) I2= √ (ZC x ECC x TEC x µ) I3= √ (ZC x EEC x ECC x TEC)
- 6. BUILT ENVIRONMENT Land use patterns Transportation Infrastructure Building siting and design Human Health and the Natural Environment Ecosystems, Habitat, and Endangered species Water quality , Air quality Global Climate Physical activity, Emotional Health Community Engagement Life Safety MOBILITY BEHAVIOUR Migration, Search for better living DIRECT EFFECTS INDIRECT EFFECTS
- 7. 7 Built Environment RESPONSIBLE FOR GHG EMISSIONS AND CONTRIBUTES TO GLOBAL WARMING INDISCRIMINATE USE OF NATURAL MATERIALS IN CONSTRUCTION RESULTING IN RESOURCE DEPLETION ENTIRE CONSTRUCTION PROCESS IS ENERGY INTENSIVE RESULTING IN CARBON SPIKE PHENOMENON. ENGINEERSPERSPECTIVE
- 9. 9
- 10. 10 KEELINGCURVE CO2 Concentration 400 ppm in 2015
- 11. 11 Fossil Fuel Depletion Ozone Depletion Smog Formation Acidification Eutrophication Deforestation EFFECTS OF GLOBAL WARMING Soil Erosion Habitat Alteration Loss of Bio-Diversity Water Depletion Ecological Toxicity Human Health
- 12. 12 Sustainable Development of a Society we inhabit has to be firmly founded upon five fundamental principal pillars -Economic, Social, Cultural, Environmental and Spiritual. SOCIAL CULTURAL ECONOMIC ENVIRONMENTAL ETHICAL
- 13. 13 Sustainable development The Conflict ! Development which meets the needs of current generations without compromising the ability of future generations to meet their own needs - World Commission on Environment and Development INTEGRATION ROLE OF ENGINEERS AND TECHNOLOGISTS
- 14. Rio, Brazil, 1992 Kyoto, Japan, 1997. Morocco, 2001 Paris, France, 2015
- 15. 15 SUSTAINABILITY DEVELOPMENT GOALS SDG – 17 NOS.
- 16. 16
- 17. 17 GLOBAL PICTURE The construction sector poses a major challenge to the environment. Globally, buildings are responsible for at least 40% of energy use. An estimated 42% of the global water consumption and 50% of the global consumption of raw materials is consumed by buildings. An estimated 50% of the world’s air pollution, 42% of its greenhouse gases, 50% of all water pollution, 48% of all solid wastes and 50% of all CFCs are due to Built Environment.
- 18. 18 GLOBAL PICTURE Cumulative CO2 emission since 1751 till 2014 ; USA - 3,75,000 Million Tonnes CHINA - 1,75,000 Million Tonnes INDIA - 40,000 Million Tonnes Per Capita CO2 emission per Year ; USA - 16.91 Tonnes CHINA - 7.36 Tonnes INDIA - 1.84 Tonnes Even in extreme Poverty condition, per capita energy consumption is; USA - 59,000 kWh / Year CHINA - 25,750 kWh / Year INDIA - 7,000 kWh / Year
- 19. 19 INDIA CO2 6.5% Construction Industry contribution 40 % OPERATIVRE PHASE 75 to 80 % PRE USE AND OTHER PHASES 20 TO 25 % EXTENSIVE STUDY DONE ON THIS PHASE NEGLECTED PHASE - NEED OUR FOCUS
- 20. 20 Carbon Spike – Pre use Phase
- 21. 21
- 22. 22 SUSTAINABILITY APPLIED BROWN DEVELOPMENT GREEN DEVELOPMENT EXISTING INFRASTRUCTURE NEW INFRASTRUCTURE RETROFITTING STRATEGIC PLANNING Expensive – Long Term Benefits – Has Limitations Sustainability Can be Achieved from Conceptual Stage
- 23. 23 Mitigation Strategies RESPONSE TO GW /CC 1st: ADAPTATION – ADAPT TO CHANGES WITHOUT INTERVENING IN THE CC PROCESS (Frog in a Pan attitude) 2nd: MITIGATION– HUMAN EFFORTS TO REDUCE GW RESTRICT TEMPRATURE RISE TO 2 DEG C
- 24. 24 DECARBONISATION Energy Efficiency Low Carbon Power Fuel Switching REDUCE FOSSIL FUEL BURNING INCREASE CARBON SINKS REDUCE DEFORESTATION CONTROL POPULATION AND URBAN MIGRATION
- 25. 25 DE-CARBONIZATION HOW? IMPROVE ENERGY EFFICIENCY ADOPT CLEAN ENERGY ADOPT SUSTAINABLE & SMART CONSTRUCTION SHIFT TO CLEAN ENERGY RE-ENGINEER HIGH ENERGY MATERIALS TO BE A PART OF LOW CARBON ECONOMY INCREASE RECYCLABILITY MANAGE WASTE SMARTLY USE ALTERNATIVE AND LOCAL MATERIALS SEAMLESS INTEGRATION WITH NATURE
- 26. 26 TRENDS OF THE FUTURE ZERO &LOW ENERGY BUILDINGS PRECAST / PEB / MONOLITHIC / MODULAR HIGH-RISE BUILDINGS BUILDINGS WITH AUTOMATION PASSIVE ARCHITECTURE ERGONOMICALLY DESIGNED BUILDINGS
- 27. 27 WHERE WE BUILD Safeguarding sensitive areas such as buffers and wetlands Safeguarding critical habitats New development – Scientifically reclaimed areas Preserve green space avoiding habitat fragmentation Putting homes, workplaces, and services close to each other in convenient, accessible locations.
- 28. 28 HOW WE BUILD Developing compact designs to preserve open spaces Preserving water quality Mixing functions to reduce travel distances Designing communities and streets to promote walking and biking Improving building design, construction, and materials selection to use natural resources more efficiently and improve buildings’ environmental performance.
- 29. 29 SUSTAINABILITY ASSESSMENT 1. LIFE CYCLE ENERGY ANALYSIS EMBODIED ENERGY EMBODIED CARBON 2. SUSTAINABILITY DEVELOPMENT INDICES SEVERAL ECO-INDICATORS 3. GREEN RATING SYSTEMS - CRITERIA BASED 4. FOM BASED SDI – SUSTAINABILITY LEVELS IN % CONCEPTUAL STAGE.
- 30. 30 Green Building Rating Systems Most Green Building Rating systems available today are criteria and voluntary based. Whole building process are categorized into several criteria and credited with points – Normalizing them into Star Ratings or other nomenclature. They are good to streamline the processes but do not accurately measure the impact of BE on NE. Material Properties play key role in establishing structural stability, durability and longitivity. Present rating systems do not integrate material properties in the assessment process. This limitation calls for development of a New Sustainability Indicator.
- 31. 31 1. SYNERGIC EFFECT IS NOT TAKEN INTO ACCOUNT. 2. LCA HAS ITS OWN LIMITATIONS. 3. COST STIMULANTS AND ENGINEERING PROPERTIES OF MATERIALS ARE NOT TAKEN INTO ACCOUNT WHILE ASSESSING THE IMPACT OF BUILT ENVIRONMENT. 4. SUSTAINABILITY EVALUATION IS CURRENTLY FOCUSSING ON OPERATIVE AND MAINTENANCE PHASES OF LIFE CYCLE OF A BUILDING NEGLECTING PRE-USE PHASE. 5. SMALLER FOOTPRINT BUILDINGS AS CASE STUDY PROJECTS. PRESENT ASSESSMENT LIMITATIONS
- 32. 32 RESIDENTIAL - 18 FLOORS – RCC FRAME TOTAL AREA - 25076 sqm WALLS – SOLID CONCRETE BLOCKS FLOORING – IN COMBINATION JOINERY – WOOD AND UPVC FORMWORK - CONVENTIONAL WATER PROOFING – CRYSTALLINE METHOD ILLUSTRATIVE URBAN PROJECT ( Real Time Data )
- 33. 33 Computation of Total Embodied Energy (EE) per Square meter (Tot. Area=25076 sqm) Total Qty EE Total EE Kgs MJ / kg MJ Reinforced Concrete Cum 10800.00 0.43 1033.66 1.96 2025.97 Plain Concrete Cum 1215.00 0.05 116.29 1.96 227.92 VDF Concrete 100 mm th Cum 2510.00 0.10 240.23 1.96 470.85 Reinforcement (Fe 500) MT 986.00 0.04 39.32 21.60 849.32 Concrete Block Masonry Cum 4276.00 0.17 306.94 0.59 181.09 Plaster(CM 1:6) Cum 1179.00 0.05 82.75 1.80 148.95 Wooden Doors Cum 103.00 0.00 3.49 10.40 36.31 UPVC Windows / Doors Sqm 2810.00 0.11 1600.00 179.29 Ceramic tiling Cum 118.00 0.00 9.41 10.00 94.11 Granite Tiling Cum 22.00 0.00 2.53 11.00 27.79 Natural Slate stone Cum 178.00 0.01 17.75 2.00 35.49 Steel Works MT 210.00 0.01 10 27.10 271.00 Painting works(3 coats) Sqm 68710.00 2.74 14.32 39.24 Formwork Conventional Sqm 65198.00 2.60 229.00 595.40 Membrane Water proofing Sqm 5219.00 0.21 14.32 2.98 5185.73 PRIMARY PARAMETERS For following items EE is in MJ / m2 Unit Qty Qty Per m2
- 34. 34 Embodied Energy Distribution Primary Parameters
- 35. 35 Computation of Total Embodied Carbon (ECe) per Square meter (Tot. Area=25076 sqm) Total Qty EC TOT ECe kgs CO2e/ kg kg CO2e Reinforced Concrete Cum 10800.00 0.43 1033.66 0.205 211.90 Plain Concrete Cum 1215.00 0.05 116.29 0.205 23.84 VDF Concrete 100 mm th Cum 2510.00 0.10 240.23 0.205 49.25 Reinforcement (Fe 500) MT 986.00 0.04 39.32 1.860 73.14 Concrete Block Masonry Cum 4276.00 0.17 306.94 0.063 19.34 Plaster(CM 1:6) Cum 1179.00 0.05 82.75 0.130 10.76 Wooden Doors Cum 103.00 0.00 3.49 0.870 3.04 UPVC Windows / Doors Sqm 2810.00 0.11 87.00 9.75 Ceramic tiling Cum 118.00 0.00 9.41 0.700 6.59 Granite Tiling Cum 22.00 0.00 2.53 0.700 1.77 Natural Slate stone Cum 178.00 0.01 17.75 0.13 2.31 Steel Works MT 210.00 0.01 10 2.030 20.30 Painting works(3 coats) Sqm 68710.00 2.74 1.31 3.59 Formwork Conventional Sqm 65198.00 2.60 18.43 47.92 Membrane Water proofing Sqm 5219.00 0.21 1.31 0.27 483.75 PRIMARYPARAMETERS Unit Qty Qty / m2 For following items EC is in kgCO2e / m2
- 36. 36 Embodied Carbon Distribution Primary Parameters
- 37. 37 By using low energy alternative materials and construction methodologies, it is possible to reduce the impact due to energy consumption and GHG emissions, by about 30-40% Impact assessment using LCA has its own limitations due to non-inclusion of certain upstream activities within system boundaries. As a result of this, the assessment suffers from Truncation error as high as 50%.
- 38. 38 Sustainability Development Index (SDI) based on Figure of Merit (FoM) Is a new concept in evaluation methodology. Applicable to all infrastructure projects and buildings even at conceptual stage. SDI developed is expressed in terms Sustainability Percentage.
- 39. 39 Figure of Merit (FoM) & Applications In engineering designs- FoM is applied to find out material suitability, Compare utility, applicability and design options. In commercial domain- FoM helps end users to decide upon the dependability of a particular brand. In risk assessment- FoM helps in decision making in respect of a type of risk mitigation measure to be adopted.
- 40. 40 FoM is a non-dimensional number derived using two critical engineering characteristics- modulus of elasticity and density and two cost stimulants-construction cost per unit area and unit cost of materials. FoM values are graphically represented to determine the sustainability quadrant and sustainability ranges within which materials fall by plotting FoM against other critical material parameters. FOM AS SUSTAINABILITY DEVELOPMENT INDEX
- 41. 41 FOM - EE ACCEPTABILITY CRITERIA FOR CERAMICS
- 42. 42 FOM RANGE VALUES FOR METALS
- 43. Sustainability Development Index (SDI) Values ILLUSTRATIVEPROJECT
- 45. 45 SDI % FOR ILLUSTRATIVE BENCHMARK PROJECT MEAN SDI of (I1+I2+I3) = 13414
- 46. BENCHMARKING : BASELINE VALUES - EE 3.52 GJ / m2
- 47. Primary Parameters kg CO2e Concrete 180.73 Steel 60.99 Block masonry 22.77 Plastering and Mortar 3.2 Doors Wooden 5.09 Windows Wood 8.23 Flooring 12.25 Painting 0.74 Formwork 20.72 Water Proofing 1.31 316.03 Primary Parameters- ECe/m2 ESTABLISHED EC BASELINE VALUE 316 kgCO2 / m2 Baseline Values GHG Performance
- 48. EE / m2 EC / m2 SDI% / m2 GJ kgCO2e (I1+I2+I3) Benchmark Project(BMP) 3.5 316.0 13414 Illustrative Project(IP) 5.2 486.8 23635 Projects EE, EC and Interaction Values IP vs. BMP 67% 65% 57%
- 49. SUSTAINABILITY COMPARISON (%) CLUSTER PROJECTS
- 50. 50 Sustainability Range Values Residential Buildings
- 51. 51 EE - SUSTAINABILITY RANGE CLUSTER OF PROJECTS URBAN SCENARIO NS- NO SUSTAINABILITY MS-MODERATE SUSTAINABILITY HS- HIGH SUSTAINABILITY LS- LOW SUSTAINABILITY
- 52. 52 Ec - SUSTAINABILITY RANGE CLUSTER OF PROJECTS URBAN SCENARIO
- 53. 53 SDI - SUSTAINABILITY RANGE CLUSTER OF PROJECTS URBAN SCENARIO
- 54. 54 The main challenges to sustainable development which are global in character include, poverty exclusion, unemployment, climate change, conflict and humanitarian aid, building peaceful and inclusive societies, building strong institutions of governance, and supporting the rule of law.
- 56. 56 SUSTAINABLE DESIGN : Sustainable urbanisation calls for concepts and designs with reduced usage of natural materials, importance to locally available materials and resources, without disturbing the ecological balance, minimizing the impact of buildings on environment and providing necessary conditions for human comfort and health. AND To achieve this, sustainability assessment at conceptual stage becomes evident.
- 57. 57 THANK YOU Dr. Ajit Sabnis ajitsabnis57@gmail.com
Editor's Notes
- 1
- 2
- 3
- 5
- 6
- 7
- 14
- 15
- 23
- 27
- Sustainable Urbanisation calls for concepts and designs where human comfort is achieved by adopting: Construction materials that are sensitive to the environment Reduce-Recycle-reuse Principle Building orientation to utilize maximum natural light and ventilation Energy efficient strategies to reduce energy consumption Building automation for energy optimization Reduced maintenance and wastage Appropriate construction technologies and methodologies Efficient MEP services Green roof tops, larger unpaved areas to reduce urban heat island effect Use of clean energy options Low operating costs Accessibility to basic needs Water harvesting ETC.
- 57