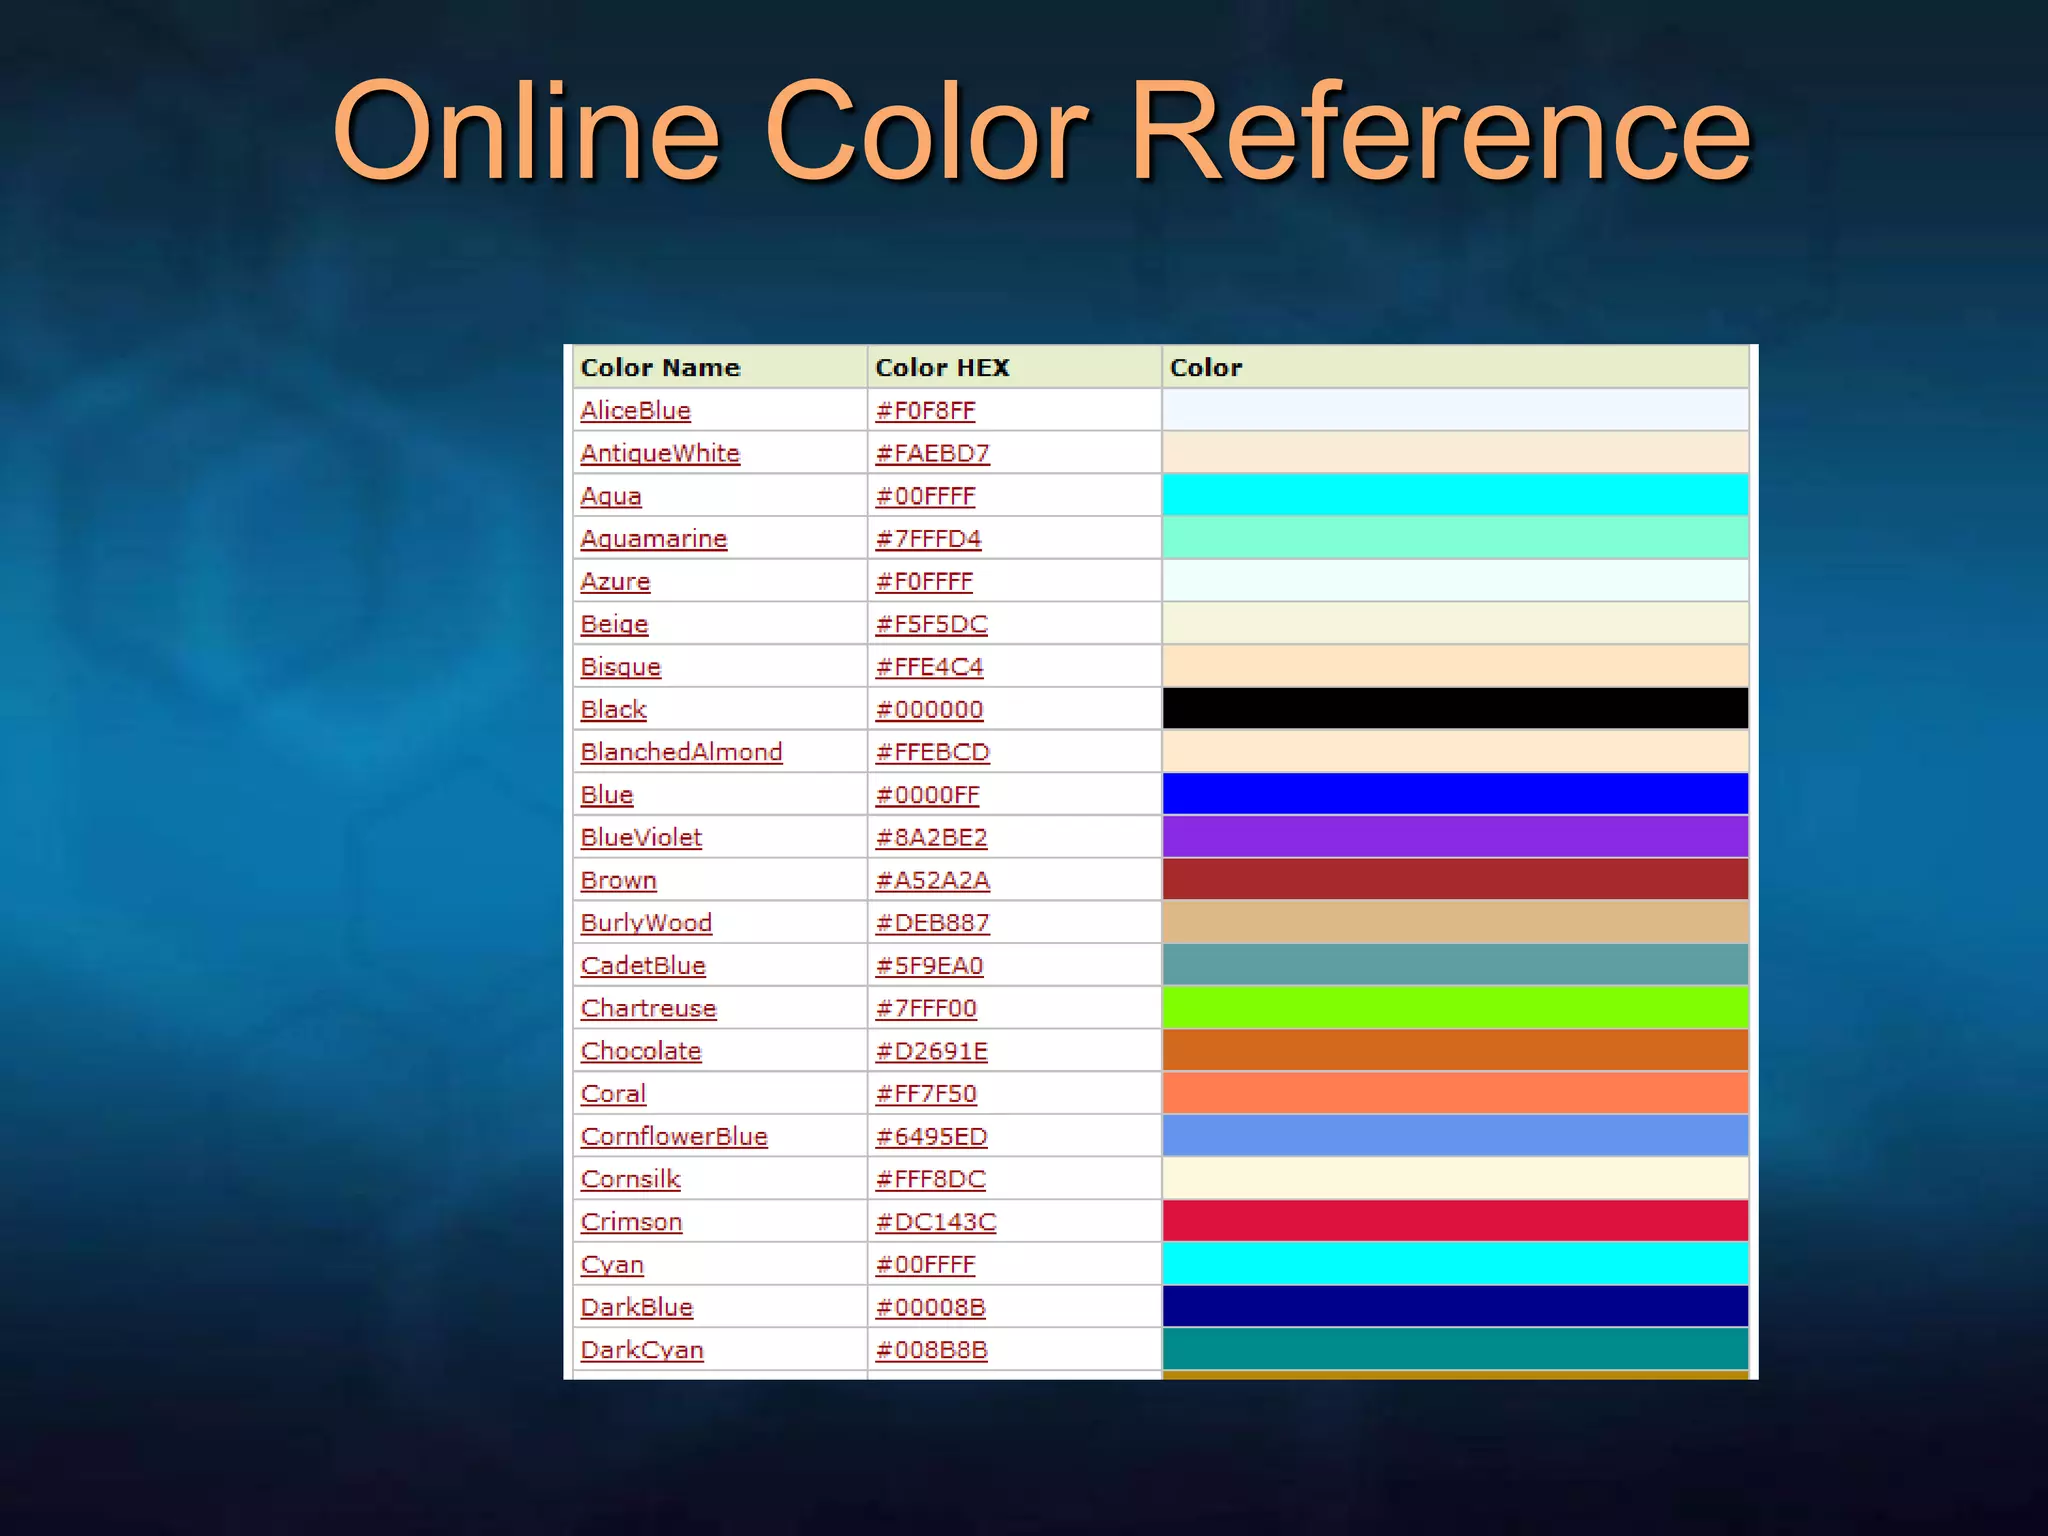
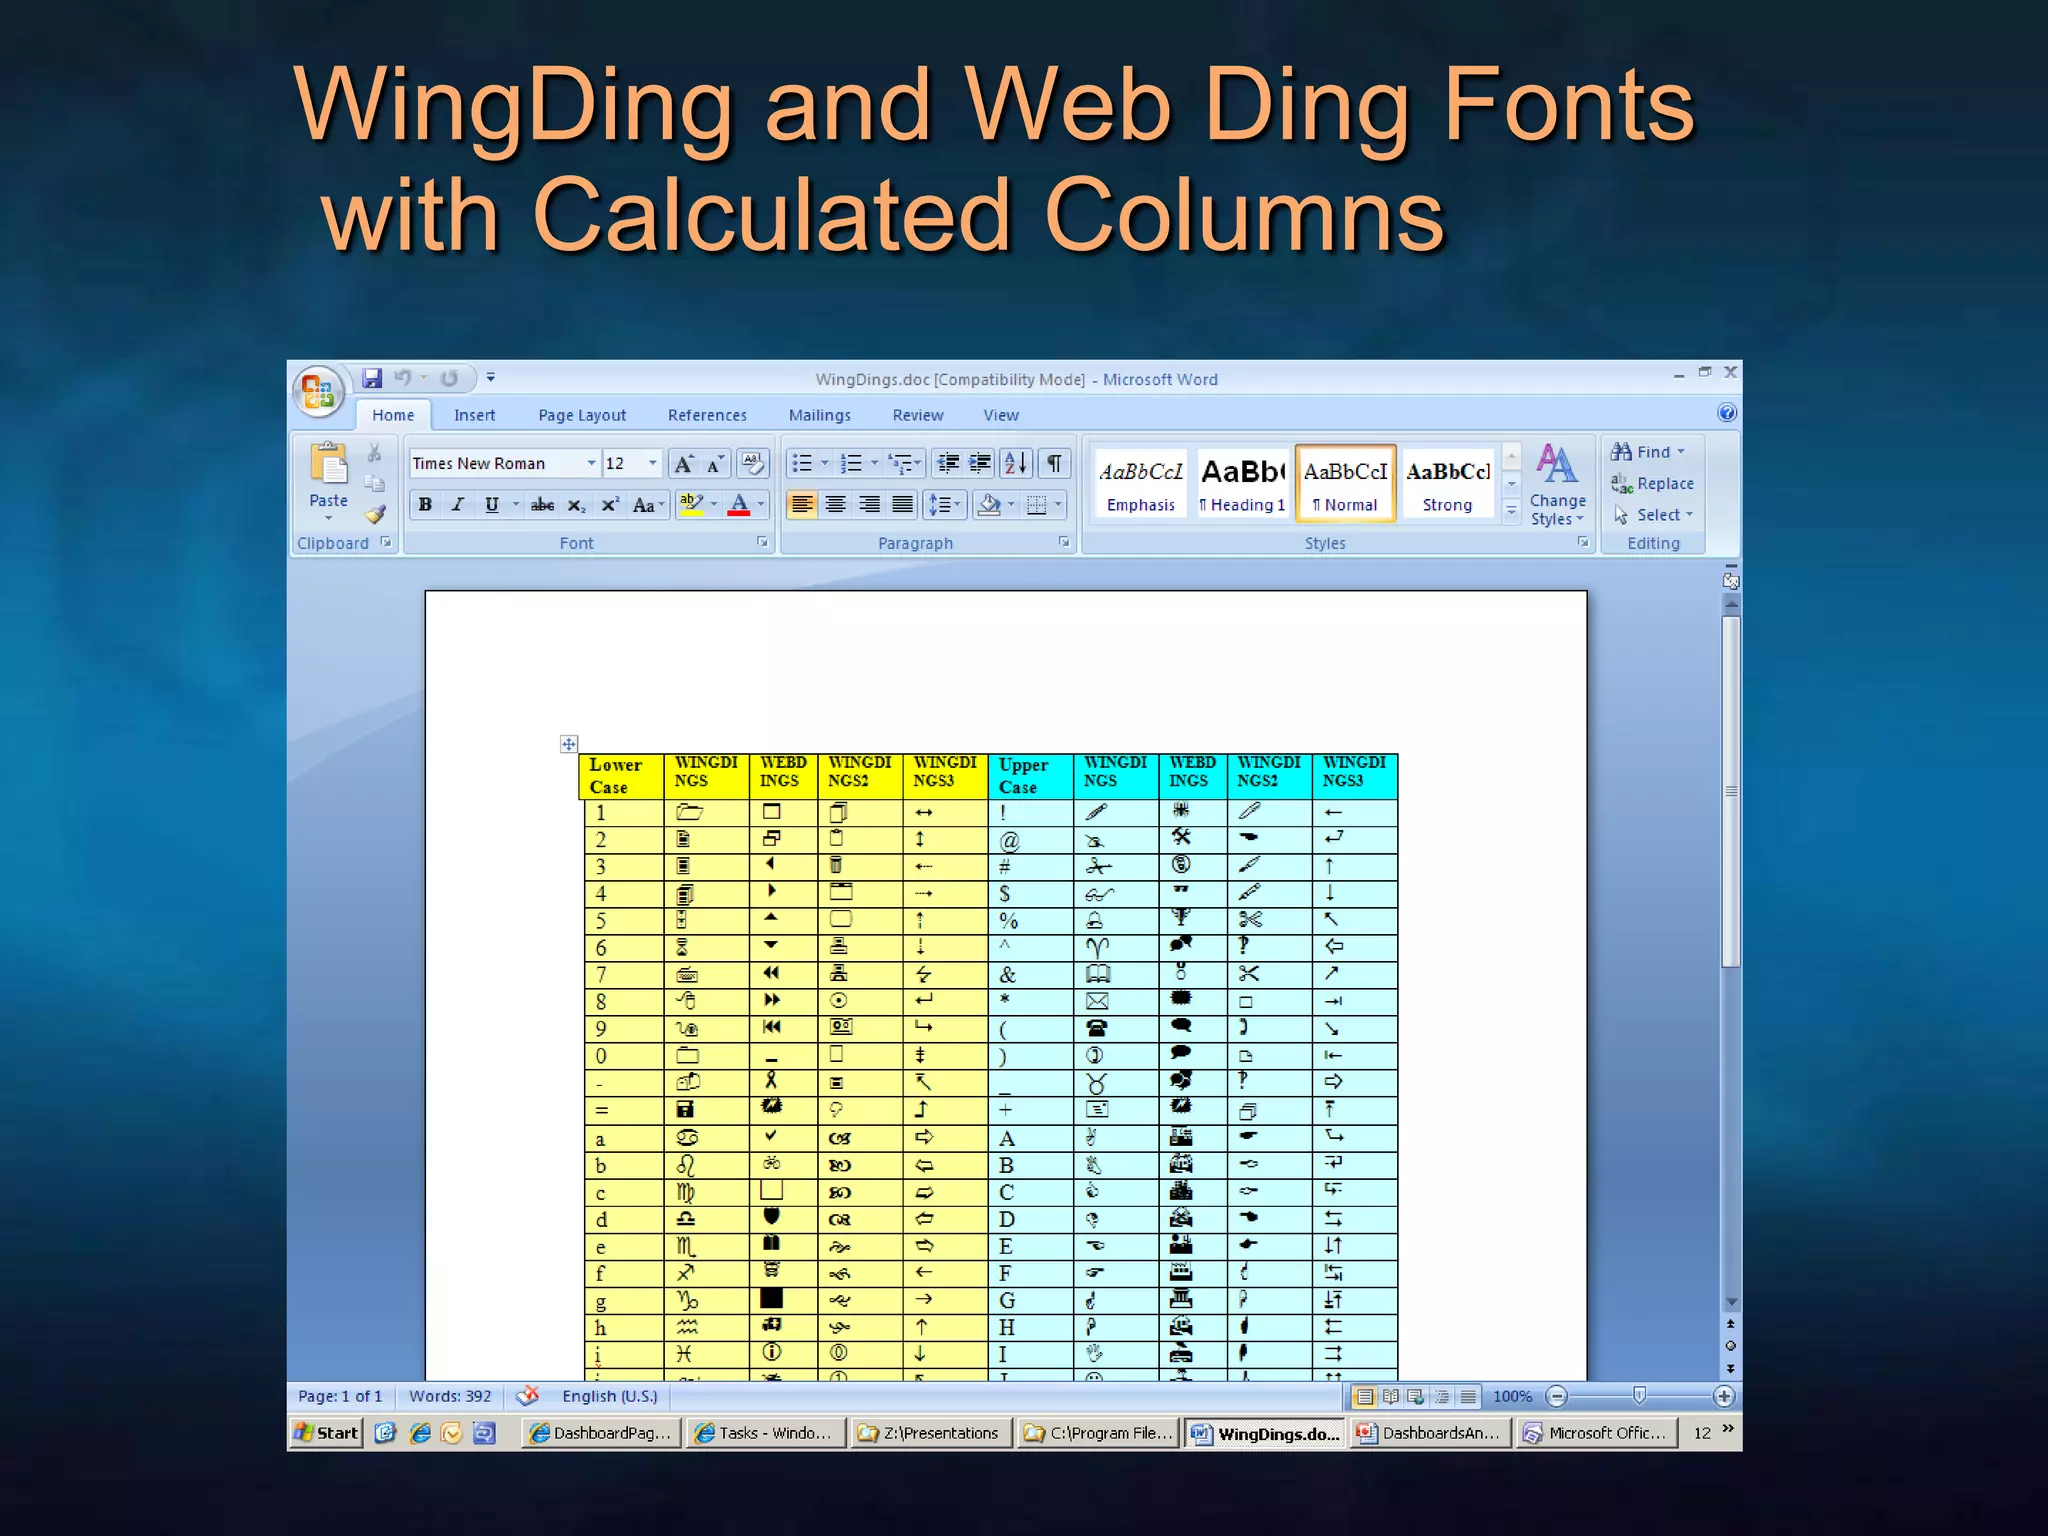
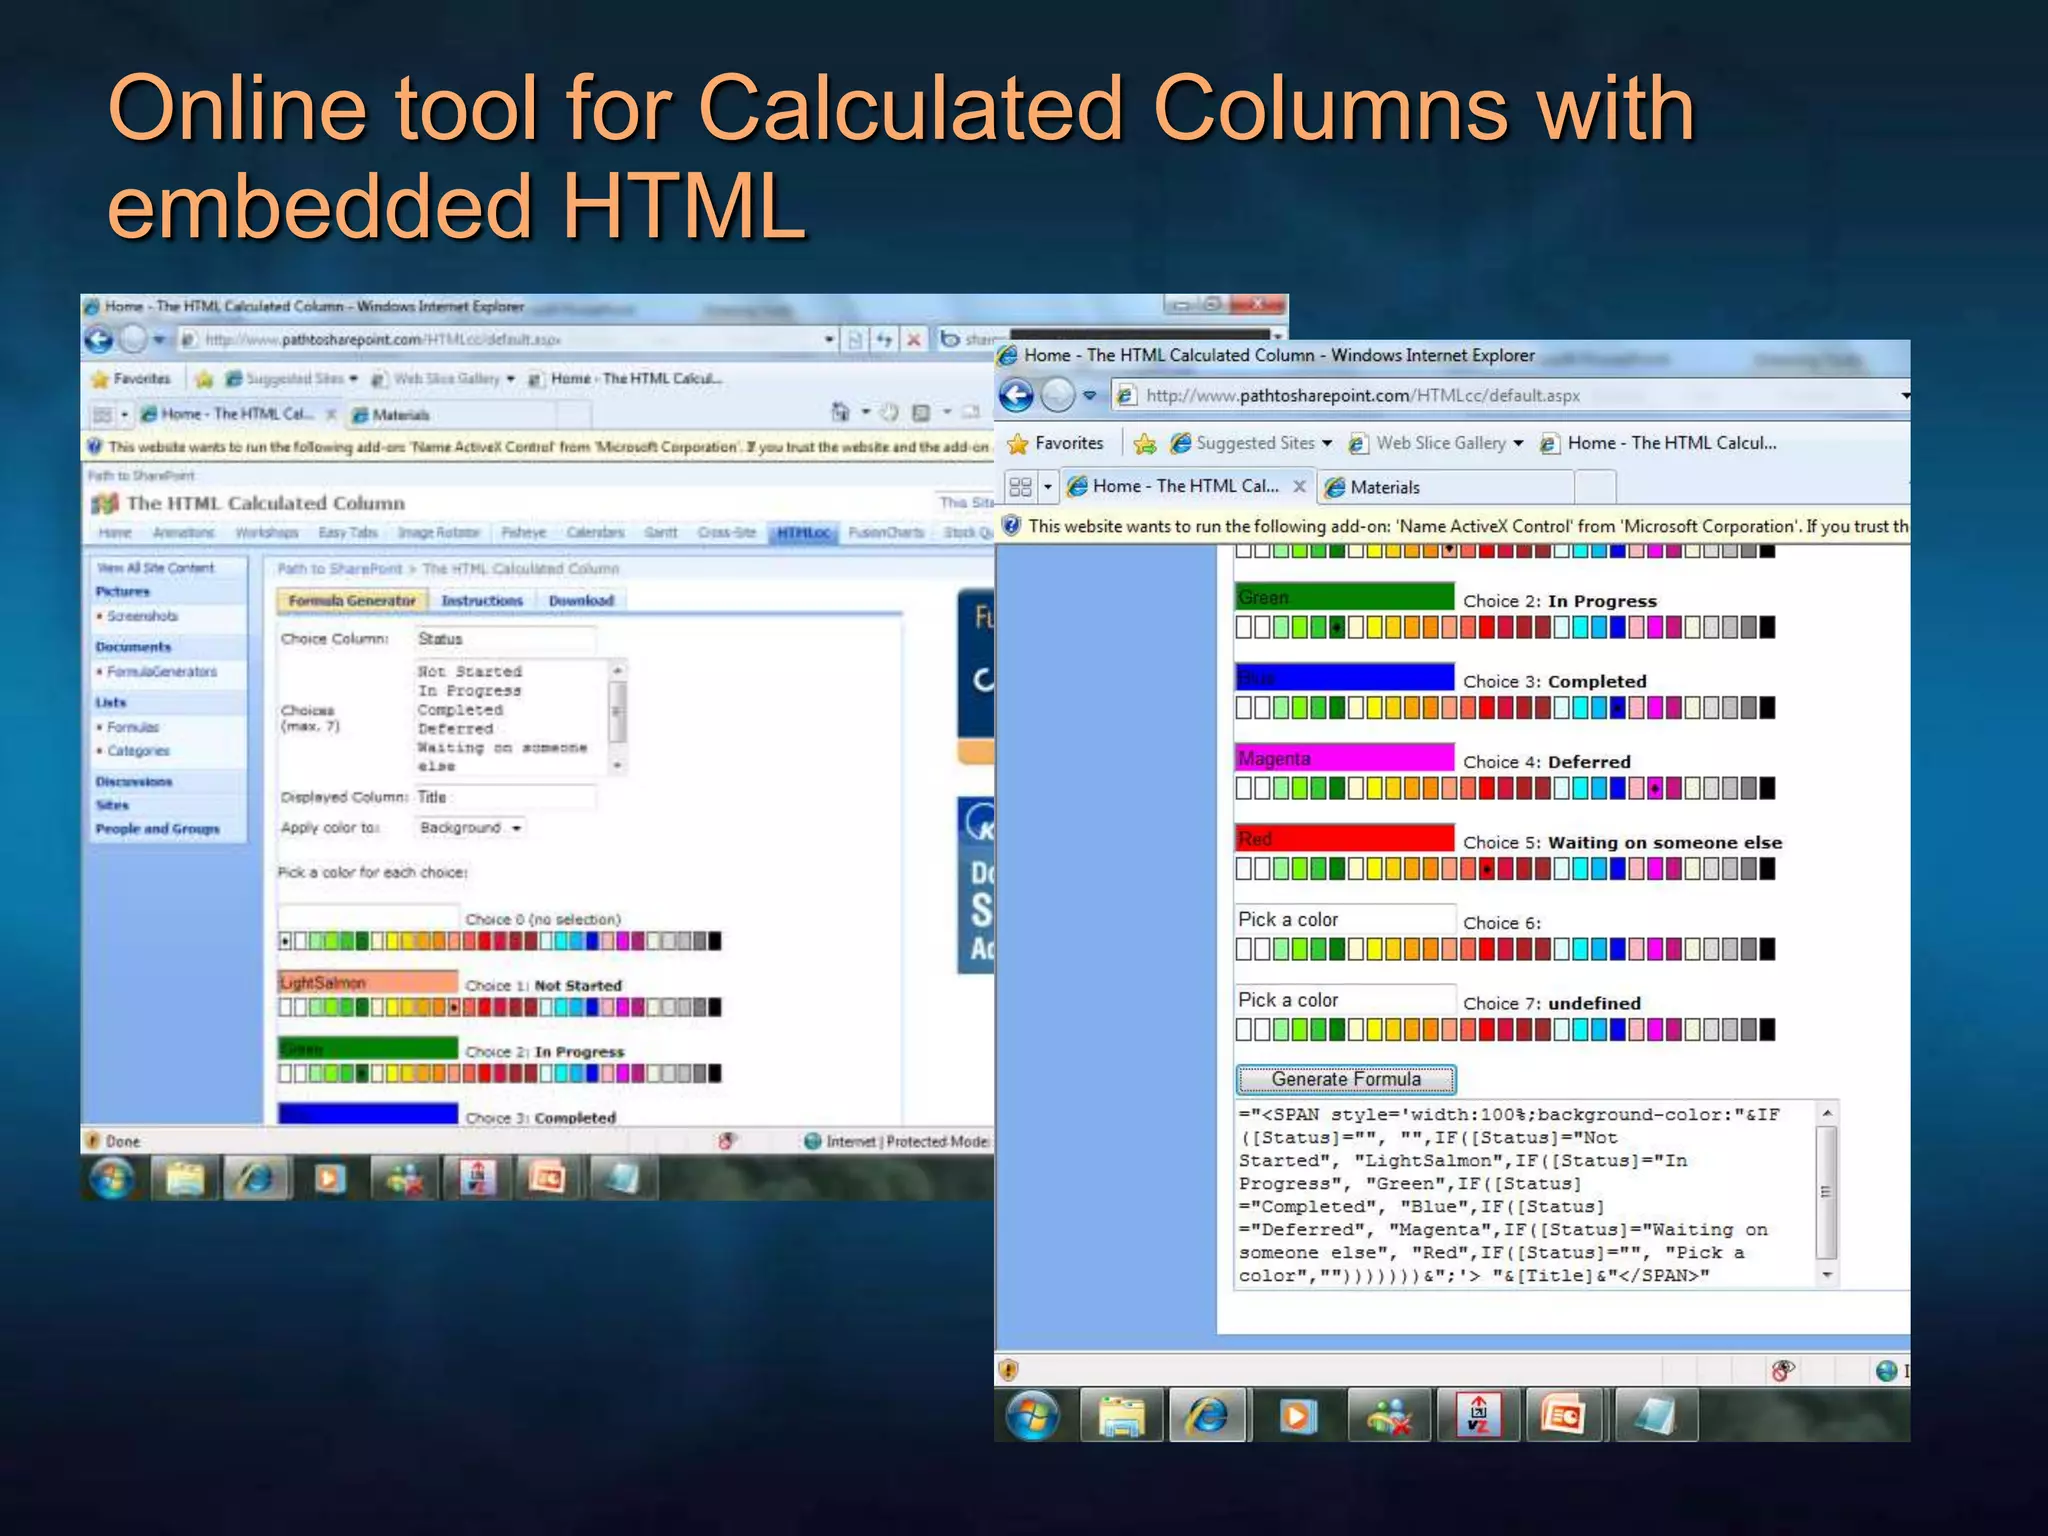
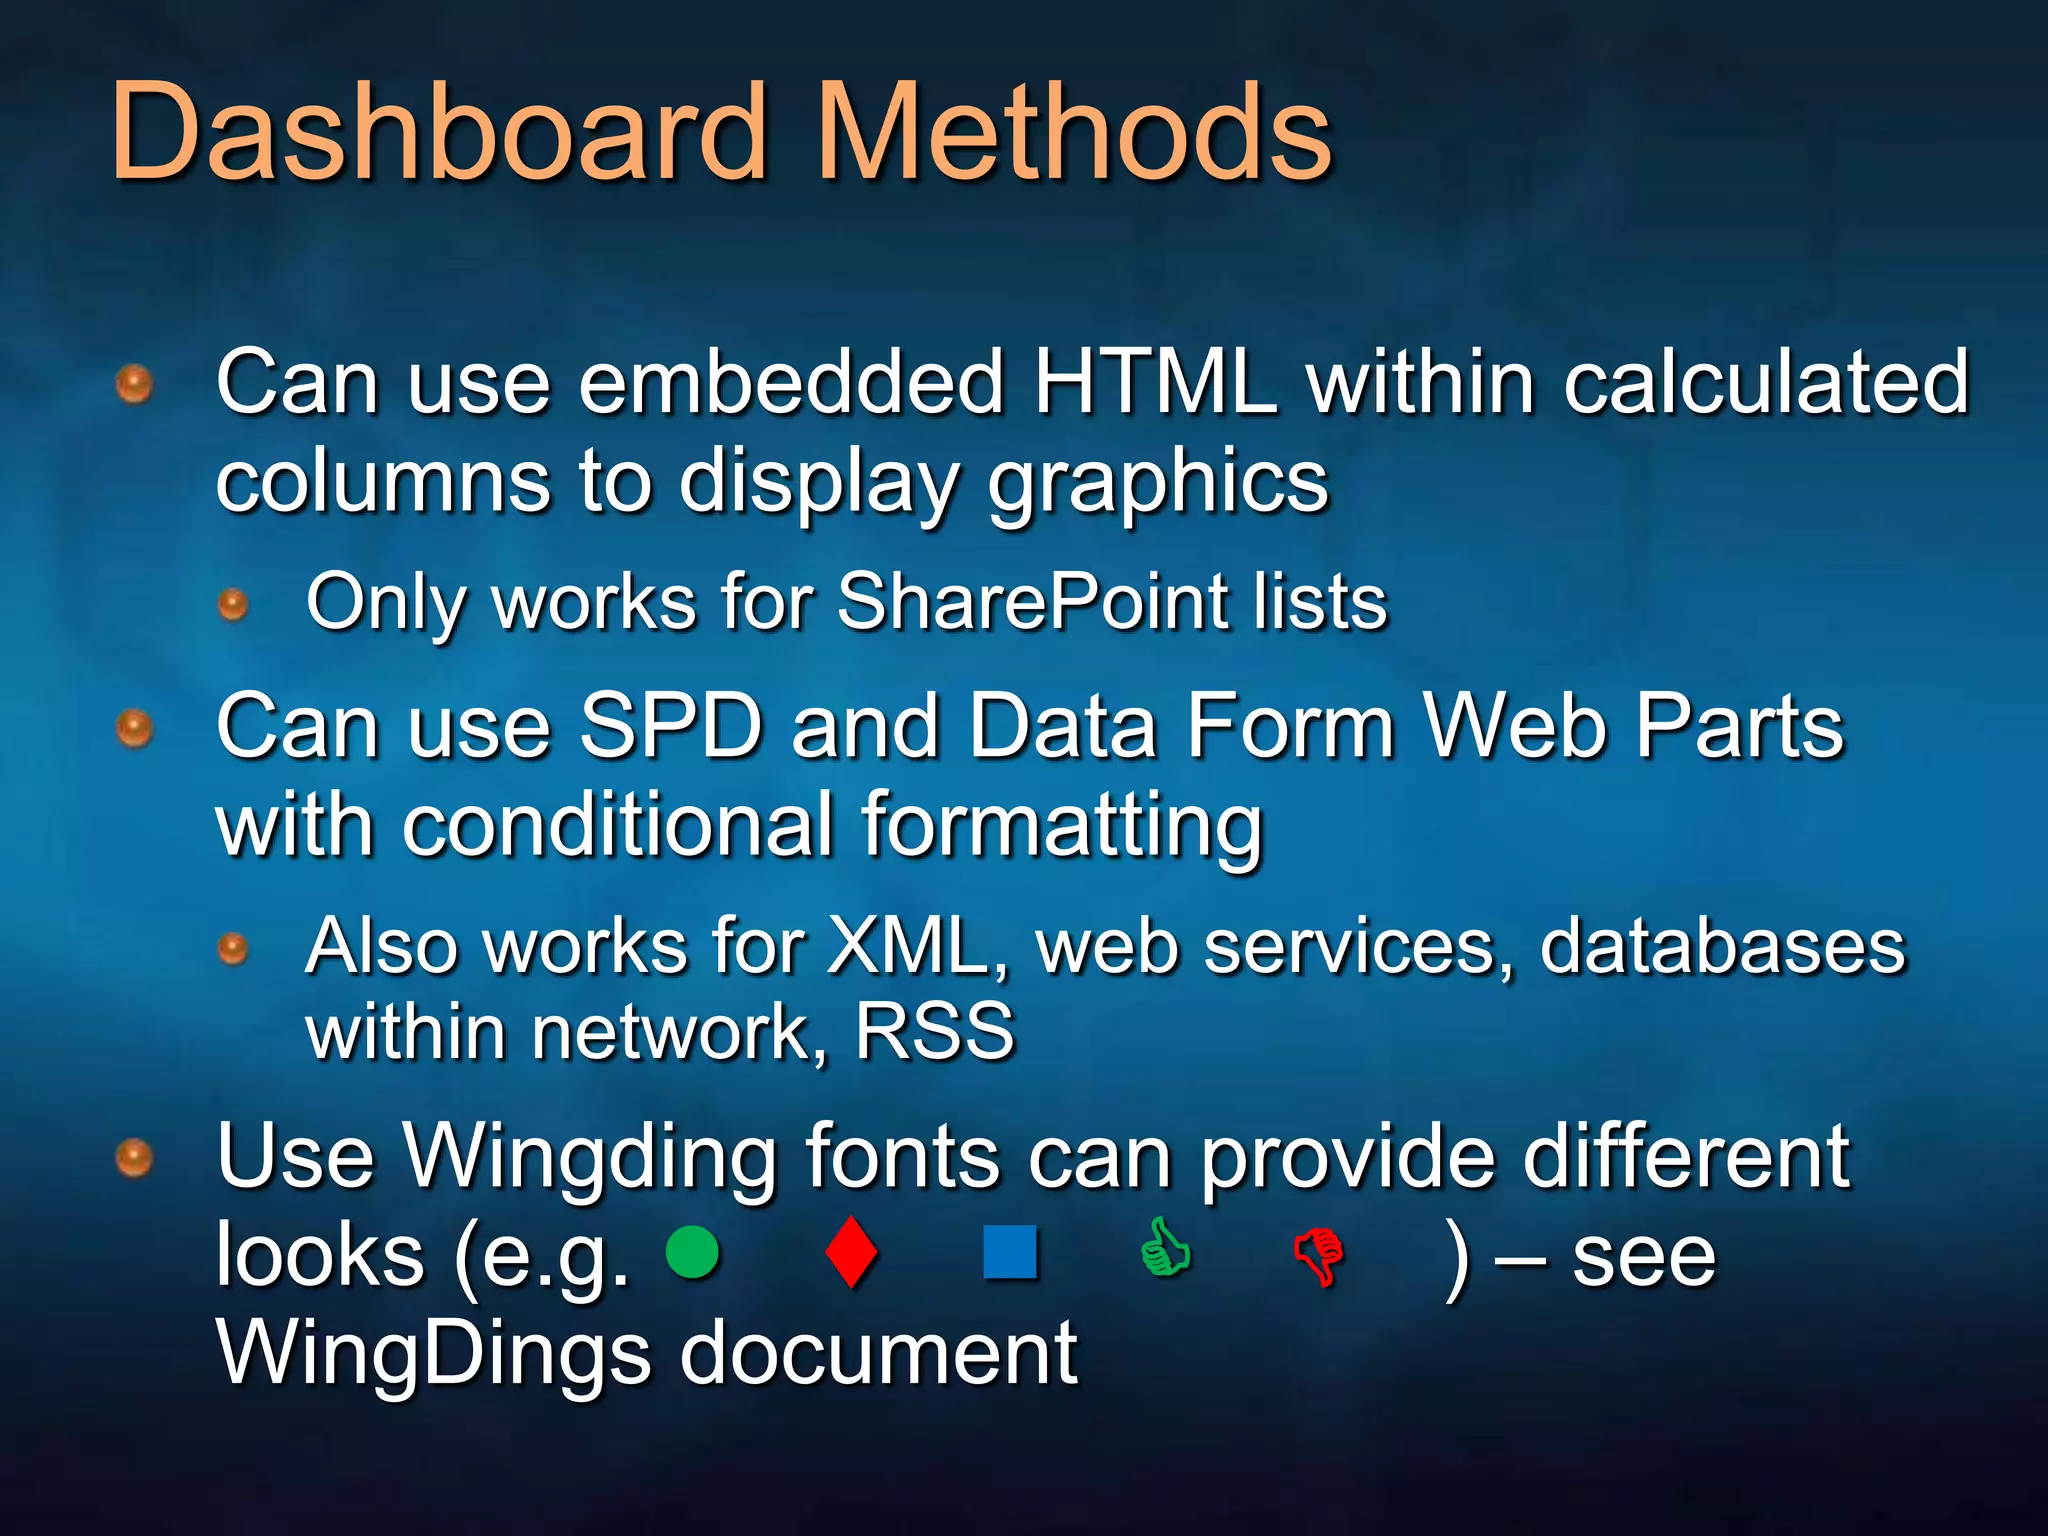
Building SharePoint Dashboards SharePoint Saturday, New York CityJuly 31, 2010Susan Lennon MCITP (SharePoint Administrator 2010, DataBase Administration), MCSD.NETsusanlennonmct@hotmail.comTwitter: susanlennonBlog: http://wss.LennonTechnologies.com/blog
AgendaDiscuss dashboards and terminologyResources (Images, fonts, libraries)Methods to build dashboardsUsing Content Editor Web Parts and Calculated Columns to build a dashboardUsing SharePoint Designer to build a dashboardLinks and questions
Why Build Dashboards?Our bosses LOVE them!Right Information, Right Time, Right FormatProvides similar capabilities that more expensive products include; e.g. Performance Point or MOSS Enterprise (KPIs or BDC); i.e. these methods work in both Windows SharePoint Services and MOSS StandardDashboard is a web page containing ScorecardsScorecards are web parts (for SharePoint) that contain KPIsKPI is a Key Performance Indicator – a single metric or value that is often represented graphically; e.g. red or green stoplight, thumbs up or down, happy or sad face
Online Samples
Use Images from _Layouts folder
Online Color Reference
WingDing and Web Ding Fonts with Calculated Columns
Online tool for Calculated Columns with embedded HTML
Dashboard MethodsCan use embedded HTML within calculated columns to display graphicsOnly works for SharePoint listsCan use SPD and Data Form Web Parts with conditional formattingAlso works for XML, web services, databases within network, RSSUse Wingding fonts can provide different looks (e.g. l tnC D ) – see WingDings document
Using Calculated Columns to Build DashboardsAdd calculated column(s) to SharePoint list – building HTML strings (usually based upon other columns)Can use SharePoint Designer (SPD)  to build a workflow that updates column if calculated column does not provide enough capabilityNeed “special” JavaScript (see PowerPoint Notes) to render HTML on a web part pageJavaScript must be BELOW the list view web part Store JavaScript in Document Library (reusability, versioning, auditing) and refer to in a Content Editor Web Part (CEWP)
Using SharePoint Designer (SPD) to Build DashboardsStart with a simple SharePoint listOptionally,  add a calculated SharePoint column, usually based upon another SharePoint column of type choice – this technique puts some of the control back in the hands of the end userCreate a webpart page – within an existing document library (best practice – in Sandbox DL)Use SharePoint Designer (SPD) and Data Form Web Part to create dashboard view of list with conditional formattingOptionally, use special fonts to create symbols Can add legends above or below dashboard using out of the box (OOB) Content Editor Web Part (CEWP)Data Form Web Part can be exported and used as a web part elsewhere in the site
Data Views: Access to DataImproved OOB support for: Lists, SQL, OLEDB, XML, SOAP Services, Server Scripts, RSS, Business Data Catalog (w/Office SharePoint Server)NewCombine data from multiple sources into single viewsNewFully extensible ASP.NET Data Source control model
Methods to Spice-up a DFWP with SharePoint Designer (SPD)Add a Data Form Web Part (DFWP) to a Web Part Page by either:Dragging a data source into a web part zone, orFrom the data menu select Insert Data ViewAny rows or columns can be formatted with Conditional Formatting (e.g. Red if negative, Black if positive)Images can be shown or hidden with conditional formattingBar charts can be built using CSS
Create a Document Library to store web part pages
Create a Web Part Page in the Document Library
Open web part page in SPD
Insert Data View into a Web Part Zone
Once DVWP is on page, can choose columns (or add columns) to apply conditional formatting
Export Data View Web Part as DWP to use elsewhere on site
Resources	http://office.microsoft.com/en-us/sharepointtechnology/CH100650061033.aspxhttp://applestooranges.com/blog/post/css-for-bar-graphs/?id=55http://blogs.msdn.com/sharepointdesigner/archive/2008/06/27/css-style-bar-graphs-using-data-views.aspxhttp://blogs.msdn.com/sharepointdesigner/Default.aspx?p=2http://blogs.msdn.com/sharepointdesigner/archive/2007/04/24/spdatasource-and-rollups-with-the-data-view.aspxhttp://blogs.msdn.com/sharepointdesigner/archive/2008/02/25/filtering-and-formatting-with-date-values.aspxhttp://pathtosharepoint.wordpress.com/2008/12/09/color-coding-more-examples/#comment-1180http://pathtosharepoint.wordpress.com/2009/03/02/live-demo-jquery-sparklines/
Resources (continued)http://www.bitsofsharepoint.com/ExamplePoint/Site/StatusProgressBar.aspxhttp://www.bitsofsharepoint.com/ExamplePoint/Site/SharePointLayoutImages.aspxhttp://www.pathtosharepoint.com/sharepoint-user-toolkit/Pages/Color-Coding-Calendar-List.aspxhttp://pathtosharepoint.wordpress.com/2008/09/01/using-calculated-columns-to-write-html/ http://www.w3schools.com/tags/ref_colornames.asphttp://www.endusersharepoint.com/2009/10/29/visualizing-information-in-sharepoint-demo-02-five-solutions/
Questions?Coordinator of Hampton Roads SQL Server  and SharePoint User Group in Virginia Beach, VA http://www.hrssug.orgDOD SharePoint User Grouphttps://www.fleetforces.navy.mil/communities/spugSusan’s blog –http://wss.LennonTechnologies.com/blogemail: SusanLennonMCT@Hotmail.comTwitter ID:  SusanLennon

Susan Lennon: Building SharePoint Dashboards

Editor's Notes

  • #10 For creating a column comparing a date (e.g. DueDate) to today’s date, make a new column named Today (doesn’t matter what type – can be a single line of text). Then create a calculated column using new (temporary) column, Today, with other Date column (e.g. DueDate) i.e. =If([DueDate]>=[Today],”C”,”D”) Then after calculated column is built, go back and delete (temporary) column named Today.
  • #18 Be SURE to have focus set in Web Part Zone BEFORE trying to insert data view web part ( or data form web part)
  • #23 <script type="text/javascript">/*Text to HTML - version 2.1Questions and comments: Christophe@PathToSharePoint.com*/function TextToHTML(NodeSet, HTMLregexp) {varCellContent = "";vari=0;while (i < NodeSet.length){try {CellContent = NodeSet[i].innerText || NodeSet[i].textContent;if (HTMLregexp.test(CellContent)) {NodeSet[i].innerHTML = CellContent;}} catch(err){}i=i+1;}}// Calendar viewsvarregexpA = new RegExp("\s*<([a-zA-Z]*)(.|\s)*/\1?>\s*$");TextToHTML(document.getElementsByTagName("a"),regexpA);// List viewsvarregexpTD = new RegExp("^\s*<([a-zA-Z]*)(.|\s)*/\1?>\s*$");TextToHTML(document.getElementsByTagName("TD"),regexpTD);// Grouped list viewsExpGroupRenderData = (function (old) { return function (htmlToRender, groupName, isLoaded) {var result = old(htmlToRender, groupName, isLoaded);varregexpTD = new RegExp("^\s*<([a-zA-Z]*)(.|\s)*/\1?>\s*$");TextToHTML(document.getElementsByTagName("TD"),regexpTD); };})(ExpGroupRenderData);// Preview pane viewsshowpreview1 = (function (old) { return function (o) {var result = old(o);varregexpTD = new RegExp("^\s*<([a-zA-Z]*)(.|\s)*/\1?>\s*$");TextToHTML(document.getElementsByTagName("TD"),regexpTD); };})(showpreview1);</script>