How to obtainmore information
For information about this product or the wide range of services and data available from Statistics Canada, visit our website at
www.statcan.gc.ca, e-mail us at infostats@statcan.gc.ca, or telephone us, Monday to Friday from 8:30 a.m. to 4:30 p.m., at the
following numbers:
Statistics Canada’s National Contact Centre
Toll-free telephone (Canada and United States):
Inquiries line 1-800-263-1136
National telecommunications device for the hearing impaired 1-800-363-7629
Fax line 1-877-287-4369
Local or international calls:
Inquiries line 1-613-951-8116
Fax line 1-613-951-0581
Depository Services Program
Inquiries line 1-800-635-7943
Fax line 1-800-565-7757
To access this product
This product, Catalogue no. 12-587-X, is available free in electronic format. To obtain a single issue, visit our website at
www.statcan.gc.ca and browse by “Key resource” > “Publications.”
Standards of service to the public
Statistics Canada is committed to serving its clients in a prompt, reliable and courteous manner. To this end, Statistics Canada
has developed standards of service that its employees observe. To obtain a copy of these service standards, please contact
Statistics Canada toll-free at 1-800-263-1136.The service standards are also published on www.statcan.gc.ca under “About us” >
“The agency” > “Providing services to Canadians.”
National Library ofCanada Cataloguing in Publication Data
Main entry under title:
Survey methods and practices
Issued also in French under title: Méthodes et pratiques d’enquête.
ISBN 0-660-19050-8
CS12-587-XPE
1. Surveys – Methodology. 2. Household Surveys – Methodology.
3. Questionnaires – Design. 4. Sampling (Statistics) – Methodology.
I. Statistics Canada. II. Statistics Canada. Social Survey Methods Division. III. Title.
HA37.C3 S87 2003 001.4’33
C2003-988000-1
5.
Preface
I am veryproud of the Statistics Canada publication Survey Methods and Practices. It is a real
achievement and marks the culmination of the efforts of a large number of staff at Statistics
Canada, particularly in the Survey Methodology Divisions, and I should like to express my
sincere thanks and appreciation to them all.
This publication has benefited from courses given to Statistics Canada staff, workshops given to
clients and courses given on censuses and surveys to African and Latin American statisticians. Of
particular note is Statistics Canada’s unique and innovative Survey Skills Development Course,
which has been given on more than 80 occasions to over 2,000 staff at Statistics Canada, as well
as to staff from other national statistical agencies. It was given particular impetus by the
production of the Survey Skills Development Manual for the National Bureau of Statistics of
China under the auspices of the Canada – China Statistical Co-operation Program.
The main use of this publication will be in support of the Survey Skills Development Course and
I feel that it will become required reading and a reference for all employees at Statistics Canada
involved in survey-related work. I hope it will also be useful to statisticians in other agencies, as
well as to students of survey design and methods courses for whom it could serve as a source of
insights into survey practices.
Ottawa Dr. Ivan P. Fellegi
October 2003 Chief Statistician of Canada
6.
Foreword
This manual isprimarily a practical guide to survey planning, design and implementation. It
covers many of the issues related to survey taking and many of the basic methods that can be
usefully incorporated into the design and implementation of a survey. The manual does not
replace informed expertise and sound judgement, but rather is intended to help build these by
providing insight on what is required to build efficient and high quality surveys, and on the
effective and appropriate use of survey data in analysis.
It originated as part of the Canada – China Statistical Co-operation Program, funded by the
Canadian International Development Agency. The manual developed for that program was
designed to assist the National Bureau of Statistics of China as part of its national statistical
training program. It was accompanied by a Case Study that covered the main points of the manual
through the use of a hypothetical survey. The China manual and Case Study were revised and
modified to yield this manual for use at Statistics Canada, particularly as a companion reference
and tool for the Statistics Canada Survey Skills Development Course.
Although the main focus of the manual is the basic survey concepts useful to all readers, some
chapters are more technical than others. The general reader may selectively study the sections of
these technical chapters by choosing to skip the more advanced material noted below.
The first five chapters cover the general aspects of survey design including:
- an introduction to survey concepts and the planning of a survey (Chapter 1);
- how to formulate the survey objectives (Chapter 2);
- general considerations in the survey design (Chapter 3), such as:
- whether to conduct a sample survey or a census;
- how to define the population to be surveyed;
- different types of survey frames;
- sources of error in a survey;
- methods of collecting survey data (Chapter 4), such as:
- self-enumeration, personal interview or telephone interview;
- computer-assisted versus paper based questionnaires;
and
- how to design a questionnaire (Chapter 5).
Chapters 6, 7 and 8 cover more technical aspects of the design of a sample survey:
- how to select a sample (Chapter 6);
- how to estimate characteristics of the population (Chapter 7);
- how to determine the sample size and allocate the sample across strata (Chapter 8).
In Chapter 7, the more advanced technical material begins with section 7.3 Estimating the
Sampling Error of Survey Estimates. In Chapter 8, the formulas used to determine sample size,
requiring more technical understanding, begin with section 8.1.3 Sample Size Formulas.
Chapter 9 covers the main operations involved in data collection and how data collection
operations can be organised.
7.
Chapter 10 discusseshow responses to a questionnaire are processed to obtain a complete survey
data file. The more technically advanced material begins with section 10.4.1 Methods of
Imputation.
Chapter 11 covers data analysis. The more technically advanced material in this chapter is
covered in section 11.4 Testing Hypotheses About a Population: Continuous Variables.
Chapter 12 deals with how data are disseminated to users and avoiding disclosure of individual
data or data for a particular group of individuals.
Chapter 13 treats the issues involved in planning and managing a survey. This chapter is a non-
technical chapter, aimed at potential survey managers or those who would be interested in or who
are involved in planning and managing a survey.
In addition to these 13 chapters, there are two appendices. Appendix A addresses the use of
administrative data – data that have been collected by government agencies, hospitals, schools,
etc., for administrative rather than statistical purposes. Appendix B covers quality control and
quality assurance, two methods that can be applied to various survey steps in order to minimise
and control errors.
8.
Acknowledgements
Thanks are dueto the many Statistics Canada employees who contributed to the preparation of
Survey Methods and Practices, in particular:
Editors: Sarah Franklin and Charlene Walker.
Reviewers: Jean-René Boudreau, Richard Burgess, David Dolson, Jean Dumais, Allen
Gower, Michel Hidiroglou, Claude Julien, Frances Laffey, Pierre Lavallée, Andrew Maw,
Jean-Pierre Morin, Walter Mudryk, Christian Nadeau, Steven Rathwell, Georgia Roberts,
Linda Standish, Jean-Louis Tambay.
Reviewer of the French translation: Jean Dumais.
Thanks are also due to everyone who contributed to the preparation of the original China Survey
Skills Manual, in particular:
Project Team: Richard Burgess, Jean Dumais, Sarah Franklin, Hew Gough, Charlene Walker.
Steering Committee: Louise Bertrand, David Binder, Geoffrey Hole, John Kovar, Normand
Laniel, Jacqueline Ouellette, Béla Prigly, Lee Reid, M.P. Singh.
Writers (members of the Project Team, plus): Colin Babyak, Rita Green, Christian Houle,
Paul Kelly, Frances Laffey, Frank Mayda, David Paton, Sander Post, Martin Renaud, Johanne
Tremblay.
Reviewers: Benoît Allard, Mike Bankier, Jean-François Beaumont, Julie Bernier, Louise
Bertrand, France Bilocq, Gérard Côté, Johanne Denis, David Dolson, Jack Gambino, Allen
Gower, Hank Hofmann, John Kovar, Michel Latouche, Yi Li, Harold Mantel, Mary March,
Jean-Pierre Morin, Eric Rancourt, Steven Rathwell, Georgia Roberts, Alvin Satin, Wilma
Shastry, Larry Swain, Jean-Louis Tambay.
Typesetters: Nick Budko and Carole Jean-Marie.
We would also like to acknowledge the input and feedback provided by the Statistical Education
Centre of the National Bureau of Statistics of China and the preliminary work done by Owen
Power, Jane Burgess, Marc Joncas and Sandrine Prasil.
Finally, we would like to acknowledge the work of Hank Hofmann, Marcel Brochu, Jean Dumais
and Terry Evers, the team responsible for the development and delivery of the original Survey
Skills Development Course which was launched in English in the Fall of 1990 and in French in
the fall of 1991.
Various Statistics Canada reference documents and publications were used in developing this
manual. Some key documents include:
- Survey Sampling, a non-Mathematical Guide, by A. Satin and W. Shastry,
- Statistics Canada Quality Guidelines,
- course material for Surveys: from Start to Finish (416),
- course material for Survey Sampling: An Introduction (412),
9.
- course materialfor Survey Skills Development Course (SSDC).
Other Statistics Canada documents are listed at the end of each chapter, as appropriate.
10.
E L EC T R O N I C P U B L I C A T I O N S
A V A I L A B L E A T
www.statcan.gc.ca
11.
Table of Contents
1.Introduction to Surveys ………………………………………………………… 1
2. Formulation of the Statement of Objectives …….……………………………… 9
3. Introduction to Survey Design ..………………………………………………… 19
4. Data Collection Methods ..……………………………………………….……… 37
5. Questionnaire Design ..………………………………………………………….. 55
6. Sample Designs …………………………………………………………………. 87
7. Estimation .…………………………………………………………….………... 119
8. Sample Size Determination and Allocation ..…………………………………… 151
9. Data Collection Operations ..……………………………………………………. 175
10. Processing ..………………………………………………….………………….. 199
11. Analysis of Survey Data……………………………………………….………... 227
12. Data Dissemination ..……………………………………………………………. 261
13. Survey Planning and Management ..…………………………………………..... 279
Appendix A - Administrative Data .……………………………………………………… 303
Appendix B - Quality Control and Quality Assurance ……………………………….….. 309
Case Study ………………………………………………………………………………. 325
Index …………………………………………………………………………………….. 387
12.
E L EC T R O N I C P U B L I C A T I O N S
A V A I L A B L E A T
www.statcan.gc.ca
13.
STATISTICS CANADA
1
Chapter 1- Introduction to Surveys
1.0 Introduction
What is a survey? A survey is any activity that collects information in an organised and methodical
manner about characteristics of interest from some or all units of a population using well-defined
concepts, methods and procedures, and compiles such information into a useful summary form. A
survey usually begins with the need for information where no data – or insufficient data – exist.
Sometimes this need arises from within the statistical agency itself, and sometimes it results from a
request from an external client, which could be another government agency or department, or a private
organisation. Typically, the statistical agency or the client wishes to study the characteristics of a
population, build a database for analytical purposes or test a hypothesis.
A survey can be thought to consist of several interconnected steps which include: defining the objectives,
selecting a survey frame, determining the sample design, designing the questionnaire, collecting and
processing the data, analysing and disseminating the data and documenting the survey.
The life of a survey can be broken down into several phases. The first is the planning phase, which is
followed by the design and development phase, and then the implementation phase. Finally, the entire
survey process is reviewed and evaluated.
The purpose of this chapter is to provide an overview of the activities involved in conducting a statistical
survey, with the details provided in the following chapters and appendices. To help illustrate the teaching
points of this manual, the reader is encouraged to read the Case Study manual which takes the reader
through the planning, design and implementation of a fictitious statistical survey.
1.1 Steps of a Survey
It may appear that conducting a survey is a simple procedure of asking questions and then compiling the
answers to produce statistics. However, a survey must be carried out step by step, following precise
procedures and formulas, if the results are to yield accurate and meaningful information. In order to
understand the entire process it is necessary to understand the individual tasks and how they are
interconnected and related.
The steps of a survey are:
- formulation of the Statement of Objectives;
- selection of a survey frame;
- determination of the sample design;
- questionnaire design;
- data collection;
- data capture and coding;
- editing and imputation;
- estimation;
- data analysis;
- data dissemination;
- documentation.
A brief description of each step follows.
14.
SURVEY METHODS ANDPRACTICES
STATISTICS CANADA
2
1.1.1 Formulation of the Statement of Objectives
One of the most important tasks in a survey is to formulate the Statement of Objectives. This establishes
not only the survey’s broad information needs, but the operational definitions to be used, the specific
topics to be addressed and the analysis plan. This step of the survey determines what is to be included in
the survey and what is to be excluded; what the client needs to know versus what would be nice to know.
How to formulate objectives and determine survey content is explained in Chapter 2 - Formulation of
the Statement of Objectives.
1.1.2 Selection of a Survey Frame
The survey frame provides the means of identifying and contacting the units of the survey population.
The frame is in the form of a list, for example:
- a physical list such as a data file, computer printout or a telephone book;
- a conceptual list, for example a list of all vehicles that enter the parking lot of a shopping centre
between 9:00 a.m. and 8:00 p.m. on any given day;
- a geographic list in which the units on the list correspond to geographical areas and the units within
the geographical areas are households, farms, businesses, etc.
Usually, the statistical agency has the choice of using an existing frame, supplementing an existing frame
or creating a new one. The frame chosen determines the definition of the survey population and can affect
the methods of data collection, sample selection and estimation, as well as the cost of the survey and the
quality of its outputs. Survey frames are presented in Chapter 3 - Introduction to Survey Design.
1.1.3 Determination of the Sample Design
There are two kinds of surveys: sample surveys and census surveys. In a sample survey, data are
collected for only a fraction (typically a very small fraction) of units of the population while in a census
survey, data are collected for all units in the population. Two types of sampling exist: non-probability
sampling and probability sampling. Non-probability sampling provides a fast, easy and inexpensive way
of selecting units from the population but uses a subjective method of selection. In order to make
inferences about the population from a non-probability sample, the data analyst must assume that the
sample is representative of the population. This is often a risky assumption given the subjective method of
selection. Probability sampling is more complex, takes longer and is usually more costly than non-
probability sampling. However, because units from the population are randomly selected and each unit’s
probability of selection can be calculated, reliable estimates can be produced along with estimates of the
sampling error and inferences can be made about the population. Since non-probability sampling is
usually inappropriate for a statistical agency, this manual focuses on probability sampling.
There are many different ways to select a probability sample. The sample design chosen depends on such
factors as: the survey frame, how variable the population units are and how costly it is to survey the
population. The sample design in part determines the size of the sample, which impacts directly on survey
costs, the time required to complete the survey, the number of interviewers required and other important
operational considerations. There is no magical solution and no perfect recipe for determining sample
size. Rather, it is a process of trying to fulfil as many requirements as possible – one of the most
important being the quality of the estimates – as well as operational constraints.
15.
INTRODUCTION TO SURVEYS
STATISTICSCANADA
3
The relative strengths and weaknesses of sample surveys and censuses are covered in Chapter 3 -
Introduction to Survey Design. Non-probability and probability sample designs are presented in
Chapter 6 - Sample Designs. Guidelines for determining the required sample size are covered in
Chapter 8 - Sample Size Determination and Allocation.
1.1.4 Questionnaire Design
A questionnaire (or form) is a group or sequence of questions designed to obtain information on a
subject from a respondent. Questionnaires play a central role in the data collection process since they
have a major impact on data quality and influence the image that the statistical agency projects to the
public. Questionnaires can either be in paper or computerised format.
Problems faced during questionnaire design include: deciding what questions to ask, how to best word
them and how to arrange the questions to yield the information required. The goal is to obtain information
in such a way that survey respondents understand the questions and can provide the correct answers easily
in a form that is suitable for subsequent processing and analysis of the data. While there are well-
established principles for questionnaire design, crafting a good questionnaire remains an art requiring
ingenuity, experience and testing. If the data requirements are not properly transformed into a structured
data collection instrument of high quality, a ‘good’ sample can yield ‘bad’ results.
Questionnaire design is covered in Chapter 5 - Questionnaire Design.
1.1.5 Data Collection
Data collection is the process of gathering the required information for each selected unit in the
survey. The basic methods of data collection are self-enumeration, where the respondent completes the
questionnaire without the assistance of an interviewer, and interviewer-assisted (either through personal
or telephone interviews). Other methods of data collection include direct observation, electronic data
reporting and the use of administrative data.
Data collection can be paper-based or computer-assisted. With paper-based methods, answers are
recorded on printed questionnaires. With computer-assisted methods, the questionnaire appears on the
screen of the computer and the answers are entered directly into the computer. One benefit of computer-
assisted methods is that data capture – the transformation of responses into a machine-readable format
– occurs during collection, thereby eliminating a post-collection processing activity. Another benefit is
that invalid or inconsistent data can be identified more easily than with a paper questionnaire.
Methods of data collection are covered in Chapter 4 - Data Collection Methods. The use of
administrative data is discussed in Appendix A - Administrative Data. Data collection activities,
including such interviewer activities as listing, tracing, and methods of organising data collection are
covered in Chapter 9 - Data Collection Operations.
1.1.6 Data Capture and Coding
After the data are collected, they are coded and, if a computer-assisted collection method was not used,
captured. Coding is the process of assigning a numerical value to responses to facilitate data capture
and processing in general. Some questions have coded response categories on the questionnaire, others
16.
SURVEY METHODS ANDPRACTICES
STATISTICS CANADA
4
are coded after collection during a manual or automated process. Data capture and coding are expensive
and time-consuming activities that are critical to data quality since any errors introduced can affect the
final survey results. Therefore, emphasis should be placed on error prevention in the early stages. Two
methods of monitoring and controlling errors are quality assurance and quality control. The purpose of
quality assurance is to anticipate problems and prevent them while the purpose of quality control is to
ensure that the number of errors that occur are within acceptable limits.
Data capture and coding are covered in Chapter 10 - Processing. Quality issues are covered in
Appendix B - Quality Control and Quality Assurance.
1.1.7 Editing and Imputation
Editing is the application of checks to identify missing, invalid or inconsistent entries that point to data
records that are potentially in error. The purpose of editing is to better understand the survey processes
and the survey data in order to ensure that the final survey data are complete, consistent and valid. Edits
can range from simple manual checks performed by interviewers in the field to complex verifications
performed by a computer program. The amount of editing performed is a trade-off between getting every
record ‘perfect’ and spending a reasonable amount of resources (time and money) achieving this goal.
While some edit failures are resolved through follow-up with the respondent or a manual review of the
questionnaire, it is nearly impossible to correct all errors in this manner, so imputation is often used to
handle the remaining cases. Imputation is a process used to determine and assign replacement values to
resolve problems of missing, invalid or inconsistent data.
Although imputation can improve the quality of the final data, care should be taken in order to choose an
appropriate imputation methodology. Some methods of imputation do not preserve the relationships
between variables or can actually distort underlying relationships in the data. The suitability of the
method chosen depends on the type of survey, its objectives and the nature of the error.
Editing and imputation are covered in Chapter 10 - Processing.
1.1.8 Estimation
Once the data have been collected, captured, coded, edited and imputed, the next step is estimation.
Estimation is the means by which the statistical agency obtains values for the population of interest so
that it can draw conclusions about that population based on information gathered from only a sample
of the population. An estimate may be a total, mean, ratio, percentage, etc.
For a sample survey, the basis of estimation is the unit’s weight, which indicates the average number of
population units it represents. A population total can be estimated, for example, by summing the weighted
values of the sampled units. The initial design weight is determined by the sample design. Sometimes,
adjustments are made to this weight, for example, to compensate for units that do not respond to the
survey (i.e., total nonresponse) or to take into account auxiliary information. Nonresponse adjustments
may also be applied to data from a census survey.
Sampling error occurs in sample surveys since only a portion of the population is enumerated and the
sampled units do not have exactly the same characteristics as all of the population units that they
represent. An estimate of the magnitude of the sampling error for each estimate should always be
17.
INTRODUCTION TO SURVEYS
STATISTICSCANADA
5
provided to indicate to users the quality of the data.
Estimation of summary statistics is covered in Chapter 7 - Estimation. Estimating sampling error is
discussed in Chapter 7 - Estimation and Chapter 11 - Analysis of Survey Data.
1.1.9 Data Analysis
Data analysis involves summarising the data and interpreting their meaning in a way that provides clear
answers to questions that initiated the survey. Data analysis should relate the survey results to the
questions and issues identified by the Statement of Objectives. It is one of the most crucial steps of a
survey since the quality of the analysis can substantially affect the usefulness of the whole survey.
Data analysis may be restricted to the survey data alone or it may compare the survey’s estimates with
results obtained from other surveys or data sources. Often, it consists of examining tables, charts and
various summary measures, such as frequency distributions and averages to summarise the data.
Statistical inference may be used in order to verify hypotheses or study the relationships between
characteristics, for instance, using regression, analysis of variance or chi-square tests.
Data analysis is covered in Chapter 11 - Data Analysis.
1.1.10 Data Dissemination
Data dissemination is the release of the survey data to users through various media, for example,
through a press release, a television or radio interview, a telephone or facsimile response to a special
request, a paper publication, a microfiche, electronic media including the Internet or a microdata file on a
CD, etc..
Delivery and presentation of the final results is very important. It should be easy for the users to find,
understand, use and interpret the survey results correctly. Results from the survey should be summarised
and the strengths and weaknesses of the data indicated, with important details highlighted through a
written report that includes tables and charts.
Before disseminating data, a data quality evaluation should be performed in order to help assess and
interpret the survey results and the quality of the survey and to inform users so that they can judge for
themselves the usefulness of the data. It may also provide valuable input to improve the survey (if
repeated) or other surveys. This evaluation, and its accompanying report, should include a description of
the survey methodology along with measures and sources of error.
As part of the dissemination process, many statistical agencies are required by law to protect the
confidentiality of respondents’ information. Disclosure control refers to those measures taken to protect
disseminated data so that the confidentiality of respondents is not violated. It involves, for instance,
identifying and eliminating (or modifying) table cells that risk revealing information about an individual.
Usually, some data have to be suppressed or modified. Before choosing a disclosure control method,
various methods should be compared with respect to their impact on the survey results and an individual’s
risk of disclosure.
Data dissemination is covered in Chapter 12 - Data Dissemination.
18.
SURVEY METHODS ANDPRACTICES
STATISTICS CANADA
6
1.1.11 Documentation
Documentation provides a record of the survey and should encompass every survey step and every survey
phase. It may record different aspects of the survey and be aimed at different groups, such as
management, technical staff, designers of other surveys and users. For example, a report on data quality
provides users a context for informed use of the data. A survey report that includes not only what
decisions were made, but also why they were made provides management and technical staff with useful
information for future development and implementation of similar surveys. During implementation,
documentation of procedures for staff helps to ensure effective implementation.
How to organise a report and guidelines for writing are covered in Chapter 12 - Data Dissemination.
1.2 Life Cycle of a Survey
The survey steps presented above are not necessarily sequential: some are conducted in parallel, others –
for example, editing – are repeated at different times throughout the survey process. Every step must first
be planned, then designed and developed, implemented and ultimately evaluated. The phases in the life of
a survey are described below.
1.2.1 Survey Planning
The first phase of the survey process is planning. But before any planning can take place, a management
and planning structure must be selected and implemented. One commonly used structure is the project or
survey team approach, whereby an interdisciplinary survey team is given responsibility for the planning,
design, implementation, and evaluation of the survey and of its planned products. The interdisciplinary
team is composed of members having different technical skills; for example, a statistician, a computer
programmer, an expert in the field of study, a data collection expert, etc.
Survey planning should be conducted in stages of increasing detail and exactitude. At the preliminary, or
survey proposal stage, only the most general notion of the data requirements of the client may be known.
Once a survey proposal has been formulated, it is important to determine whether a new survey is
necessary, keeping in mind options, costs and priorities of the client and the statistical agency. Sometimes
much or all of the information desired can be obtained from administrative files of governments,
institutions and agencies. Alternatively, it may be possible to add questions to an existing survey’s
questionnaire or, it may be possible to redesign an existing survey.
If it is decided that alternative data sources cannot meet the information needs, the team proceeds to
formulate the Statement of Objectives and to develop some appreciation of frame options, the general
sample size, precision requirements, data collection options, schedule and cost. A decision about the
feasibility of the survey is usually made at this point.
After the objectives of the survey are clear, each team member prepares the component plans associated
with his or her responsibility within the team. During this stage, planning becomes a more complex
matter. The advantages and disadvantages of alternative methodologies should be examined and
compared in terms of: coverage, mode of data collection, frequency, geographical detail, response burden,
quality, cost, resources required and timeliness.
19.
INTRODUCTION TO SURVEYS
STATISTICSCANADA
7
In the later stages of the survey process, plans are revised, elaborated and refined, and more detailed
aspects are examined. Each and every activity and operation needs some form of plan for design,
development and implementation. Planning continues throughout the entire survey process with
modifications being made as required.
The details of planning are covered in Chapter 13 - Survey Planning and Management.
1.2.2 Design and Development
Having established a broad methodological framework, it is possible to carry out detailed work on the
various steps of a survey in, what is referred to as, the design and development phase. The overall
objective of this phase is to find the set of methods and procedures that achieve an appropriate balance of
quality objectives and resource constraints.
It is during this phase that any required pretests or pilot surveys are carried out to assess, for example, the
adequacy of the questionnaire, suitability of the survey frame, operational procedures, etc. All field
materials (e.g., interviewer training and instruction manuals, sample control documents) are prepared for
the data collection stage. Software programs for computer administered questionnaires are developed, or
adapted, and tested. Sample selection and estimation procedures are finalised in the form of
specifications. Specifications for coding, data capture, editing and imputation are all prepared to set the
stage for data processing.
To be effective, procedures should be designed to control and measure the quality at each step of the
survey (using quality assurance and quality control procedures) and to assess the quality of the final
statistical products.
1.2.3 Implementation
Having ensured that all systems are in place, the survey can now be launched. This is the implementation
phase. All survey control forms and manuals are printed, along with the questionnaire (if paper
questionnaires are used). Interviewers are trained, the sample is selected and information is collected, all
in a manner established during the development phase. Following these activities, data processing begins.
Processing activities include data capture, coding, editing and imputation. The result is a well-structured
and complete data set from which it is possible to produce required tabulations and to analyse survey
results. These results are then checked for confidentiality and disseminated. At every step, data quality
should be measured and monitored using methods designed and developed in the previous phase.
1.2.4 Survey Evaluation
Survey evaluation is an ongoing process throughout the survey. Every step of the survey should be
evaluated in terms of its efficiency, effectiveness and cost, particularly in the case of repeated surveys, so
that improvements in their design and implementation can be made over time. This involves assessments
of the methods used, as well as evaluations of operational effectiveness and cost performance. These
evaluations serve as a test of the suitability of the technical practices. They also serve to improve and
guide implementation of specific concepts or components of methodology and operations, within and
across surveys. They support the activities and provide measures and assessments of the quality
limitations of the program data. As well, each survey step is evaluated to provide insight into
20.
SURVEY METHODS ANDPRACTICES
STATISTICS CANADA
8
shortcomings or problems in other steps of the survey. For example, editing and imputation can provide
information on problems with the questionnaire.
Evaluations of previous surveys or pilot surveys are important when planning a new statistical activity:
they can help formulate realistic survey objectives, provide an idea of the expected quality of the data and
essential information for survey design and data processing.
1.3 Summary
What is a survey? A survey is any activity that collects information in an organised and methodical
manner. It is usually motivated by the need to study the characteristics of a population, build a database
for analytical purposes or test a hypothesis.
What are the steps of a survey? A survey is a much more complex procedure than simply asking questions
and compiling answers to produce statistics. Numerous steps must be carried out following precise
methods and procedures, if the results are to yield accurate information. These steps include formulating
the survey objectives, determining the sample design, designing the questionnaire, performing data
collection, processing and tabulating data and disseminating results.
How are the steps implemented? Execution of a survey can be described as a life cycle with four phases.
The first phase is planning during which the survey objectives, methodology, budget and schedule of
activities are established. The next phase is the design and development of the survey steps. The third
phase is the implementation of the survey steps. During implementation, quality is measured and
monitored in order to ensure that the processes are working as planned. Finally, the survey steps are
reviewed and evaluated.
Bibliography
Cochran, W.G. 1977. Sampling Techniques. John Wiley and Sons, New York.
Des Raj. 1972. The Design of Sample Surveys. McGraw-Hill Series in Probability and Statistics, New
York.
Moser C.A. and G. Kalton. 1971. Survey Methods in Social Investigation. Heinemann Educational Books
Limited, London.
Särndal, C.E., B. Swensson and J. Wretman. 1992. Model Assisted Survey Sampling. Springer-Verlag,
New York.
Satin, A. and W. Shastry. 1993. Survey Sampling: A Non-Mathematical Guide – Second Edition.
Statistics Canada. 12-602E.
Statistics Canada. 1987. Quality Guidelines. Second Edition.
Statistics Canada. 1998. Statistics Canada Quality Guidelines. Third Edition. 12-539-X1E.
21.
9
Chapter 2 -Formulation of the Statement of
Objectives
2.0 Introduction
The first task in planning a survey is to specify the objectives of the survey as thoroughly and as clearly as
possible. A clear Statement of Objectives guides all subsequent survey steps. These steps should be
planned to ensure that the final results meet the original objectives.
Suppose that a survey on poverty is to be conducted. It is not enough to indicate that the purpose of the
survey is to provide information on, for example, ‘housing conditions of the poor’. Such a vague
statement may serve as a broad description of the survey’s general theme, but ultimately it must be
expanded into more specific language. What is meant by ‘housing conditions’? Does it refer to the
building, its age or need of repair, or does it refer to crowding (e.g., the number of people per square
metre)? What precisely is meant by ‘poor’? Is poverty to be measured in terms of income, expenditures,
debts, or all of these?
The statistical agency, in consultation with the client, first needs to define the information needs and
primary users and uses of the data more completely and precisely. Broadly, what information is required
on housing conditions for the poor? Who needs the data and for what purpose? Suppose that the client
requesting the survey is City Council. City Council suspects that housing conditions of the poor to be
inadequate and expects to have to build new subsidised housing. City council may want to know how
many new houses would be are required and how much they would cost. It may want to ask the poor
where they would want the new housing. The city may also expect to vary the subsidy depending on the
poverty of the family, thereby requiring data for different levels of poverty.
Next, specific operational definitions need to be developed, including a definition of the target population.
These definitions indicate who or what is to be observed and what is to be measured. In the case of ‘poor’,
the definition might be all families with a gross income below a certain level. The terms ‘family’ and
‘income’ must also be defined. Coverage of the population needs to be defined: what geographic area is
the client interested in – which areas within the city? And what is the reference period – last week, last
year?
The statistical agency also needs to know what specific topics are to be covered by the survey. Does the
client want information by income group, the type of dwelling (e.g., apartment building, single detached
house, etc.), the age of the dwelling, the number of people living in the dwelling, etc.? What level of
detail is necessary for each topic and what is to be the format of the results? This usually takes the form of
proposed analysis tables. For a sample survey, the level of detail possible is a function of the size of the
sampling error in the estimates as well as operational constraints such as available time, budget, personnel
and equipment. These quality targets and operational constraints will heavily influence the scope of the
survey.
The Statement of Objectives may be revised many times by the statistical agency, in consultation with the
client, during the planning, design and development of the survey.
The purpose of this chapter is to illustrate how to formulate the Statement of Objectives.
22.
SURVEY METHODS ANDPRACTICES
STATISTICS CANADA
10
2.1 A Multi-Step Process for Developing the Statement of Objectives
Developing the Statement of Objectives is a multi-step, iterative process involving the statistical agency,
the client and the users (if different than the client). The steps in the process are to determine:
- the information needs;
- the users and uses of the data;
- the main concepts and the operational definitions;
- the survey content;
- the analysis plan.
To illustrate these steps, consider the following example. The city’s Regional Transit Authority (RTA)
has been instructed by the City Council to take steps to facilitate the use of public transit by senior
citizens (referred to as ‘seniors’). Since the RTA does not have current information on seniors’ needs or
travel habits, it has approached the statistical agency to help gather new data. The following paragraph is
the RTA’s initial statement of the situation:
To facilitate the use of public transit by the city’s seniors, the RTA is considering modifying its
existing service. Possible changes include, for example, purchasing special buses, modifying
existing buses, adding new routes, or possibly subsidising fares. Before proceeding with
expensive purchases and alterations, the RTA requires information on the transportation needs of
seniors so that it can tailor its budget and improvements to their needs.
2.1.1 The Information Needs (State the Problem)
The first step is to describe in broad terms the information needs of the client. The statistical agency
should begin by identifying the problem and stating it in general terms. Why has a survey been
suggested? What are the underlying issues and in what context have they been raised?
In the RTA example, the City Council first instructed the RTA to ‘take steps to facilitate the use of public
transit by seniors’. In the initial statement, the RTA interpreted this as a need to modify existing service to
‘facilitate the use of public transit by the city’s seniors’. But what is the objective that must be directly
addressed to help the RTA achieve that goal?
The RTA requires information on the transportation needs of seniors and if and how they are
currently being met.
The overall information needs of the survey have now been identified. It is important to return to this
statement at every step of the survey to ensure that the survey objectives are met.
2.1.2 The Users and Uses of the Data
The next questions to ask are: Who are the main users of the data? What will the information be used for?
The statistical agency needs to know who the users are because their input is very important during the
planning phase of a survey. (The ultimate users of the data are not always the client, although this is often
the case.) The uses of the data must be identified to specify more precisely the information needs. This is
done in consultation with the client and data users. What types of policy issues are to be addressed? Will
the survey information be used to describe a situation or to analyse relationships? What type of decisions
might be made using the data and what might be the consequences? If possible, potential respondents
23.
FORMULATION OF THESTATEMENT OF OBJECTIVES
STATISTICS CANADA
11
should also be consulted since they could identify issues and concerns that are important to them which
could affect survey content.
According to the RTA, ‘the RTA requires information on the transportation needs of seniors so that it can
tailor its budget and improvements to the needs of seniors.’ Specifically, the information may be used by
transportation planners at the RTA to:
- purchase special buses;
- modify existing buses;
- add new routes;
- subsidise fares.
The information needs of the survey have now been identified, along with who will use the data and what
it will be used for; this is particularly important. For example, suppose that the RTA expects to have to
add new routes, then the RTA may want to ask seniors where they would like these routes. If the RTA
expects to have to modify existing buses, then it may want to know what modifications seniors would
prefer. If the RTA expects to have to purchase special buses, it may want to know what special buses
seniors require. If the RTA is considering subsidising fares, it may want to ask seniors what they would
consider to be an affordable fare. The results expected, therefore, and the consequences of the results
determine the survey content.
2.1.3 Concepts and Operational Definitions
In order to identify the data required to meet the survey’s objectives, the statistical agency needs clear and
precise definitions. These definitions may specify exclusions, such as homeless individuals or individuals
living in institutions, etc. To the extent possible, recognised standard definitions should be used. This will
facilitate communication with the data users and respondents, as well as ensure consistency across
surveys. The statistical agency may be required to develop some standard definitions, for example, for
dwelling, household, family, etc.
In order to determine the operational definitions, there are three questions that should be asked: Who or
What? Where? and When? One of the first concepts to be defined is the survey’s target population. The
target population is the population for which information is desired. It is the collection of units that the
client is interested in studying. Depending on the nature and the goal of the survey, these units usually
will be individuals, households, schools, hospitals, farms, businesses, etc. Returning to the RTA example,
the following questions should be asked when defining the survey’s target population:
i. Who or what is the client interested in?
Here, the statistical agency needs to consider the type of units that comprise the target population and the
units’ defining characteristics. For the RTA survey, it has been stated that the client is interested in the use
and needs of public transit by seniors. Explicit definitions of seniors, public transit and use are required.
Suppose that seniors are defined as persons aged 65 years or over. (The client should clarify with the
RTA what the RTA’s own definition of seniors is for the purposes of urban transportation.) There may be
several forms of public transit: buses, trains, subways and special needs vehicles. Suppose that the client
is only interested in buses. Another question is whether the client is only interested in seniors who
currently use buses, or all seniors? The client may be interested in all seniors.
24.
SURVEY METHODS ANDPRACTICES
STATISTICS CANADA
12
ii. Where are the units of interest?
This refers to the geographical location of the units (i.e., seniors). The client may only be interested in the
use of public buses operating in the city metropolitan area (as defined by a recent census, for example;
again, a clear definition is required), or perhaps the area over which the RTA has jurisdiction (i.e., the
area served by the existing network of public bus routes). So, the client must decide if it all seniors are
part of the target population, or just those living in a particular region.
iii. What is the reference period for the survey? (When?)
What time period do the data refer to? (When?) The answer appears to be ‘now’ since the RTA’s
statement refers to current needs. In practice, this could mean that seniors are asked about their use of
public buses during a recent reference period (week, month, etc.). Should seniors be surveyed for more
than one period or asked about several different reference periods?
An important consideration with respect to the reference period is seasonality. Certain activities are
related to the time of the week, month or year. Therefore, conclusions that refer to a specific time frame
may not be valid for other time frames. For example, if the RTA questionnaire asks seniors about their
use of the transit system during the week, the survey results may not be valid for weekends.
In addition to the target population, many other concepts must be defined. The following are examples of
three related concepts commonly used by household surveys at Statistics Canada:
A dwelling is any set of living quarters that is structurally separate and has a private entrance
outside the building or from a common hall or stairway inside the building.
A household is any person or group of persons living in a dwelling. A household may consist of
any combination of: one person living alone, one or more families, a group of people who are
not related but who share the same dwelling.
A family is a group of two or more persons who live in the same dwelling and who are related
by blood, marriage (including common-law) or adoption. A person living alone or who is
related to no one else in the dwelling where he or she lives is classified as an unattached
individual.
For more details on how to define the target and survey populations see Chapter 3 - Introduction to
Survey Design.
2.1.4 Survey Content
A clear Statement of Objectives ensures that the survey content is appropriate and clearly defined. Having
determined the overall information needs, the users and uses, and the operational definitions, the
statistical agency next needs to know what specific topic areas are to be covered by the survey. This is
often an iterative process. The process of specifying the survey content often leads to revelations about
incompleteness in the information needs and uses, or conversely, to the revelation that some needs cannot
be met due to operational or definitional reasons.
Returning to the RTA example, the information that is required at a fairly general level has been
identified. Now the statistical agency needs to expand on this.
25.
FORMULATION OF THESTATEMENT OF OBJECTIVES
STATISTICS CANADA
13
For seniors, the client may also wish to determine various characteristics such as:
- age;
- sex;
- disabilities;
- household income;
- geographic location (are seniors mainly living in small areas within the city, such as retirement
homes, or are they spread out throughout the city?);
- dwelling type (e.g., retirement homes, apartments, houses);
- household composition (who are they living with?).
To determine transportation needs, the client may require information on:
- number of trips last week;
- frequency of travel (by time of day; weekday versus weekend);
- modes of transportation used;
- problems using public buses;
- amount of local travel.
A desire for information on trip characteristics may lead to questions about:
- the reason for the trips;
- the geographic origin and destination of the trips;
- limitations on travel;
- special aids or assistance needed;
- the number of trips cancelled due to lack of transport.
To determine whether or not needs are currently being met, the client may have to understand such issues
as:
- accessibility (How many seniors own a car, bicycle, etc.?);
- use of public buses;
- amount of money spent on public buses;
- ways to improve service;
- ways to encourage seniors to use (or more frequently use) public buses.
Note that definitions are required for all concepts not already defined. For example, what is meant by a
disability? What is a trip?
The specific topics to be covered determine the variables to be collected, the questionnaire design and
even the sample design. These in turn affect the choice of data collection method, for example whether or
not to use interviewers, and therefore the cost of the survey.
The statistical agency must cover all aspects of the information needs, but to avoid incurring unnecessary
costs or imposing undue response burden on the survey population, it should eliminate all irrelevant items
that do not directly relate back to the survey’s objectives.
In a later step, this description of survey content must be transformed into questions and a questionnaire.
For more details, see Chapter 5 - Questionnaire Design.
2.1.5 The Analysis Plan (Proposed Tabulations)
Once all of the items to be measured have been identified, the next task is to determine how much detail
is required for each item and the format of the results. What measures, counts, indices, etc. are needed?
26.
SURVEY METHODS ANDPRACTICES
STATISTICS CANADA
14
Are estimates for subpopulations required? The detailed plan of the way the data are to be analysed and
presented is referred to as the analysis plan and, in addition to planned analyses, requires the creation of
proposed tabulations. An analysis plan greatly facilitates the design of the questionnaire.
For example, with respect to the details of the final results, is it necessary to be able to distinguish
between different age groups within seniors? Does the client need to distinguish between men and
women, or between different types of transportation (bus, car, bicycle, etc.)? Should continuous or
categorical data be used? For example, does the client need to know what a senior’s exact income is, or is
a range of incomes adequate? (If the client is interested in calculating averages, then exact income is more
appropriate.)
Note that the analysis plan can involve going back to and refining the operational definitions and survey
content. For the RTA example, here are some possibilities for the level of detail of the results, in
increasing order of detail:
Household income:
- household income ranges (e.g., less than $15,000; $15,000 to $29,999; $30,000 to $49,999; etc.);
- the exact number representing total household income;
- the exact income from each source (wages or salary, pensions, investments).
Disabilities:
- a single question on whether the senior has a physical condition that limits his/her ability to take local
trips;
- a single question on each of several distinct disabilities;
- a series of questions to be used to determine the presence, nature and severity of each disability.
Household composition:
- senior lives alone / does not live alone;
- number of people in the household;
- categories of households (single, couple, two related adults other than couples, three or more related
adults, etc.);
- each adult’s age and relationship to a reference person, in order to derive the exact household
composition.
Number of trips last week:
- ranges (e.g., 0-3, 4-6, etc.);
- the exact number;
- the exact number by day and time of day.
Frequency of travel:
- the percentage of trips on weekdays or weekends;
- the exact number of trips taken on each day of the week.
Modes of transportation used:
- mode used most often during the reference period (e.g., last week);
- all modes of transportation used (public and private);
- number of trips on public buses only;
- for each trip taken, the mode of transportation that was used.
Problems using public buses:
- factor causing the most difficulty;
27.
FORMULATION OF THESTATEMENT OF OBJECTIVES
STATISTICS CANADA
15
- all factors causing difficulty;
- a ranking of the factors according to difficulty caused;
- for each factor, a measure of how much difficulty it causes.
In the cases presented above, the first, least detailed, breakdown may be sufficient, or it may not contain
enough detail to meet the client’s needs for information. The last, most detailed breakdown may contain
exactly the right amount of detail, or it may be excessively detailed, and in fact be too difficult to answer.
While detailed information provides greater flexibility for analysis and may permit comparison with other
information sources, the statistical agency should always try to ask for information that is detailed enough
to meet the analysis needs, but no more, to avoid burdening respondents.
It is a good idea to prepare a preliminary set of proposed tabulations and other key desired outputs.
Determining how the results are to be presented helps define the level of detail and indeed the whole
scope of the survey. Without a clear analysis plan, it may be possible at the end of the survey to generate
hundreds of analysis tables, but only a few may relate directly to the survey’s objectives.
The proposed tabulations should specify each variable to be presented in a table and its categories. The
purpose of this step is to create and retain mock-ups of those tables that will form the analysis.
Specification at this level allows the statistical agency to begin drafting questions for the survey
questionnaire.
For example, for the RTA survey, the population could be partitioned into two or more groups (e.g., to
compare seniors with a disability to seniors without a disability).
Single item summaries (frequency distributions, means, medians, etc.) could be produced, such as:
- percentage of trips taken on each day of the week (Table 1);
- average number of trips taken on public buses;
- average amount of money spent on transportation last week;
- percentage of seniors by most frequent reason for trip.
Table 1: Trips Taken by Day of the Week
Day of Week Number of Trips % of Total Trips
Sunday
Monday
Tuesday
Wednesday
Thursday
Friday
Saturday
Total
Cross tabulations of possible interest could include:
- number of trips by mode of transportation (Table 2);
- number of buses taken by starting and ending points;
- distribution of reasons for not using public transportation by characteristic of person (e.g., disabled,
etc.).
Other relationships that could be investigated include:
- average amount spent on transportation for each income group;
- median income of housebound seniors.
28.
SURVEY METHODS ANDPRACTICES
STATISTICS CANADA
16
Table 2: Number of Trips by Mode of Transportation
Mode of Transportation Number of Trips % of Total Trips
Public transportation
Bus
Subway
Other
Private transportation
Car/truck
Bicycle
Walk
Other
Total
2.2 Constraints that Affect the Statement of Objectives
There are many requirements and constraints that can affect a survey’s Statement of Objectives. One
relates to the quality of the estimates. How precise should the survey results be? This refers to the
magnitude of sampling error that is acceptable for the most important variables. Precise, detailed results
often require very large samples, sometimes larger than the client can afford. As a result, the client may
decide to relax the precision requirements or produce more aggregate, less detailed data.
Factors affecting precision, and therefore the sample size, include the following:
- the variability of the characteristic of interest in the population;
- the size of the population;
- the sample design and method of estimation;
- the response rate.
In addition, operational constraints influence precision. Sometimes, these are the most influential factors:
- How large a sample can the client afford?
- How much time is available for development work?
- How much time is available to conduct the entire survey?
- How quickly are the results required after collection?
- How many interviewers are needed? How many interviewers are available?
- How many computers are available? Are computer support staff available?
Precision is discussed in more detail in Chapter 3 - Introduction to Survey Design, Chapter 6 -
Sample Designs, Chapter 7 - Estimation and Chapter 8 - Sample Size Determination and Allocation.
Other factors that impact the Statement of Objectives include:
- Can the required variables be measured with the available techniques?
- Will acquiring the desired results be too much of a burden on the respondents?
- Could confidentiality of the respondent be compromised given the level of detail of the disseminated
results?
- Will the survey have any negative consequences on the reputation of the survey agency?
These considerations are all aspects of planning a survey. See Chapter 13 - Survey Planning and
Management for more details.
29.
FORMULATION OF THESTATEMENT OF OBJECTIVES
STATISTICS CANADA
17
2.3 Summary
Without a clear idea of the information needs, the statistical agency risks tackling the wrong problem,
producing incomplete or irrelevant results and wasting time and resources; the survey’s activities could
simply annoy or inconvenience many respondents, without producing any useful information. For these
reasons, the survey’s objectives must be clearly defined during the planning phase.
The following list summarises the most important questions and items to be considered when developing
a survey’s objectives and information needs:
- What are the overall information needs of the survey?
- Who will use the data and how will they use it?
- What definitions will be used by the survey?
- What are the specific topic areas to be covered by the survey?
- Has an analysis plan with proposed tabulations been prepared?
- What is the required precision of the estimates?
- What are the operational constraints?
Formulation of the survey’s objectives may continue to be refined during the design and development of,
particularly, the questionnaire (see Chapter 5 - Questionnaire Design).
Bibliography
Brackstone, G.J. 1991. Shaping Statistical Services to Satisfy User Needs. Statistical Journal of the
United Nations, ECE 8: 243-257.
Brackstone, G.J. 1993. Data Relevance: Keeping Pace with User Needs. Journal of Official Statistics, 9:
49-56.
Fink, A. 1995. The Survey Kit. Sage Publications, California.
Fowler, F.J. 1984. Survey Research Methods. 1. Sage Publications, California.
Kish, L. 1965. Survey Sampling. John Wiley and Sons, New York.
Levy, P. and S. Lemeshow. 1991. Sampling of Populations. John Wiley and Sons, New York.
Moser C.A. and G. Kalton. 1971. Survey Methods in Social Investigation. Heinemann Educational Books
Limited, London.
Satin, A. and W. Shastry. 1993. Survey Sampling: A Non-Mathematical Guide – Second Edition,
Statistics Canada. 12-602E.
Statistics Canada. 1998. Policy on Standards. Policy Manual. 2.10.
30.
E L EC T R O N I C P U B L I C A T I O N S
A V A I L A B L E A T
www.statcan.gc.ca
31.
STATISTICS CANADA
19
Chapter 3- Introduction to Survey Design
3.0 Introduction
Once the survey’s objectives have been clearly defined, the survey design needs to be considered. Some
key questions here are: should a sample survey or a census be conducted? Can the population that the
client is interested in be surveyed? What might be the principal sources of error in the survey and what
impact could these errors have on the results?
The decision of whether to conduct a census or a sample survey is based on numerous factors including:
the budget and resources available, the size of the population and subpopulations of interest, and the
timeliness of the survey results.
The survey frame ultimately defines the population to be surveyed, which may be different from the
population targeted by the client. Before deciding upon a particular frame, the quality of various potential
frames should be assessed, in particular to determine which one best covers the target population.
A survey is subject to two types of errors: sampling error and nonsampling errors. Sampling error is
present only in sample surveys. Nonsampling errors are present in both sample surveys and censuses and
may arise for a number of reasons: the frame may be incomplete, some respondents may not accurately
report data, data may be missing for some respondents, etc.
The purpose of this chapter is to introduce these key survey design considerations. For more information
on how to design a sample survey, see Chapter 6 - Sample Designs.
3.1 Census versus Sample Surveys
There are two kinds of surveys – census and sample surveys. The difference lies in the fact that a census
collects information from all units of the population, while a sample survey collects information from
only a fraction (typically a very small fraction) of units of the population. In both cases, the information
collected is used to calculate statistics for the population as a whole and, usually, for subgroups of the
population.
The main reason for selecting a sample survey over a census is that sample surveys often provide a faster
and more economical way of obtaining information of sufficient quality for the client’s needs. Since a
sample survey is a smaller scale operation than a census, it is also easier to control and monitor. However,
in some cases, a census may be preferable or necessary. (For a formal definition of quality, see Appendix
B - Quality Control and Quality Assurance).
The following list covers the most important factors when deciding between a census and a sample
survey:
i. Survey errors
There are two types of survey errors – sampling error and nonsampling errors.
Sampling error is intrinsic to all sample surveys. Sampling error arises from estimating a population
characteristic by measuring only a portion of the population rather than the entire population.
32.
SURVEY METHODS ANDPRACTICES
STATISTICS CANADA
20
Sampling error is usually measured by estimating the extent to which sample estimates, based upon all
possible samples of the same size and using the same method of sampling (sample design), differ from
one another. The magnitude of the sampling error can be controlled by the sample size (it decreases as the
sample size increases), the sample design and the method of estimation.
A census has no sampling error since all members of the population are enumerated. It might seem that
results from a census should be more accurate than results from a sample survey. However, all surveys
are subject to nonsampling errors – all errors that are unrelated to sampling, censuses even more so
than sample surveys, because sample surveys can often afford to allocate more resources to reducing
nonsampling errors. These errors can lead to biased survey results. Examples of nonsampling errors are
measurement errors and processing errors.
See Section 3.4 for more details on sources of survey errors. See Chapter 7 - Estimation and Chapter
11 - Analysis of Survey Data for details on how to calculate sampling error.
ii. Cost
Since all members of the population are surveyed, a census costs more than a sample survey (data
collection is one of the largest costs of a survey). For large populations, accurate results can usually be
obtained from relatively small samples. For example, each month approximately 130,000 residents are
surveyed by the Canadian Labour Force Survey. With the Canadian population at approximately 30
million, this corresponds to a sample size of less than 0.5% of the population. Conducting a census would
be considerably more expensive.
iii. Timeliness
Often the data must be gathered, processed and results disseminated within a relatively short time frame.
Since a census captures data for the entire population, considerably more time may be required to carry
out these operations than for a sample survey.
iv. Size of the population
If the population is small, a census may be preferable. This is because in order to produce estimates with
small sampling error it may be necessary to sample a large fraction of the population. In such cases, for
minimal additional cost, data can be available for the entire population instead of just a portion of it. By
contrast, for large populations, a census is very expensive, so a sample survey is usually preferable.
For more details on factors affecting sample size, see Chapter 8 - Sample Size Determination and
Allocation.
v. Small area estimation
Related to the previous point, when survey estimates are required for small geographic areas, or areas
with small populations, a census may be preferable. For example, a national survey may be required to
produce statistics for every city in the country. A sample survey could provide national statistics with
small sampling error, but depending on the sample size, there may be too few respondents to produce
estimates with small sampling error for all cities. Since a census surveys everyone and has no sampling
error, it can provide estimates for all possible subgroups in the population.
33.
INTRODUCTION TO SURVEYDESIGN
STATISTICS CANADA
21
It is not always necessary to conduct either a census or a sample survey. Sometimes the two are
combined. For small area estimates, for example, a sample survey could be conducted in the larger cities
and a census in the smaller cities.
vi. Prevalence of attributes
If the survey is to estimate the proportion of the population with a certain characteristic, then if the
characteristic is common, a sample survey should be sufficient. But if the characteristic is rare, a census
may be necessary. This is related to the size of the subpopulation with the characteristic.
For example, suppose that the client wishes to determine the percentage of senior citizens in the
population and believes this percentage to be around 15%. A sample survey should be able to estimate
this percentage with small sampling error. However, for rarer attributes, occurring in less than 1% of the
population, a census might be more appropriate. (This assumes that the survey frame cannot identify such
individuals in advance.)
It is possible, of course, that prior to conducting the survey, absolutely nothing is known about the
prevalence of the attribute in question. In this case it is advisable to conduct a preliminary study – a
feasibility study or pilot survey.
vii. Specialised needs
In some instances, the information required from a survey cannot be directly asked of a respondent, or
may be burdensome for the respondent to provide. For example, a health survey may require data on
blood pressure, blood type, and the fitness level of respondents, which can only be accurately measured
by a trained health professional. If the nature of the data collected requires highly trained personnel or
expensive measuring equipment or places a lot of burden on the respondents, it may be impossible to
conduct a census. In some specific fields (quality control in a manufacturing process, for example), the
destructive nature of certain tests may dictate that a sample survey is the only viable option.
viii. Other factors
There are other reasons to conduct a census. One is to create a survey frame. For example, many countries
conduct a census of the population every five or ten years. The data generated by such a census can be
used as a survey frame for subsequent sample surveys that use the same population.
Another reason to conduct a census is to obtain benchmark information. Such benchmark information
may be in the form of known counts of the population, for example, the number of men and women in the
population. This information can be used to improve the estimates from sample surveys (see Chapter 7 -
Estimation).
3.2 Target and Survey Populations
Chapter 2 - Formulation of the Statement of Objectives presented how to define concepts and
operational definitions. It stated that one of the first concepts to be defined is the target population – the
population for which information is desired.
The following factors are essential in defining the target population and operational definitions in general:
34.
SURVEY METHODS ANDPRACTICES
STATISTICS CANADA
22
- the type of units that comprise the population and the defining characteristics of those units (Who or
What?);
- the geographical location of the units (Where?);
- the reference (time) period under consideration (When?).
In order to define the target population, the statistical agency begins with a conceptual population for
which no actual list may exist. For example, the conceptual population may be all farmers. In order to
define the target population, ‘farmers’ must be defined. Is a person with a small backyard garden a
farmer? What is the distinction between a farmer and a casual gardener? What if the farm operator did not
sell any of his products? The target population might ultimately be defined as all farmers in Canada with
revenues above a certain amount in a given reference year.
The survey population is the population that is actually covered by the survey. It may not be the same as
the target population, though, ideally, the two populations should be very similar. It is important to note
that conclusions based on the survey results apply only to the survey population. For this reason, the
survey population should be clearly defined in the survey documentation.
Various reasons can explain the differences between the two populations. For example, the difficulty and
high cost of collecting data in isolated regions may lead to the decision to exclude these units from the
survey population. Similarly, members of the target population who are living abroad or are
institutionalised may not be part of the survey population if they are too difficult or costly to survey.
The following examples illustrate the differences that can occur between the target population and the
survey population.
Example 3.1:
Survey of Household Income and Expenditures
Target population: Entire resident population of Canada on April 30, 1997.
Survey population: Population of Canada on April 30, 1997, excluding people living in institutions
or with no fixed address.
For this survey, it was decided that it would be too difficult to survey people with no fixed address (it has
been attempted with little success). In addition, institutionalised people may not be mentally or physically
able to respond to questions. Many of these people may not be willing to respond, and even if they were
willing often the questions asked are not applicable to their situation which could require the development
of modified survey instruments. Also, special arrangements would be necessary to gain access to selected
institutions.
3.3 Survey Frame
Once the client and statistical agency are satisfied with the definition of the target population, some
means of accessing the units of the population is required. The survey frame (also called the sampling
frame when applied to sample surveys) provides the means of identifying and contacting the units of the
survey population. This frame ultimately defines the survey population: if the survey frame does not
include unlisted telephone numbers, for example, then neither does the survey population.
35.
INTRODUCTION TO SURVEYDESIGN
STATISTICS CANADA
23
Example 3.2:
Census of Manufacturing
Target population: All manufacturing establishments operating in Canada in April 2002.
Survey population: All manufacturing establishments with employees operating in Canada in April
2002.
Manufacturing establishments may be owner operated, with or without employees. In this example, the
only frame available is for establishments with employees, so those without employees are excluded from
the survey population.
(Note that often the target population is redefined to correspond to the population that can be practically
surveyed. This is the approach used throughout the rest of this manual: the target population refers to the
population that the survey expects to cover, given practical and operational constraints and the survey
frame used.)
In addition to being the vehicle for accessing the survey population units, another reason why a frame is
required is that, for sample surveys, the statistical agency must be able to calculate the inclusion
probability that a population unit is in the sample. If probability sampling is used, these probabilities
make it possible to draw conclusions about the survey population – which is the purpose of conducting
the survey. (See Chapter 6 - Sample Designs for a definition of probability sampling.)
Note that reference has been made to units in a survey. Three different types of units exist:
- the sampling unit (the unit being sampled);
- the unit of reference (the unit about which information is provided);
- the reporting unit (the unit that provides the information).
For some surveys, these are all the same; often they are not. For example, for a survey of children, it may
not be practical for the unit of reference – a child – to be the reporting unit. A common sample design for
household surveys is to use a frame that lists households in the survey population (such a frame may
provide the best coverage of all children in the target population). A survey using such a frame would
sample households and ask a parent to report for the unit of analysis, the child.
The survey frame should include some or all of the following items:
i. Identification data
Identification data are the items on the frame that uniquely identify each sampling unit, for example:
name, exact address, a unique identification number.
ii. Contact data
Contact data are the items required to locate the sampling units during collection, for example: mailing
address or telephone number.
iii. Classification data
Classification data are useful for sample selection and possibly for estimation. For example, if people
living in apartments are to be surveyed differently than people living in houses, then the frame must
36.
SURVEY METHODS ANDPRACTICES
STATISTICS CANADA
24
classify different types of dwellings (i.e. apartments, single homes, etc.). Classification data may also
include a size measure to be used in sampling, for example the number of employees working at a
business or the number of acres owned by a farm. Other examples of classification data are: geographical
classification (e.g. province, census division or census subdivision), standard occupational classification
(SOC) or standard industrial classification (e.g. SIC or the North American Industrial Classification
System, NAICS).
iv. Maintenance data
Maintenance data are required if the survey is to be repeated at another time, for example: dates of
additions or changes to data on the frame.
v. Linkage data
Linkage data are used to link the units on the survey frame to a more up-to-date source of data, for
example, to update the survey frame.
In summary, the survey frame is a set of information, which serves as a means of access to select units
from the survey population. As a minimum, identification and contact data are necessary to conduct the
survey. However, classification, maintenance and linkage data are also desirable. Apart from being a
sampling tool, it will be shown in subsequent chapters that data on the frame can be used to edit and
impute missing or inconsistent data and to improve sampling and estimation.
Details of sample designs are covered in Chapter 6 - Sample Designs. Estimation is addressed in
Chapter 7 - Estimation. Editing and imputation are covered in Chapter 10 - Processing.
3.3.1 Types of Frames
There are two main categories of frames: list and area frames. When no one frame is adequate, multiple
frames may be used.
3.3.1.1 List Frame
A list frame can be defined as a conceptual list or a physical list of all units in the survey population. A
conceptual list frame is often based on a population that comes into existence only when the survey is
being conducted. An example of a conceptual list frame is a list of all vehicles that enter the parking lot of
a shopping centre between 9:00 a.m. and 8:00 p.m. on any given day.
Physical list frames – actual lists of population units – can be obtained from different sources. Lists are
kept by various organisations and levels of government for administrative purposes. Such administrative
data are often the most efficient sources of frame maintenance data. Examples of list frames are:
- Vital statistics register (e.g., a list of all births and or deaths in the population);
- Business register (e.g., a list of all businesses in operation);
- Address register (e.g., a list of households with civic addresses);
- Telephone directory (i.e., a list of all households with published telephone numbers);
- Customer or client lists (i.e., a list of all customers or clients of a business);
- Membership lists (i.e., a list of all members of an organisation).
When using administrative data to build a list frame, the following factors should be considered:
37.
INTRODUCTION TO SURVEYDESIGN
STATISTICS CANADA
25
i. Cost
Administrative sources often provide an inexpensive starting point for constructing the frame. They are
also a source of information for updating the frame.
ii. Coverage
The administrative source should adequately cover the target population.
iii. Up-to-date
It is important to consider how up-to-date the administrative information is. The time it takes to process
the updates and the delay before they are available to the statistical agency should be considered as they
might be the deciding criteria as to whether or not a specific administrative source should be used.
iv. Definitions
The definitions used by the administrative source should correspond as closely as possible to the concepts
of the survey. For example, the definition of a dwelling or a business may be different from that used by
the survey.
v. Quality
The quality of the data provided by the administrative source should meet the overall quality standards of
the survey. (For example, if the administrative data have a high edit failure rate, the statistical agency may
decide that the data are of insufficient quality. For more details on editing, see Chapter 10 - Processing)
vi. Stability of source information
When administrative sources are used to construct a frame, the set of variables provided by the source
should be as stable as possible through time. Changes in concepts, classifications, or in content at the
source can lead to serious problems in frame maintenance.
vii. Legal and formal relationships
Ideally, there should be a relationship (for example, a signed contract) between the statistical agency and
the source providing the administrative information. This may be important to ensure confidentiality of
the data. It is also important to ensure an open dialogue and to foster co-operation between the two
partners.
viii. Documentation
The data files should be documented with respect to the variables they contain and their layout. This is
particularly important if files are held in different jurisdictions.
ix. Accessibility/Ease of use
Is the information available electronically? How is the information organized? Do different lists have to
be combined before they can be used?
For more information on the use of administrative data, see Appendix A - Administrative Data.
38.
SURVEY METHODS ANDPRACTICES
STATISTICS CANADA
26
3.3.1.2 Area Frame
An area frame is a special kind of list frame where the units on the frame are geographical areas. The
survey population is located within these geographic areas. Area frames may be used either when the
survey is geographic in nature (such as measuring wildlife populations by counting the number of animals
per square kilometre) or when an adequate list frame is unavailable, in which case the area frame can be
used as a vehicle for creating a list frame. An inadequate list frame is often a problem. This is because
populations can change over time – units are born, die, move or change name, composition or character –
so any list can become out of date. Geographic boundaries, however, are more stable, often making it
easier to maintain an area frame.
Area frames are usually made up of a hierarchy of geographical units. Frame units at one level can be
subdivided to form the units at the next level. Large geographic areas like provinces may be composed of
districts or municipalities with each of these further divided into smaller areas, such as city blocks. In the
smallest sampled geographical areas, the population may be listed in order to sample units within this
area.
Sampling from an area frame is often performed in several stages. For example, suppose that a survey
requires that dwellings in a particular city be sampled, but there is no up-to-date list. An area frame could
be used to create an up-to-date list of dwellings as follows: at the first stage of sampling, geographic areas
are sampled, for example, city blocks. Then, for each selected city block, a list frame is built by listing all
the dwellings in the sampled city blocks. At the second stage of sampling, a sample of dwellings is then
selected. One benefit of such an approach is that it keeps the cost of creating the survey frame within
reasonable bounds and it concentrates the sample in a limited number of geographic areas, making it a
cost-effective way of carrying out personal interview surveys.
It is important that the geographical units to be sampled on an area frame be uniquely identifiable on a
map and that their boundaries be easily identifiable by the interviewers. For this reason, city blocks, main
roads and rivers are often used to delineate the boundaries of geographical units on an area frame.
Sampling from area frames is discussed in more detail in Chapter 6 - Sample Designs. Listing for an
area frame is discussed in Chapter 9 - Data Collection Operations.
3.3.1.3 Multiple Frame
A multiple frame is a combination of two or more frames, (a combination of list and area frames or of
two or more list frames).
Multiple frames are typically used when no single frame can provide the required coverage of the target
population. For example, the Canadian Community Health Survey (CCHS) uses the Labour Force
Survey’s (LFS) area frame plus a random digit dialling (RDD) frame.
The main advantage of a multiple frame is that it can provide better coverage of the target population.
However, one of its main disadvantages is that it can result in the same sampling unit appearing several
times on the frame. Ideally, a unit should only appear on one of the frames used to construct the multiple
frame. In practice, though, a unit often appears on more than one of these frames. There are several ways
to handle overlap between component frames:
- remove overlap during frame creation;
- resolve the problem during sample selection (or in the field);
- correct the problem at estimation.
39.
INTRODUCTION TO SURVEYDESIGN
STATISTICS CANADA
27
For more information on this advanced subject, see Bankier (1986). For more information on RDD, see
Chapter 4 - Data Collection Methods.
3.3.2 Frame Defects
Several potential frame defects are described below:
i. Undercoverage
Undercoverage results from exclusions from the frame of some units that are part of the target population.
Often, this is due to a time lag in processing the data that were used to construct the frame. Between the
time the frame is completed and the survey is conducted, some new units are ‘born’ into the population.
Any unit that joins the target population after the frame has been completed has no chance of being
selected by the survey. This leads to underestimation of the size of the target population and may bias the
estimates. Procedures are required to measure the extent of undercoverage and, if necessary, correct for it.
ii. Overcoverage
Overcoverage results from inclusions on the frame of some units that are not part of the target population.
This is often due to a time lag in the processing of frame data. Between the time the frame is completed
and the survey is conducted, some units in the population ‘die’ (a unit has died if it is no longer part of the
target population). Any unit that is on the frame – including these out-of-scope dead units – has a chance
of being selected by the survey. Unless such units are properly classified on the frame as out-of-scope, the
sampling strategy may be less statistically efficient and the results may be biased.
iii. Duplication
Duplication occurs when the same unit appears on the frame more than once. For example, on a business
frame, the same business could be listed once under its legal name and once under its trading name. This
is often a problem with multiple frames. Duplication tends to result in an overestimation of the size of the
target population and may cause some bias in the estimates. Often, duplicate units are only detected
during the collection stage of a survey.
iv. Misclassification
Misclassification errors are incorrect values for variables on the frame. Examples might be a man who is
incorrectly classified as a woman, or a retail business that is classified as a wholesaler. This can result in
inefficient sampling. It can also lead to undercoverage (or overcoverage) since if, for example, only
retailers are sampled, then those misclassified as wholesalers will be missed. Errors in identification or
contact data can lead to difficulties tracing the respondent during collection.
For information on statistical efficiency and sample designs, see Chapter 6 - Sample Designs.
3.3.3 Qualities of a Good Frame
What constitutes a good frame? The quality of a frame should be assessed based on four criteria:
40.
SURVEY METHODS ANDPRACTICES
STATISTICS CANADA
28
i. Relevance
Relevance should be measured as the extent to which the frame corresponds and permits accessibility to
the target population. The more it differs from the target population, the larger the difference between the
survey and target populations. The degree to which it allows the comparison of data results across
different survey programs should also be evaluated. Also, the utility of the frame for other surveys
covering the same target population is a critical measure of its relevance.
ii. Accuracy
Accuracy should be assessed with respect to different characteristics. First, coverage errors should be
evaluated (undercoverage, overcoverage and duplication). What is the extent of missing, out-of-scope or
duplicate units on the frame? Second, classification errors should be investigated. Are all units classified?
If so, are they properly classified? Close attention should be paid to the contact data. Is it complete? If so,
is it correct and accurate? The impact of the accuracy of the data will be felt during the collection and the
processing stages of the survey. Accuracy of the data on the frame greatly affects the quality of the
survey’s output.
iii. Timeliness
Timeliness should be measured in terms of how up-to-date the frame is with respect to the survey’s
reference period. If the information on the frame is substantially out-of-date (due to the source of the data
used to create the frame, or due to the length of time necessary to build the frame), then some measures
have to be implemented in order to improve timeliness.
iv. Cost
Cost can be measured in different ways. First, the total costs incurred to obtain and construct the frame
should be determined. Second, the cost of the frame should be compared to the total survey cost. Third,
the cost of maintaining the frame should be compared to the total survey program budget. To improve
their cost effectiveness, frames are often used by several surveys.
In addition to these important criteria, the following features are also desirable:
a. Standardised concepts and procedures
The information present on the frame should use standardised concepts, definitions, procedures and
classifications that are understood by the client and the data user. This is especially important if these
concepts, definitions, procedures and classifications are used by other surveys. The frame should also
permit stratification that is efficient (statistically and in terms of the cost of collection).
b. The frame should be easy to update using administrative and survey sources.
This is a way of ensuring that it remains up-to-date and its coverage complete.
c. The frame should be easy to use.
Few frames meet all of the above requirements. The goal is to pick the frame that best meets these
criteria. It is important to realise that the survey frame has a direct impact on many steps of the survey.
For instance, it affects the method of data collection. If the frame does not provide telephone numbers,
41.
INTRODUCTION TO SURVEYDESIGN
STATISTICS CANADA
29
then telephone interviews cannot be conducted. It also affects the method of sampling. And, of course, the
quality of the frame has an impact on the final survey results.
3.3.4 Tips and Guidelines
In order to choose and make the best use of the frame, the following tips and guidelines are useful:
i. When deciding which frame to use (if several are available), assess different possible frames at
the planning stage of the survey for their suitability and quality.
ii. Avoid using multiple frames, whenever possible. However, when no single existing frame is
adequate, consider a multiple frame.
iii. Use the same frame for surveys with the same target population or subset of the target population.
This avoids inconsistencies across surveys and reduces the costs associated with frame
maintenance and evaluation.
iv. Incorporate procedures to eliminate duplication and to update for births, deaths, out-of-scope
units and changes in any other frame information in order to improve and/or maintain the level of
quality of the frame.
v. Incorporate frame updates in the timeliest manner possible.
vi. Emphasise the importance of coverage, and implement effective quality assurance procedures on
frame-related activities. This helps minimise frame errors.
vii. Monitor the quality of the frame coverage periodically by matching to alternate sources and/or by
verifying information during data collection.
viii. Determine and monitor coverage of administrative sources through contact with the source
manager, in particular when these sources are outside the control of the survey.
ix. Include descriptions of the target and survey population, frame and coverage in the survey
documentation.
x. Implement map checks for area frames, through field checks or by using other map sources, to
ensure clear and non-overlapping delineation of the geographic areas used in the sampling design.
3.4 Survey Errors
In a perfect world, it would be possible to select a perfect sample and design a perfect questionnaire, it
would also be possible to have perfect interviewers gather perfect information from perfect respondents.
And no mistakes would be made recording the information or converting it into a form that could be
processed by a computer.
Obviously, this is not a perfect world and even the most straightforward survey encounters problems.
These problems, if not anticipated and controlled, can introduce errors to the point of rendering survey
results useless. Therefore, every effort should be made in the planning, design and development phases of
42.
SURVEY METHODS ANDPRACTICES
STATISTICS CANADA
30
the survey to anticipate survey errors and to take steps to prevent them. And during the implementation
phase, quality control techniques should be used to control and minimise the impact of survey errors. For
a discussion of quality control and quality assurance, see Appendix B - Quality Control and Quality
Assurance.
Survey errors come from a variety of different sources. They can be classified into two main categories:
sampling error and nonsampling error.
3.4.1 Sampling Error
Sampling error was defined earlier as the error that results from estimating a population characteristic by
measuring a portion of the population rather than the entire population. Since all sample surveys are
subject to sampling error, the statistical agency must give some indication of the extent of that error to the
potential users of the survey data. For probability sample surveys, methods exist to calculate sampling
error. These methods derive directly from the sample design and method of estimation used by the survey.
The most commonly used measure to quantify sampling error is sampling variance. Sampling variance
measures the extent to which the estimate of a characteristic from different possible samples of the
same size and the same design differ from one another. For sample designs that use probability
sampling, the magnitude of an estimate’s sampling variance can be estimated on the basis of observed
differences of the characteristic among sampled units (i.e. based on differences observed in the one
sample obtained). The estimated sampling variance thus depends on which sample was selected and
varies from sample to sample. The key issue is the magnitude of an estimate’s estimated sampling
variance relative to the size of the survey estimate: if the variance is relatively large, then the estimate has
poor precision and is unreliable.
Factors affecting the magnitude of the sampling variance include:
i. The variability of the characteristic of interest in the population
The more variable the characteristic in the population, the larger the sampling variance.
ii. The size of the population
In general, the size of the population only has an impact on the sampling variance for small to moderate
sized populations.
iii. The response rate
The sampling variance increases as the sample size decreases. Since nonrespondents effectively decrease
the size of the sample, nonresponse increases the sampling variance. Nonresponse can also lead to bias
(see 3.4.2.3).
iv. The sample design and method of estimation
Some sample designs are more efficient than others in the sense that, for the same sample size and
method of estimation, one design can lead to smaller sampling variance than another.
For more details on how to estimate sampling variance, see Chapter 7 - Estimation, Chapter 8 -
Sample Size Determination and Allocation and Chapter 11 - Analysis of Survey Data. For a
43.
INTRODUCTION TO SURVEYDESIGN
STATISTICS CANADA
31
discussion of bias and mean square error, see Chapter 11 - Analysis of Survey Data. For details on
sample designs and probability sampling, see Chapter 6 - Sample Designs.
3.4.2 Nonsampling Errors
Aside from sampling error, a survey is also subject to a wide variety of errors not related to the process of
sampling. These errors are commonly called nonsampling errors. Nonsampling errors can be defined as
errors arising during the course of virtually all survey activities, apart from sampling. They are present
in both sample surveys and censuses (unlike sampling error, which is only present in sample surveys).
Nonsampling errors can be classified into two groups:
i. Random errors
Random errors are errors whose effects approximately cancel out if a large enough sample is used,
leading to increased variability.
ii. Systematic errors
Systematic errors are errors that tend to go in the same direction and thus accumulate over the entire
sample, leading to a bias in the final results. Unlike sampling variance or random errors, this bias is not
reduced by increasing the size of the sample. Systematic errors are the principal cause of concern in terms
of a survey’s data quality. Unfortunately, nonsampling errors are often extremely difficult and sometimes
impossible to measure.
Nonsampling errors arise primarily from the following sources:
- coverage;
- measurement;
- nonresponse;
- processing.
3.4.2.1 Coverage Error
Coverage errors consist of omissions, erroneous inclusions, duplications and misclassifications of units
in the survey frame. Since they affect every estimate produced by the survey, they are one of the most
important types of error; in the case of a census they may be the main source of error. Coverage errors
may cause a bias in the estimates and the effect can vary for different sub-groups of the population. These
errors tend to be systematic and are usually due to undercoverage, which is why statistical agencies try to
reduce their incidence as much as possible.
3.4.2.2 Measurement Error
Measurement error is the difference between the recorded response to a question and the ‘true’ value.
It can be caused by the respondent, the interviewer, the questionnaire, the data collection method or the
measuring tool.
One of the main causes of measurement error is misunderstanding on the part of the respondent or
interviewer. Misunderstanding may result from:
- the use of technical jargon;
44.
SURVEY METHODS ANDPRACTICES
STATISTICS CANADA
32
- the lack of clarity of the concepts (i.e., use of non-standard concepts);
- poorly worded questions;
- inadequate interviewer training;
- false information given (i.e., recall error, or lack of ready sources of information);
- a language barrier;
- poor translation (when several languages are used).
The method of data collection can also affect measurement error. For example, interviewer-assisted
methods (using well-trained interviewers) can result in smaller measurement error than self-enumeration
methods, where the respondent has no assistance in completing the questionnaire.
In direct measurement surveys, the interviewer collects data through observation or by taking
measurements (e.g. pricing surveys). Here, measurement error may be due to the interviewer or the
measurement tool. For example, in a survey of people’s weight, if the measuring scale is not properly
calibrated, the weights will not be correctly measured.
If the measurement errors are scattered randomly about the true value, this will affect the precision of the
survey’s estimates: as the variability increases, the precision decreases. If the measurement errors are
systematically skewed to reflect certain values or categories, a bias will be introduced and the survey
estimates will be misleading. For example, systematic error would occur if an interviewer were instructed
to measure the height of school children and took these measurements while the children had their shoes
on, in which case all heights would be systematically overestimated.
Note that measurement error is sometimes referred to as response error and the terms are often used
interchangeably. Response error is discussed in detail in Chapter 5 - Questionnaire Design. Methods of
data collection are covered in Chapter 4 - Data Collection Methods.
3.4.2.3 Nonresponse Error
There are two types of nonresponse: item (or partial) nonresponse and total nonresponse. Item
nonresponse occurs when information is provided for only some items, such as when the respondent
responds to only part of the questionnaire. Total nonresponse occurs when all or almost all data for a
sampling unit are missing.
Nonresponse can create several problems in a survey. The main problem is that nonrespondents often
have different characteristics from respondents, which can result in biased survey estimates if
nonresponse is not corrected for properly. For example, in a literacy survey, if most nonrespondents are
illiterate, this could bias the survey results. If the nonresponse rate is high, bias can be so severe as to
invalidate the survey results. The second problem with total nonresponse is that it reduces the effective
size of the sample, since fewer units than expected answered the survey. As a result, the sampling
variance increases and the precision of the estimates decreases. If the response rate can be predicted in
advance, the initial sample size should be inflated accordingly. While increasing the sample size reduces
the sampling variance and therefore corrects for nonresponse that is randomly distributed, it does not
reduce any bias introduced by systematic nonresponse.
Total nonresponse may occur for reasons such as no one being at home, or a refusal or the inability of the
selected person to participate in the survey. A poor explanation as to the purpose of the survey or its
intended use can also result in nonresponse. Poor or out-of-date frame data is another factor: the
identification data of the survey unit might be inadequate to locate it. Also, sometimes a particular unit is
selected for many different surveys or for a repeated survey, and over time refuses to answer the surveys
45.
INTRODUCTION TO SURVEYDESIGN
STATISTICS CANADA
33
due to response burden. Finally, if the respondent data is considered to be unusable, it may be treated as
nonresponse.
Item nonresponse may occur when the respondent does not know the answer to a question, refuses to
answer a question, forgets to answer or follows the wrong flow through the questionnaire. Sometimes the
respondent cannot provide the answer due to an illness or language difficulties. A poorly designed
questionnaire can also lead to item nonresponse. The concepts presented to the respondent on the
questionnaire or during the interview might be difficult to understand or be poorly defined. The interview
might be too long or contain an illogical flow of questions. As a result, respondents may get discouraged
and stop answering before the end of the interview or they might simply follow the wrong flow of
questions.
Interviewers can also contribute to total or item nonresponse. Poor interviewing techniques prevent some
interviewers from establishing a good rapport with the respondent who might as a result refuse to
participate or, if they agree to participate, quickly lose interest in the survey. Some interviewers introduce
item nonresponse errors because they do not follow instructions or do not read the questions as worded.
Finally, data collection procedures can be a source of nonresponse. Nonresponse is often followed-up by
interviewers in order to obtain some responses (e.g. convert a refusal). Inadequate follow-up of
nonrespondents, or follow-up at the wrong time can prevent nonresponse from being corrected. Data lost
from a computer file or a lost questionnaire can also result in ‘nonresponse’ errors. (Lost data, even if the
actual number of cases is small, is a major source of concern because of the potential infringement of the
confidentiality of respondent data.)
For the treatment of total nonresponse, see Chapter 7 - Estimation. For the treatment of item
nonresponse see Chapter 10 - Processing. For details questionnaire design, see Chapter 5 -
Questionnaire Design. For details on field procedures, see Chapter 9 - Data Collection Operations.
3.4.2.4 Processing Error
Processing transforms survey responses obtained during collection into a form that is suitable for
tabulation and data analysis. It includes all data handling activities after collection and prior to
estimation. Since it is a mixture of automated and manual activities, it is time-consuming, resource-
intensive and potentially a source of errors. For example, processing errors can occur during data coding,
data capture, editing or imputation. Like all other errors, they can be random in nature, and inflate the
variance of the survey’s estimates, or systematic, and introduce bias.
Coding is the process of assigning a numerical value to responses to facilitate data capture and
processing in general. Coding entails either assigning a code (e.g. occupation code) to a given response
or comparing the response to a set of codes and selecting the one that best describes the response.
For closed questions (questions with pre-determined response categories), codes are often assigned before
interviewing takes place. For open questions (where the respondent provides the answer in his or her own
words), coding may be either manual or automated. The quality of the coding depends on the
completeness and quality of the response to the open question, and the way in which the answer is coded.
Manual coding of open questions requires interpretation and judgement and hence is subject to error. Two
different coders could code the same answer differently. Inexperienced and poorly trained coders are
particularly prone to making coding errors. In an automated coding operation, errors can result from an
error in the program or because the program may not properly take into account all information that is
46.
SURVEY METHODS ANDPRACTICES
STATISTICS CANADA
34
available. If the coding is programmed and automatically performed, an error in the program will
systematically be repeated and will introduce a bias (e.g. misclassification of occupation).
Data capture is the transformation of responses into a machine-readable format. Data capture errors
result when the data are not entered into the computer exactly as they appear on the questionnaire. This
can be caused by the complexity of alphanumeric data and by the lack of clarity in the answer provided.
The physical layout of the questionnaire itself or the coding documents can cause data capture errors. The
method of data capture may also result in errors (data capture may be a manual operation or it may be
automated, for example, using an optical scanner).
Editing is the application of checks to identify missing, invalid or inconsistent entries that point to data
records that are potentially in error. Imputation is a process used to determine and assign replacement
values to resolve problems of missing, invalid or inconsistent data. Errors arising from editing and
imputation often occur together since these two processes are very closely linked.
Editing and imputation errors can be caused by the poor quality of the original data or by its complex
structure. When the editing and imputation processes are automated, errors can also be the result of faulty
programs that were insufficiently tested. The choice of an inappropriate imputation method can introduce
bias. Errors can also result from incorrectly changing data that were found to be in error, or by
erroneously changing correct data.
Processing errors are often monitored and controlled using quality control techniques. For more details
see Appendix B - Quality Control and Quality Assurance. For more detail on processing activities, see
Chapter 10 - Processing.
3.5 Summary
This chapter presented some key points to consider when planning the design of a survey. The distinction
between a survey and a census was explained as were the advantages and disadvantages of both. Next, the
difference between the target population and the survey population was presented. A section on survey
frames presented different types of frames that can be used in a survey, the qualities of a good frame as
well as defects often encountered and ways to deal with them. Finally, the different types and sources of
errors in a survey were explained. Sampling error was briefly discussed (this will be covered in more
detail in subsequent chapters) while emphasis was placed on nonsampling errors: coverage error,
measurement error, nonresponse error and processing error.
How to plan and manage a survey in general, including the stages of survey planning, will be presented in
Chapter 13 - Survey Planning and Management. How to design how the sample should be selected
from the population is presented in Chapter 6 - Sample Designs.
Bibliography
Bankier, M. 1986. Estimators Based on Several Stratified Samples with Applications to Multiple Frame
Surveys. Journal of the American Statistical Association, 81-396.
Biemer, P.P., R.M. Groves, L.E. Lyberg, N.A. Mathiowetz and S. Sudman, eds. 1991. Measurement
Errors in Surveys. John Wiley and Sons, New York.
47.
INTRODUCTION TO SURVEYDESIGN
STATISTICS CANADA
35
Cialdini, R., M. Couper and R.M. Groves. 1992. Understanding the Decision to Participate in a Survey.
Public Opinion Quarterly, 56: 475-495.
Cox, B.G., D.A. Binder, B.N. Chinnappa, A. Christianson, M.J. Colledge, P.S. Kott, eds. 1995. Business
Survey Methods. John Wiley and Sons, New York.
Food and Agriculture Organization of the United Nations (FAO). 1996. Multiple Frame Agriculture
Surveys. Volume 1: Current Surveys Based on Area and List Sampling Methods. FAO, Rome.
Fuller, W. 1987. Measurement Error Models. John Wiley and Sons, New York.
Gosselin, J.-F., B.N. Chinnappa, P.D. Ghangurde and J. Tourigny. 1978. Coverage. A Compendium of
Methods of Error Evaluation in Censuses and Surveys. Statistics Canada. 13-546E: 7-9.
Groves, R.M. 1989. Survey Errors and Survey Costs. John Wiley and Sons, New York.
Hartley, H.O. 1962. Multiple Frame Surveys. Proceedings of the Social Statistics Section. American
Statistical Association. 203-206.
Laniel, N. and H. Finlay. 1991. Data Quality Concerns with Sub-Annual Business Survey Frames.
Proceedings of the Section on Survey Research Methods. American Statistical Association. 202-
207.
Lessler, J.T. and W.D. Kalsbeek, 1992. Nonsampling Errors in Surveys. John Wiley and Sons, New York.
Linacre, S.J. and D.J. Trewin. 1989. Evaluation of Errors and Appropriate Resource Allocation in
Economic Collections. Proceedings of the Annual Research Conference. U.S. Bureau of the
Census. 197-209.
Lyberg, L., P. Biemer, M. Collins, E. de Leeuw, C. Dippo, N. Schwarz and D. Trewin, eds. 1997. Survey
Measurement and Process Quality. John Wiley and Sons, New York.
Statistics Canada. 1998. Quality Guidelines. Third Edition. 12-539-XIE.
Swain, L., J.D. Drew, B. Lafrance and K. Lance. 1992. The Creation of a Residential Address Register
for Coverage Improvement in the 1991 Canadian Census. Survey Methodology, 18(1): 127-141.
Swain, L. and D. Dolson. 1997. Current Issues in Household Survey Nonresponse at Statistics Canada.
Statistics in Transition, 3: 439-468.
48.
E L EC T R O N I C P U B L I C A T I O N S
A V A I L A B L E A T
www.statcan.gc.ca
49.
STATISTICS CANADA
37
Chapter 4- Data Collection Methods
4.0 Introduction
Data collection is the process of gathering the required information for each selected unit in the
survey. During data collection, members of the population – be they individuals or organisations – are
located and contacted and their participation in the survey is sought. A questionnaire is then administered
and answers recorded. This process is expensive, time consuming, requires extensive resources and has a
direct impact on data quality. Since it is the general public’s main contact with the statistical agency, it
contributes to the image of the statistical agency and has a broad impact on the agency’s relevance and on
the quality of its data.
During the planning phase of a survey, many decisions must be made regarding the method of data
collection. Should the questionnaire be administered by an interviewer? If yes, should the interview be
conducted in person or over the telephone? Should a combination of methods be used – should
respondents fill out the questionnaire themselves and nonrespondents be followed-up with a telephone
interview? Should the questionnaire be paper or computer-based? Should administrative data be used to
collect some of the survey data? Should data collection for several surveys be combined?
The method of data collection should be chosen to achieve a high participation rate and collect data that
are as complete and accurate as possible while minimising the burden to the respondent and satisfying the
client’s budget and operational constraints.
The purpose of this chapter is to present the various methods of data collection – including self-
enumeration, interviewer-assisted, computer-assisted, administrative data and others – and the criteria for
deciding which method is most appropriate. Data collection operations in general (with an emphasis on
interviewer-assisted methods), including how to locate the sampling units, elicit co-operation and capture
responses are covered in Chapter 9 - Data Collection Operations.
4.1 Basic Data Collection Methods
The basic methods of data collection are:
i. Self-Enumeration
With self-enumeration, the respondent completes the questionnaire without the assistance of an
interviewer. There are a variety of ways that the questionnaire can be delivered to and returned by the
respondent: by post or facsimile, electronically (including the Internet) or by an enumerator. (If the
questionnaire is returned by facsimile or electronically, then a secure line or encryption is needed to
ensure the confidentiality of respondent data). When paper-based, this method is called Paper and Pencil
Interviewing (PAPI), when computer-based it is called Computer-Assisted Self Interviewing (CASI).
ii. Interviewer-assisted (Personal Interviews or Telephone Interviews)
a. Personal Interviews
An interviewer assists the respondent to complete the questionnaire. The interview is conducted in person,
usually at the respondent’s residence or place of work, although it can be conducted in a public place
50.
SURVEY METHODS ANDPRACTICES
STATISTICS CANADA
38
(e.g., airport, shopping centre). When paper-based, this method is called Paper and Pencil Interviewing
(PAPI), when computer-based it is called Computer-Assisted Personal Interviewing (CAPI).
b. Telephone Interviews
An interviewer assists the respondent to complete the questionnaire over the telephone. When paper-
based, this method is called Paper and Pencil Interviewing (PAPI), when computer-based, it is called
Computer-Assisted Telephone Interviewing (CATI).
This chapter begins with a discussion of the basic methods of data collection, assuming paper-based
collection (although many of the comments made also apply to computer-assisted methods). Section 4.2
discusses the advantages and disadvantages of computer-assisted collection. Section 4.3 discusses other
methods of data collection, such as the use of administrative data. For a comparison of all data collection
methods, see the table at the end of the chapter.
4.1.1 Self-Enumeration
Self-enumeration methods require a very well-structured, easy to follow questionnaire with clear
instructions for the respondent. A telephone number to obtain help completing the questionnaire may be
included. Usually, to induce respondent participation, the questionnaire has a more elaborate visual
presentation than an interviewer-assisted questionnaire. (For details on how to design a questionnaire, see
Chapter 5 - Questionnaire Design.)
Compared with the task of managing interviews, self-enumeration is relatively easy to administer. It is
also usually cheaper than interviewer-assisted methods, so larger samples can be selected. This method is
useful for surveys that require detailed information since the respondent can consult personal records.
This can reduce response errors by preventing the respondent from relying on memory. One form of self-
enumeration uses diaries or notebooks. In a diary survey the respondent keeps records during the survey’s
reference period, for example, a listener’s diary for radio and television surveys during a particular week,
or a notebook with gas purchases for a vehicle fuel consumption survey. Self-enumeration is also useful
for sensitive issues since the questionnaire can be completed in private, without an interviewer.
One disadvantage of self-enumeration is that it requires either knowledgeable or well-educated
respondents or a very straight-forward survey topic. Another disadvantage is that response rates are
usually lower than for interviewer-assisted methods since there is no pressure for the respondent to
complete the questionnaire. At Statistics Canada, the response rate for self-enumeration surveys is
typically less than 70%. (One exception is the Census of Population which has an 85% mail return rate
due to a vast publicity campaign and the mandatory nature of the survey.) Often, many follow-ups –
reminding respondents to complete the questionnaire – or telephone interviewers are used to obtain a
good response rate (see section 4.3.4). Also, while the questionnaire can contain substantial reference
material on survey concepts and guides to help in the completion of the questionnaire, this is usually not
as good as having an interviewer present since many respondents do not read instructions. As a result, the
quality can be worse than for interviewer-assisted methods since the respondent may miss skips,
misinterpret information, etc. For this reason, self-enumeration requires follow-up after collection to
correct errors.
There are a variety of ways to deliver and collect self-enumerated questionnaires. The choice of
questionnaire delivery and pick-up must be examined closely, taking care to compare data quality,
collection costs, length of collection period, response rates, etc., before the most suitable combination is
chosen. This will depend on the survey frame that is used and the collection information that is available
51.
DATA COLLECTION METHODS
STATISTICSCANADA
39
on the frame: in order to mail questionnaires, name and mailing addresses must be present and the postal
system must be reliable. In order to fax questionnaires, the frame must have respondent fax numbers. The
most common means of delivering and returning questionnaires are:
- personal delivery / pick up of paper questionnaire;
- mail out / personal pick up of paper questionnaire;
- personal delivery / mail back of paper questionnaire;
- mail out / mail back of paper questionnaire.
When a paper questionnaire is delivered and returned by mail, self-enumeration requires a long
interviewing period since this is the slowest method of data collection. In Canada, it is also the cheapest
method of data collection.
4.1.2 Interviewer-Assisted Methods
The main benefit of interviewer-assisted methods is that by personalising the interview and being able to
interpret questions and survey concepts, the interviewer can increase the response rate and overall quality
of the data. Interviewer-assisted methods are particularly useful for survey populations with low literacy
rates or when the concepts or the questionnaire are complex, or anytime self-enumeration would be
difficult.
An interviewer can increase the response rate by stimulating interest in the survey and reassuring the
respondent of any concerns he or she might have regarding: the confidentiality of the data, the purpose of
the survey, what is expected of the respondent during the interview, how long the interview will take,
how the survey findings will be used, etc. For example, some respondents may be worried that the
information they give could be used to their disadvantage or they may consider the subject matter to be
sensitive, or they may be worried that they do not know the ‘right’ answer. The interviewer can assure the
respondent that the data will be secure and that the statistical agency will adhere to all security procedures
to maintain confidentiality.
The overall quality of the data can be improved since the interviewer can be provided with extensive
training in the survey’s concepts and definitions and assist the respondent with any problems interpreting
the questionnaire. The interviewer can prevent response errors and item nonresponse by immediately
identifying errors and correcting them in the presence of the respondent. This also reduces follow-up
which can be time-consuming for the survey agency and burdensome to the respondent. Finally, the
interviewer can improve data quality by verifying that the correct sampling unit is contacted and
interviewed.
Another advantage of interviewing is that it allows for more flexible collection periods: if data collection
is going too slowly and needs to be accelerated, more interviewers can be hired. This is not possible with
self-enumeration methods where there is little control over when the respondent completes and returns the
questionnaire.
The main disadvantages of interviewer-assisted methods are that they can be expensive and difficult to
manage. Some of the expenses include: interviewer salaries, interviewer training, transportation and
lodging costs for interviewers (in the case of personal interviews) or office space and telephones in the
case of centralised telephone interviewing. Other disadvantages of interviewer-assisted methods are that
poorly trained interviewers can cause response errors and, for sensitive topics, respondents may be
reluctant to answer questions (although, telephone interviews allow for some anonymity). If well-trained
interviewers are unavailable and consequently interviewer bias could be a problem, self-enumeration may
be preferable.
52.
SURVEY METHODS ANDPRACTICES
STATISTICS CANADA
40
For a discussion of response errors, see Chapter 3 - Introduction to Survey Design and Chapter 5 -
Questionnaire Design. The following sections present the advantages and disadvantages of personal
versus telephone interviews.
4.1.2.1 Personal Interviews
With personal interviews, the interview is conducted face-to-face with the respondent. Usually, personal
interviews are conducted at the person’s residence or place of work. For some target populations, this is
the only feasible method of data collection, for example, when telephone interviews are not possible or
when the survey requires a visit to sample or locate members of the population (e.g., to complete listing
of an area frame).
Personal interviews often have the highest response rates (typically around 80-95% for Statistics Canada)
but are usually the most expensive method of collection because of transportation and lodging costs for
interviewers. Consequently, this method of collection may result in smaller sample sizes than would have
been selected for self-enumeration or telephone interviews. Another problem with personal interviews is
that it can be difficult to find people at home or at work, so the interviewer may be required to visit the
residence or place of work several times before successfully contacting the respondent. Sometimes, the
respondent is present, but the time is inconvenient, requiring the interviewer to reschedule the interview.
Other advantages of personal interviews include:
- interviewers can make direct observations (this is not possible with telephone interviews);
- interviewers generally do a better job of converting refusals in person;
- interviewers can instil confidence in respondents by showing them official identification.
Other disadvantages of personal interviews include:
- it is sometimes difficult to hire and retain suitably qualified interviewers in all surveyed areas;
- it is difficult to shift workloads to less busy interviewers;
- it is difficult to implement a quality control program for the interviewing process.
4.1.2.2 Telephone Interviews
Telephone interviews offer a reasonable response rate at a reasonable cost. In Canada, they have medium
to high response rates, lower than personal interviews but higher than self-enumeration (the typical
response rate at Statistics Canada is 70-85%). Some self-enumeration surveys use telephone interviews
for follow-up in order to achieve a better response rate. Telephone interviews are usually cheaper than
personal interviews since there is no travelling cost for interviewers and collection is usually faster than
for personal interviews or self-enumeration. Telephone interviews can also be used to ask sensitive
questions, although this method is not as anonymous as self-enumeration. This method of collection is
safer than personal interviews since the interviewer does not need to travel to dangerous or isolated areas.
Also, if a respondent is not at home or would like to reschedule the interview, less time is wasted
contacting the respondent than for personal interviews. Finally, quality control of the interviewing
process can be easily implemented since telephone interviews can be easily monitored.
One disadvantage of telephone surveys is that they are limited by the length of the interview and
complexity of the questionnaire: respondents have less patience for long, complex interviews over the
telephone than in person. But, since the questionnaire is administered by an interviewer, it can be more
complex than for self-enumeration. Another disadvantage is that direct observations cannot be made over
the telephone.
53.
DATA COLLECTION METHODS
STATISTICSCANADA
41
Other disadvantages of telephone interviews include:
- it may be difficult to construct a survey frame with good coverage of telephone numbers;
- sampling telephone numbers is often inefficient (i.e., may telephone many out-of-scope units);
- confidentiality may be a problem if another person can overhear the respondent’s answers (for
example, where there are shared telephone lines);
- telephone interviews are less personal than personal interviews, so it may be more difficult to
convince people of the importance of the survey;
- telephone interviews may be costly if long-distance calls are made.
For more details on sampling telephone numbers including random digit dialling, see Chapter 6 -
Sample Designs.
4.1.2.2.1 Telephone Sampling
The telephone interviewing process often incorporates the sample selection process: the sample is often
selected by the interviewer during the first step of the interview. The following describes issues relating to
telephone sampling that can determine whether or not telephone interviewing is the appropriate method of
data collection for a particular survey.
Telephone sampling and telephone interviewing are often chosen for household surveys as a practical
compromise between higher quality, higher cost area frame samples with personal interviewing and lower
quality, lower cost self-enumeration mail-out mail-back surveys. The use of telephone sampling and
interviewing avoids the high costs of maintaining area frames and of travel time for personal interviews,
while still maintaining fairly high response rates. As is always the case for any sampling method it is
important that the sampled population be representative of the target population, at least with respect to
the characteristics of interest to the survey. This can be a problem with telephone surveys if the
proportion of the target population without telephone service is not small, or if it differs significantly
between sub-populations. (Some potential biases due to differences in rates of telephone service can be
reduced in the same way that differential rates of non-response can be accounted for.)
An example of the potential biases of using a non-representative frame is the now classic case of the
Literary Digest poll conducted during the 1936 presidential election in the USA. The poll predicted that
the Republican candidate Alf Landon would defeat President Roosevelt:
Landon 55%
Roosevelt 41%.
However, the actual results were quite different:
Landon 37%
Roosevelt 61%.
The frame used for this mail-out mail-back poll was based primarily on addresses found in telephone
directories and automobile registration lists. In 1936, Americans owning cars or telephones tended to be
wealthy and to vote for the Republican party. A large portion of the voting electorate, however, owned
neither a telephone nor a car, and these people tended to vote for the Democratic party. (Today, in
Canada, the United States, and many European countries, virtually all households have telephone service,
so the potential biases for many estimates from telephone surveys are much less than in this 1936
example.)
An important issue when selecting a telephone sample is the choice of sampling frame. For a telephone
frame to be complete it should include all telephone numbers in use; for it to be efficient, it should
54.
SURVEY METHODS ANDPRACTICES
STATISTICS CANADA
42
contain as few numbers not in use as possible. In general improving completeness of a telephone frame
reduces its efficiency. It is important to try to achieve both efficiency and completeness. Using telephone
directories (on-line or on paper) as the frame for selecting telephone samples can be quite efficient, but its
lack of completeness can lead to biases. Unpublished telephone numbers are not in these directories by
definition, and the directories are always several months to several years out of date, so people with new
numbers do not appear either. To improve the completeness of coverage of a telephone sample, Random
Digit Dialling (RDD) techniques are generally used. The following is an example of what can be done in
Canada to achieve both efficiency and completeness.
The form that telephone numbers take varies from country to country, but in Canada the North American
model is used, where a telephone number is a ten digit number consisting of a three digit area code,
followed by a three digit prefix, followed by four more digits. There are currently 21 area codes used in
Canada, so a simple frame would consist of appending the 10 million possible seven digit numbers to
each of the 21 area codes, producing a frame of 210 million telephone numbers. This frame would be
absolutely complete (until a new area code were introduced), but since there are only about 13 million
telephone numbers in Canada that actually reach households, 94% of the numbers selected at random
from this frame would not reach households. Hence using the frame would be very inefficient. It is
possible to refine the frame. For North America it is possible to purchase a list of all area code and prefix
combinations in use. There are currently 8,600 of these in Canada, with which a frame could be built by
appending to each the 10,000 possible four digit numbers to yield a frame of 86 million numbers, of
which only 85% would not reach households. The Mitofsky-Waksberg method can be used to further
improve the operational efficiency of such a frame at the expense of complicating field procedures and
possibly decreasing the statistical efficiency through clustering. Statistics Canada further refines the
telephone sampling frame by using administrative data.
Define a hundreds bank as the 100 telephone numbers that share the same area code, prefix, and next two
digits. Using administrative lists of published telephone numbers it is possible to identify all of the
hundreds banks that contain at least one published household telephone number. There are about 260,000
such working banks, yielding a frame containing 26 million telephone numbers, of which only about half
do not reach households. However, whereas the first two frames are complete at some point in time (and
remain complete until new area codes or new area code and prefix combinations come into use), the
frame based on working hundreds banks may be incomplete. If a hundreds bank contains no published
household numbers, but does contain some unpublished household numbers, it will not appear on the
frame when it should. In addition, new hundreds banks are used by the telephone companies far more
frequently than new area codes and prefixes, and the new area codes and prefixes are published before
they come into use. This last RDD method is known as truncation of 0-listed banks or elimination of non-
working banks.
Even when the elimination of non-working banks is used to improve efficiency, for a household survey in
Canada about half of the telephone numbers in an RDD sample will be out-of-scope numbers. So, before
an interview can be conducted over the telephone, the interviewer must confirm that the telephone
number is in-scope for the survey. For RDD surveys in Canada four to six minutes of interviewer’s time
is spent on out-of-scope numbers for each completed interview. When the questionnaire is short, this time
can represent a significant part of the total interviewer time spent per interview. It nevertheless is small
compared to the travel time necessary for personal interviews.
Random digit dialling sample design is less flexible than area frame designs when it comes to
stratification. (Stratification divides the survey population into subpopulations, for example, provinces.
There are three main reasons for stratification: to make the sampling strategy efficient; to ensure adequate
sample sizes for specific subpopulations for which analysis is to be performed; and to protect against
drawing a ‘bad’ sample.) While area frames allow flexibility in the choice of geographic strata, for RDD
55.
DATA COLLECTION METHODS
STATISTICSCANADA
43
surveys, the geography of stratification must be based on area code and prefix (or similar concepts for
non-North American telephone systems). There generally is a geographical area associated with these, but
it may not match any municipal boundaries or other boundaries of importance to the survey. To
compensate, RDD sampling allows for selecting unclustered samples of households, yielding samples that
tend to be more statistically efficient (lower design effect) than samples from area frames.
For more information on telephone sampling, see Dillman (1978), Groves et al. (1979), Groves et al
(1988) and Lavrakis (1987). For a discussion of frame coverage problems, see Chapter 3 - Introduction
to Survey Design. For a thorough discussion of sample designs, see Chapter 6 - Sample Designs. See
Chapter 7 - Estimation for a discussion of nonresponse adjustments.
4.1.3 Choosing between Self-Enumeration and Interviewer-Assisted Methods
There are various issues that must be considered when selecting a method of data collection:
- collection information available on the survey frame;
- characteristics of the target population;
- nature of the questions being asked;
- available resources (e.g., interviewers);
- how easy the questionnaire is to complete;
- privacy considerations;
- data quality requirements.
Collection information that is available on the survey frame plays a key factor in determining which
method of data collection is most appropriate. If the frame does not include mailing addresses, then self-
enumeration questionnaires cannot be mailed out to respondents. If up-to-date telephone numbers are not
available and Random Digit Dialling is considered to be inappropriate, then telephone interviews cannot
be conducted.
The characteristics of the target population influence the data collection method. If the literacy rate of the
population is low or language difficulties are an issue (e.g., immigrants), interviewer-assisted methods
may be the only option. The geographic distribution of the population and sample is also important. If the
population and sample are widely dispersed across the country, personal interviews could be too
expensive and difficult to manage. (The distribution of the population and the cost of data collection are
factors in determining which method of sampling is most appropriate. For more details, see Chapter 6 -
Sample Designs.)
The nature of the survey questions influences data collection. If the subject matter is sensitive, then a
method of collection that builds in anonymity such as self-enumeration or telephone interviews may be
the most appropriate. If complex questions are asked, an interviewer may be needed to explain questions
and concepts. If the interviewer needs to make observations or measurements (e.g., administering a
literacy test to children) or show the respondent material (e.g., graphics or diagrams), then personal
interviews might be required.
Available resources heavily influence the choice of data collection method. These resources include
available budget, personnel, equipment and time. In order to use an interviewer-assisted method,
sufficient budget must be available to pay for the training, hiring and travelling of interviewers. The
statistical agency also needs to be able to find the required number of interviewers. If a computer-assisted
method is selected, then expert computer programmers are required along with the necessary computer
equipment.
56.
SURVEY METHODS ANDPRACTICES
STATISTICS CANADA
44
Some methods of data collection are easier to administer than others. For example, centralised telephone
interviews (i.e., where all the interviewers make their calls from one location) are easier to organise than
geographically dispersed personal interviews. Also, the time frame within which the data must be
collected is important – self-enumeration methods are typically slower than interviewer-assisted methods
and manual paper-based methods are usually slower than computer-assisted ones.
Finally, data quality requirements should be considered when selecting a data collection method.
Interviewers who are well trained in the concepts being used by the survey can reduce response errors and
nonresponse. Precision requirements should be considered: larger samples generally yield more precise
estimates (i.e., estimates with smaller sampling error), but the more expensive the data collection method,
the smaller the sample the client can probably afford. Personal interviews are often the most expensive
method and self-enumeration surveys the least expensive. The ability to measure quality and implement
quality control procedures may also be important. It is easier to monitor the quality of telephone
interviews, for example, than personal interviews.
The following table compares personal interviews, telephone interviews and self-enumeration data
collection methods with respect to cost, time to complete data collection and response rates.
Table 1: Interviewer-Assisted versus Self-Enumeration Data Collection Methods
Self-Enumeration Interviewer-Assisted
Personal Telephone
Cost Low High Medium
Time Longer Average Shorter
Response Rate Low High Medium-high
For details on how to select a sample design, see Chapter 6 - Sample Designs. For factors that determine
the sample size, see Chapter 8 - Sample Size Determination.
4.2 Computer-Assisted Data Collection
A major factor in survey design is whether collection involves computer methods or a traditional paper-
based approach, where answers are recorded on a paper questionnaire. While so-called Paper and Pencil
Interviewing (PAPI), is still sometimes used, computer-assisted data collection is becoming more
prevalent.
For surveys that are only conducted once, paper-based methods are often cheaper and require less
development time than computer-based methods. However, data capture – the transformation of responses
into a machine-readable form – must be performed as a separate operation after collection. Data capture is
a necessary survey step since all survey data must ultimately be entered into and stored in a computer.
Other disadvantages of paper-based collection include:
- manual data collection is time-consuming and optically scanning the questionnaire may not be an
option;
- the questionnaire should not have complicated skip patterns or edits;
- printing questionnaires can be costly;
- mailing questionnaires can be costly;
- completed questionnaires must be stored and securely protected to ensure respondent confidentiality.
57.
DATA COLLECTION METHODS
STATISTICSCANADA
45
The main benefit of computer-assisted methods is that data collection and data capture are combined,
resulting in an integrated, faster and more efficient collection and capture process. Computer-assisted
interviewing (CAI) may be conducted using any data collection method:
- self-enumeration (Computer-Assisted Self-Interviewing, CASI);
- by telephone (Computer-Assisted Telephone Interviewing, CATI);
- in person (Computer-Assisted Personal Interviewing, CAPI).
CASI is a relatively new and little used technology in which the questionnaire, complete with an editing
program to identify missing, invalid or inconsistent entries, and help features, is sent to the respondent in
electronic format. The respondent uses his or her own computer to complete the questionnaire. This
allows a respondent who possesses the necessary computer equipment and software to capture and edit
the data directly using his or her computer while being prompted by the system through the survey
questions. The questionnaire on a diskette may be sent by the regular mail or by courier, or the electronic
file may be forwarded by modem and returned over a secure line.
Currently, pilot projects at Statistics Canada are being conducted to collect data in structured standard
formats via the Internet in a secure fashion. The advantages of using the Internet are the reduced costs for
data collection and data capture and the increased timeliness. One disadvantage of using the Internet is
that the questionnaire must be compatible with different versions of Internet software (e.g., Explorer,
Netscape, Windows, UNIX, etc.). Another disadvantage is the relatively low number of high speed
Internet users (although this number could grow rapidly over the next few years), making it an unlikely
option for household surveys but more possible for business surveys.
In general, the advantage of CASI is its flexibility and convenience for the respondent who has the
computer equipment and software, the main disadvantage is that not all respondents have the necessary
computer equipment.
With CATI and CAPI, each interviewer is equipped with a computer. The interviewer reads a script
appearing on the screen, then enters the responses directly into the computer. In Canada, CATI and CAPI
are becoming increasingly prevalent as computer technology improves.
In general, CAI has many advantages over PAPI, mainly due to combined data collection and capture. It
is easier to monitor and control the quality of the data since data collection, automated editing and data
capture are more consistent and controlled than with paper-based methods. Also, automated editing means
that edit failures can be resolved immediately, resulting in less follow-up and response burden. It is easier
to implement quality control of the interviewing process and to generate management reports on the status
of the interviews (e.g., response rate, number of interviews completed, number outstanding, length of time
per interview, etc.). The questionnaire can be more complex in terms of skip patterns and edits. Responses
are often obtained much more rapidly than for paper-based surveys (especially ones that are mailed out
and mailed back).
One disadvantage of computer-assisted collection is that the person filling out the questionnaire – the
respondent or interviewer – must be trained and comfortable with the software application. (However,
once comfortable with the application, the interviewer can spend more time on interpersonal skills.) Also,
computer-assisted surveys require extensive and costly development work by computer programming
experts (this can be decreased somewhat if a survey is able to adapt another survey’s computer
application). The questionnaire must be programmed so that each question appears on the computer
screen in its proper sequence. The application must be tested thoroughly to ensure that the screens are
presented in the correct order and that they guide the interviewer or respondent through pre-determined
paths. Edits, online help and additional functions that help interviewers or respondents must also be
programmed and tested. Also, for interviewer-assisted surveys, another disadvantage is the cost of
58.
SURVEY METHODS ANDPRACTICES
STATISTICS CANADA
46
purchasing the equipment since each interviewer needs a computer (although this cost could be shared
across surveys). And while there is the advantage of not having to securely store completed paper
questionnaires to protect respondents’ confidential data, computers must be protected from theft.
Developing and testing computer-assisted methods, particularly for a new survey, may be a long and
costly process. However, for surveys with a large sample size, computer-based collection may greatly
reduce data capture and editing costs. For repeated surveys, computer-based collection may be less
expensive than paper-based collection in the long run because of the savings in printing and since the cost
of development can be spread out over several collection cycles.
Other advantages of computer-based collection are:
- it is environmentally friendly (questionnaires are not printed out);
- dependent interviewing can be easily performed for repeated surveys to reduce response error (i.e.,
information provided by a respondent in a previous cycle of the survey can be used at subsequent
cycles).
Other disadvantages of computer-based collection are:
- transmission between computers (e.g., from the interviewer’s computer to head office) must be over a
secure line in order to protect the confidentiality of respondent data;
- it is vulnerable to technical difficulties (battery life, file transfer problems, etc.) that are time-
consuming to fix and could result in the loss or damage of data;
- it requires computer experts to develop the software and deal with technical problems.
Data capture is dealt with in more depth in Chapter 9 - Data Collection Operations. Data processing,
including optical scanning for data capture, and editing are discussed in Chapter 10 - Processing.
4.3 Other Methods of Collection
Besides self-enumeration and interviewer-assisted methods, other data collection methods include: direct
observation, electronic data reporting, administrative data, combined methods and supplementary or
omnibus surveys.
4.3.1 Direct Observation
This method consists of observing or measuring directly the characteristics of interest in the field or in a
laboratory. It may be the only possibility for certain concepts (e.g., some medical data) and is commonly
used for pricing surveys. Remote sensing is a form of direct observation that interprets satellite images. It
is used in some farm surveys to estimate types and areas of crops. This form of collection cannot be
applied to most data, since most data cannot be observed or directly measured.
Direct measurement is usually precise and when observations only are made there is no response burden.
However, when measurements of people are made, the study subjects may find these measurements
irksome or burdensome: for example, a medical study that takes blood samples from patients. This can
result in low participation rates.
One difficulty with direct measurement is that it can be expensive since all interviewers must be trained to
observe or measure the data and this may require hiring specialists (e.g., nurses to take blood-pressure
measurements). If specialists are required and only a few can be hired, this can severely restrict the
sample size and design.
59.
DATA COLLECTION METHODS
STATISTICSCANADA
47
4.3.2 Electronic Data Reporting (EDR)
Some surveys allow respondents to provide their electronic data (e.g., on diskettes, computer tapes or
cartridges) in their own format. EDR is a form of self-enumeration and can be very convenient for the
respondent but is usually only offered when there is no other means of obtaining the data. For example,
some businesses may only provide their data this way.
When the data are transferred from the respondent’s computer to the statistical agency’s using a dedicated
line (modem to modem), this is referred to as Computer to Computer Data Transfer. EDR is often avoided
since, if a standard format cannot be agreed upon with the respondent, extensive work is involved in
editing and manipulating the data to suit the format required by the statistical agency.
4.3.3 Administrative Data
Some surveys can obtain the information they require from existing administrative data. Administrative
data are those that have been collected for administrative purposes (e.g., to administer, regulate or tax
activities of businesses or individuals) as opposed to statistical purposes (to study groups of individuals,
businesses, farms, etc.).
Administrative records have a huge advantage in that they avoid a major portion of data collection costs
and respondent burden. They can also result in timely survey results since the data already exist.
However, the purpose of the administrative program may be quite different from that of the survey,
therefore concepts and definitions must be carefully assessed (e.g., the target population and coverage of
the target population). Also, there is a lack of control over the quality of the data (which is determined by
the administrator, not the statistical agency). Follow-up of edit failures is usually impossible. There is also
usually considerable processing work to be done to ensure that the administrative data are in the format
required by the statistical agency. Finally, there may be privacy concerns regarding the use of the
administrative data for statistical purposes.
For more details on the uses of administrative data, see Appendix A - Administrative Data.
4.3.4 Combining Methods
Often the most satisfactory collection strategy is to offer respondents a choice of data collection methods.
The advantages of combining methods include improved response rates, fewer response errors and faster
collection. One disadvantage of combining methods is that collection may be more complex and
expensive. Another disadvantage is that it produces heterogeneous data that can complicate processing
and analysis. For example, if a self-enumeration mail-out survey is conducted and nonrespondents are
followed-up by telephone with a shorter questionnaire, then both versions of the questionnaire must be
reconciled during processing. And bias may be introduced if data from the telephone interviews are of
better quality than the self-enumeration questionnaires, which will complicate data analysis.
Another example of combining methods is a monthly survey where it may be cost-effective to contact the
respondent in person for the first interview and by telephone for subsequent interviews. This is what is
done for the Canadian Labour Force Survey. For the Canadian Census of Population, the initial data
collection is a mail-out/mail-back survey. Follow-up is done with telephone and personal interviews; the
60.
SURVEY METHODS ANDPRACTICES
STATISTICS CANADA
48
response to mailed self-enumeration surveys is improved when non-respondents are followed-up in two
stages - first by telephone, then in person. Another alternative – becoming more and more popular – is to
combine data collected by a questionnaire with administrative data, in order to reduce recall error,
respondent burden and survey costs.
4.3.5 Supplementary and Omnibus Surveys
Sometimes, it is possible to share a collection vehicle with another survey, via an omnibus survey or a
supplementary survey. In a supplementary survey, the new questionnaire is added as a supplement to an
existing survey’s questionnaire. Typically, the existing survey is a large-scale survey. Supplementary
surveys are common in government agencies. An example at Statistics Canada is the Canadian Travel
Survey, which collects information on trips and characteristics of Canadians who travel and is conducted
as a supplement to the Labour Force Survey.
In an omnibus survey, questions for several different surveys are combined into a single questionnaire.
This way, the omnibus survey’s questionnaire is composed of several sections, each dealing with a
different topic and each conducted for a different client. The costs of the survey are shared by the clients
in proportion to the effort involved in the collection and processing of the different sections of the survey.
It can therefore be an effective means of reducing the costs associated with developing and carrying out
the survey. This type of survey is carried out on a regular basis by private research companies and
statistical agencies and involves several partners with varying research needs. The major advantage of this
approach is the, often substantial, reduction in costs, compared to conducting a separate survey for each
topic.
One disadvantage of this approach is that the respondent is faced with a large questionnaire composed of
a variety of, what may be, unrelated and sometimes sensitive topics. This can result in a burdensome
questionnaire to which a respondent is less inclined to respond. Also, the lack of control over the order of
the sections of the questionnaire can have an effect on the responses.
4.4 Summary
There are three main methods of data collection: self-enumeration, personal interviews and telephone
interviews. Self-enumeration by mail is usually the cheapest form of data collection. Unfortunately, self-
enumeration surveys often have the lowest response rates and can take the most time to conduct,
particularly if the questionnaire is delivered and returned by mail.
Personal interviews usually yield the highest response rates but can also be the most expensive. They are
often used for surveys with complex or extensive questions, when the sample requires a personal visit to
locate or select respondents, when there is poor coverage of the target population with telephones or when
the population has a low literacy rate.
Telephone interviews usually have medium response rates, are less expensive than personal interviews
and are the quickest method of collection. They can be particularly advantageous when the population
and sample are geographically dispersed, where personal interviews would be expensive and difficult to
conduct. The main problem with telephone interviews is telephone sampling: lists of telephone numbers
rapidly become out-of-date (resulting in frame undercoverage) and Random Digit Dialling is inefficient.
61.
DATA COLLECTION METHODS
STATISTICSCANADA
49
All of these data collection methods can be either paper-based or computer assisted. The main advantage
of computer-assisted methods is that data collection and capture are combined. The main disadvantage of
computer methods is the considerable time and cost required to develop the computer application.
Other methods of data collection include: direct observation, electronic data reporting, administrative
data, combining methods and supplementary or omnibus surveys. Direct observation can be precise, but
cannot be applied to all data and often requires the use of specialists. Electronic data reporting is
convenient for respondents who can report their data electronically, but may require considerable work to
convert the respondent’s data into the required format. Administrative data can be used as an indirect data
collection method for some surveys. This can eliminate response burden, greatly reduce the cost of the
survey and improve the timeliness, however the statistical agency must carefully review the concepts used
by the administrative source and the quality of the data. A combination of methods is often a good way to
reduce costs, improve response rates and timeliness. Another way to reduce costs is to join forces with
other surveys using a supplementary or omnibus survey.
Bibliography
Cox, B.G., D.A. Binder, B.N. Chinnappa, A. Christianson, M.J. Colledge and P.S. Kott, eds. 1995.
Business Survey Methods. John Wiley and Sons, New York.
Couper, M.P., R.P. Baker, J. Bethlehem, C.Z.F. Clark, J. Martin, W.L. Nicholls II and J.M. O’Reilly, eds.
1998. Computer Assisted Survey Information Collection. John Wiley and Sons, New York.
Dielman, L. and M.P. Couper. 1995. Data Quality in a CAPI Survey: Keying Errors. Journal of Official
Statistics, 11: 141-146.
Dillman, D.A. 1978. Mail and Telephone Surveys: The Total Design Method. John Wiley and Sons, New
York.
Dillman, D.A. 2000. Mail and Internet Surveys: The Tailored Design Method. John Wiley and Sons, New
York.
Dufour, J., R. Kaushal, C. Clark and J. Bench, eds. 1995. Converting the Labour Force Survey to
Computer-Assisted Interviewing. Statistics Canada. HSMD-95-009E.
Groves, R.M. 1989. Survey Errors and Survey Costs. John Wiley and Sons, New York.
Groves, R.M., P.P. Biemer, L.E. Lyberg, J.T. Massey, W. L. Nicholls and J. Waksberg, eds. 1988.
Telephone Survey Methodology. John Wiley and Sons, New York.
Groves, R.M. and R.L. Kahn. 1979. Surveys by Telephone: A National Comparison with Personal
Interviews. Academic Press, New York.
Kasprzyk, D., G.J. Duncan, G. Kalton and M.P. Singh, eds. 1989. Panel Surveys. John Wiley and Sons,
New York.
Lavrakis, P.J. 1987. Telephone Survey Methods: Sampling, Selection and Supervision. Applied Social
Research Methods Series. 7. Sage Publications, California.
62.
SURVEY METHODS ANDPRACTICES
STATISTICS CANADA
50
Table 2: Comparison of Data Collection Methods
Method Advantages Disadvantages
A. Paper-Based - can contain printed reference material to reduce
response error
- does not require computers for data collection
- can take less time to develop collection procedures than
for computer-based methods
- for one-time surveys or small surveys, collection may
be cheaper than computer-based methods
- data capture is separate from collection
- printing questionnaires can be expensive
- questionnaires cannot have a complex flow/skip pattern
- requires much manual work for data collection
- questionnaire can have only a few simple, manual edits
- dependent-interviewing difficult for repeated surveys
A.1 Self-Enumeration - easy to administer
- can reduce response error since respondent can consult
personal records
- usually the most inexpensive data collection method,
therefore client can afford larger samples with better
precision
- questionnaire can be completed without the presence of
an interviewer and therefore is good for sensitive
questions
- does not require large numbers of trained interviewers
- can increase response error since respondent is unlikely to
read reference material
- data may be of poorer quality than for interviewer-assisted
methods
- the questionnaire must be well-designed and respondent-
friendly with clear instructions to encourage participation
and reduce response errors
- questionnaire cannot be too long or complex
- should only be applied to simple, straight-forward survey
topics or well-educated populations
- response rates lower than for interviewer-assisted methods
(many follow-ups may be required to improve the response
rate)
- need to follow-up edit failures
- if questionnaires are mailed, must pay for postage
- mail-out/mail-back questionnaires can be the slowest
method of data collection
63.
DATA COLLECTION METHODS
STATISTICSCANADA
51
Method Advantages Disadvantages
A2. Interviewer-
Assisted
- better response rates than self-enumeration since
interviewer can stimulate interest and be sensitive to
respondent’s concerns
- interviewer can improve data quality by explaining
concepts, helping with problems: can reduce response
errors and the number of partially completed
questionnaires
- interviewer can ensure that the correct unit is surveyed
- can lower response burden since interviewer can
immediately edit and follow-up edit failures
- interviewer can explain methods used to ensure data
security and confidentiality
- allows for a more flexible collection period than self-
enumeration (more interviewers can be hired to speed
up collection)
- can be applied to populations with poor literacy skills
- interviews can be expensive: cost of training interviewers,
interviewers’ salaries, lodging, transportation for personal
interviews/office space for telephone interviews
- need to have time to train interviewers
- good management skills are required to co-ordinate all the
interviews
- can increase response error: poorly trained interviewers can
increase response error; respondents may be reluctant to
respond to sensitive questions (especially if the interviewer
is hired locally) or may only provide socially correct
answers
- obtaining a survey frame with good coverage of all
telephone numbers may be difficult
- telephone sampling is inefficient
A2.1.
Personal
Interviews
- provides a very personalised interview (more
personalised than telephone interviews) which usually
results in higher response rates than for telephone
interviews
- interviewer can instil confidence in respondents by
showing them official identification
- interviewer can make direct observations
- a more complex questionnaire is possible than for
telephone interviews or self-enumeration
- usually the most expensive method of data collection,
resulting in smaller sample sizes
- difficult to implement quality control of interviews versus
telephone interviews which are easy to monitor
- can be difficult and time consuming to find people at home
or at work
- can be difficult to find and keep suitably qualified
interviewers in all survey areas
- cannot easily shift workload to less busy interviewers
64.
SURVEY METHODS ANDPRACTICES
STATISTICS CANADA
52
Method Advantages Disadvantages
A2.2.
Telephone
Interviews
- response rates are usually higher than for self-
enumeration
- quality control of interviewing is easily implemented
- cheaper than personal interviews (do not have to pay for
travel and lodging costs)
- fastest response time (versus personal interviews or self-
enumeration)
- can conduct interviews in difficult or inaccessible areas
- more anonymous than personal interviews: can ask
sensitive questions
- less costly than personal interviews, permitting larger
samples if needed
- response rates lower than for personal interviews
- need to pay for office space for interviewers
- may need to pay for long-distance telephone calls
- questionnaire cannot be too long or complex
- direct observations cannot be made
- may be confidentiality problems if some telephone lines are
shared
- telephone sampling is inefficient: dialling a telephone
number can lead to no contact, nonresponse or an out-of-
scope unit
- potential bias due to undercoverage when sampling from an
administrative list of telephone numbers
- RDD sampling has limited geographical stratification
variables
B. Computer-Assisted
Methods
- editing during collection can be automated, resulting in
immediate resolution of edit failures and consequently
less response burden due to follow-up
- data collection, editing and capture are integrated,
making them more timely (faster response time) and
efficient and easier to monitor than paper-based
methods
- potentially better quality data
- can have questionnaires with complex branching (skip
patterns)
- easy to produce management reports (e.g., on response
rates)
- may be cheaper than paper-based collection for repeated
or large surveys
- may be able to save in development costs by adapting
software developed for a similar survey
- better protection of confidentiality of completed
questionnaires
- environmentally friendly (less paper wasted)
- dependent interviewing is possible for repeated surveys
- developing the computer application can take a long time
and be expensive
- need to test the computer application thoroughly
- require computer experts to develop/adapt computer
application
- vulnerable to technical difficulties
- interviewers or respondents must know how to use the
computer application
- infrastructure requirements (e.g., to equip interviewers with
laptop computers)
- need to be able to securely transmit data from one computer
to another (e.g., from the field to Head Office)
65.
DATA COLLECTION METHODS
STATISTICSCANADA
53
Method Advantages Disadvantages
B1. Computer
Assisted Self
Interviews (CASI)
- flexible and convenient for the respondents with
computers
- respondents must be comfortable using computers and/or the
application and have the necessary computer software and
hardware
B2. Computer
Assisted Interviews
(CAI)
- can automate the management of interviews (e.g.,
automate scheduling of interviews)
- easier to manage interviews than for paper-based
collection
- can increase data quality: interviewers who are
comfortable with the computer application can spend
more time on interpersonal skills
- cost of computer equipment for interviewers
- additional training of interviewers on computer application
- security issues (e.g., computer can be stolen)
C. Other Methods of Data Collection
C1. Direct
Observation
- when all data are observed, there is no response burden
- data collected are usually more precise than for
interview or self-enumeration methods
- can be very costly if specialists are required to take
measurements, resulting in small samples
- cannot be applied to most surveys
- if measurements are taken, participants may find this
burdensome, resulting in a low participation rate
C2. Electronic Data
Reporting (EDR)
- convenient for the respondents with computers - format of respondent data may vary, resulting in costly and
time-consuming processing
C2.1.
Internet
- reduced costs for collection and capture
- increased timeliness
- small number of Internet users
C3. Administrative
Data
- data readily available, often resulting in cheap and
timely survey results
- low response burden
- purpose of administrative program may be different than
survey: need to assess usefulness of administrative source
with respect to survey’s concepts and definitions (e.g., target
population and coverage problems, reference periods, etc.)
- statistical agency has little control over data quality
- difficult or impossible to follow-up edit failures
- administrative data may require time-consuming and costly
processing (e.g., record layout may need to be changed)
- there may be privacy concerns regarding the use of
administrative data
C4. Combining
Methods
- improved response rate
- reduced response error
- faster collection
- collection can be more complex and expensive
- introduces a heterogeneity in the data that can complicate
processing
66.
SURVEY METHODS ANDPRACTICES
STATISTICS CANADA
54
Method Advantages Disadvantages
C5. Supplementary
and Omnibus Surveys
- costs shared across several surveys - need to find appropriate surveys to work with / may not
want to be associated with some surveys
- may be burdensome for the respondent, resulting in lower
response rates
- lack of control over the order of the sections of the
questionnaire can have an effect on the responses
67.
STATISTICS CANADA
55
Chapter 5- Questionnaire Design
5.0 Introduction
A questionnaire (or form) is a group or sequence of questions designed to obtain information on a
subject from a respondent. Questionnaires include forms used for sample surveys and censuses as well as
administrative forms. Questionnaires play a central role in the data collection process. They have a major
impact on data quality since the questionnaire is the process whereby data are collected. They also
influence the image that the statistical agency projects to the public.
The questions posed must conform to the survey’s Statement of Objectives and provide information that
is useful for data analysis. All information requirements must be met, but each question should have an
explicit rationale for being on the questionnaire. It must be known why each question is being asked and
how the information is to be used. The question wording must be clear. The questions must be sequenced
logically for the respondent. The questions must be designed so that they are easily understood and can be
accurately answered by respondents. Finally, the questionnaire should be tested before implementation
using cognitive testing, focus groups, informal testing and other methods described in this chapter.
A well-designed questionnaire should:
- collect data efficiently with a minimum number of errors and inconsistencies;
- be respondent friendly and interviewer friendly (if interviewer-assisted);
- lead to an overall reduction in the cost and time associated with data collection.
The purpose of this chapter is to provide an overview of the steps of questionnaire design, including the
development and testing of questionnaires. The main types of questions – open versus closed – are
described as well as their advantages and disadvantages. Guidelines for developing questions are also
covered. Finally, response error and processing issues related to questionnaire design are addressed.
5.1 The Questionnaire Design Process
The questionnaire design process starts with the formulation of survey objectives and information
requirements (Chapter 2 - Formulation of the Statement of Objectives) and continues with the
following steps:
- consult with data users and respondents;
- review previous questionnaires;
- draft the questionnaire;
- review and revise questionnaire;
- test and revise questionnaire;
- finalise questionnaire.
5.1.1 Consult with Data Users and Respondents
The process of consulting with data users, which began during with the formulation of the survey’s
objectives during the planning phase, continues during the design and development of the questionnaire.
This extended consultation is particularly important for major, if not all surveys conducted by a statistical
agency. By clearly understanding how the data are to be used, the statistical agency should be able to
develop a well-designed questionnaire that meets the users’ needs.
68.
SURVEY METHODS ANDPRACTICES
STATISTICS CANADA
56
Not only data users, but respondents, experts in the field of study and those who have conducted similar
surveys in the past should be consulted before the questionnaire is drafted. They should be able to provide
insight into the type of information that respondents can provide and help clarify the concepts to be
studied. Meeting with respondents can help identify issues and concerns that are important to them and
may affect decisions regarding the content of the questionnaire. It can also be helpful in identifying the
wording and language that respondents use to describe the survey concepts – this can provide useful
insights into how questions and response categories should be worded. These discussions can take the
form of in-depth consultations or focus groups (see Section 5.1.5.3).
5.1.2 Review Previous Questionnaires
Other surveys are a good source of information when developing a survey. Examining questions that were
used by other surveys on the same or a similar topic can be a useful starting point when considering how
to draft a question (namely, the question wording). In some situations, the same questions should be used,
for instance when trying to compare results from different surveys. Also, documentation on the data
quality from such surveys should be examined to assess the effectiveness of the questionnaire (e.g.,
problems with question wording, response burden, refusal rates, etc.).
5.1.3 Draft the Questionnaire
The next step is to develop a draft of the whole questionnaire. Because the questionnaire is affected by the
whole survey design, along with the survey’s objectives the following factors must be considered:
i. Method of data collection
The length of the questionnaire and the manner in which questions are posed depends on the data
collection methodology. For self-enumeration surveys, questionnaires should be less complex and shorter
than for interviewer-assisted methods and preferably be ‘stand-alone’ meaning all relevant information
(e.g., instructions, contact information, examples) is included on the questionnaire. With interviewer-
assisted methods, the wording of a question is often different than for self-enumeration questionnaires.
That is, the question should sound natural when asked out loud. With self-enumeration and personal
interviews more response categories are possible than with telephone interviews which should be kept
short.
The appearance, organisation and data recording structure will also be very different depending on
whether the questionnaire is for self-enumeration, for telephone or personal interview, paper and pencil,
or computer-assisted.
ii. Characteristics of respondents
The characteristics of respondents should be considered when drafting the questions. They may have an
impact on the terminology or complexity of language used for the questions. Questions intended for a
survey of the general public should be easily understandable by all respondents, while a survey aimed at
professionals may use technical or professional language related to the work of the respondents.
69.
QUESTIONNAIRE DESIGN
STATISTICS CANADA
57
iii.Response burden
Every effort should be made to consider the burden of responding to the questionnaire, the time and effort
required to provide answers and whether other individuals or records have to be consulted. The number
of questions should be kept to a minimum. Each question must have a reason for being on the
questionnaire. (The purpose of some questions may be to ensure that respondents understand a subsequent
question, or for evaluation purposes.)
iv. Complexity of the data to be collected
Careful wording of the questions is necessary when collecting complex data. Instructions should be
included in questions covering complex topics. This will help the interviewer to explain questions and the
respondent to accurately answer them.
v. Confidentiality and sensitivity of the information
These issues may directly influence how the questions are drafted. The questionnaire instrument should
include introductory statements regarding how the confidentiality of respondent data is to be protected. It
should also explain how the data are to be used, who has access to the data, how long the data will be
kept, etc. When asking questions about sensitive issues (a question that respondents may not feel
comfortable answering), it may be necessary to use techniques that soften the impact of asking the
question. This increases the likelihood of a response (for more, see section 5.3.8).
vi. Translation
The questionnaire should be translated into all languages that are commonly spoken by the target
population. Care must be taken when translating questions from another language to take account of not
only the language, but also different customs and culture.
vii. Comparability of results with other surveys
When survey results are to be compared with other surveys, the questions must be drafted in the same
manner. Each version of the question must cover the issue in the same way and have the same meaning in
the context of the question. To ensure the comparability of the results with other surveys, the same
question wording should be used after the quality of the earlier results is confirmed. Also, some questions
may be sensitive to questions immediately preceding them.
viii. Consistency
The wording of the question must have the same meaning for all respondents as that intended by the
statistical agency. If the questionnaire is to be translated into different languages it is particularly
important to test all language versions.
ix. Other factors
Other factors to consider when drafting questions include:
- the availability of the data being sought;
- the respondent’s willingness to provide the data;
- the likelihood of nonresponse;
- administrative requirements;
70.
SURVEY METHODS ANDPRACTICES
STATISTICS CANADA
58
- the type of questions;
- the wording of each question;
- the layout of the questionnaire ;
- sources of measurement or response error;
- processing of the questionnaire.
Administrative requirements of the survey organisation include such things as data sharing agreements, a
statement informing respondents of the confidentiality of their responses, bilingual versions of the
questionnaire, etc.
Questions can be either open or closed (closed questions provide response categories). Types of questions
are discussed in detail in section 5.2. Guidelines for wording survey questions are covered in section 5.3.
Sources of response error are discussed in section 5.4. The layout of the questionnaire and processing
considerations are presented in sections 5.5 and 5.6.
5.1.4 Review and Revise the Questionnaire
It is essential that the questionnaire be reviewed internally before it is tested. This review should identify
any obvious problems with the questionnaire such as mistakes in spelling or grammar or awkward
wording. It is also useful at this stage to have the questionnaire reviewed by people who are not directly
involved with the project. Reviewers could include experts in the field of study, people who have
experience designing questionnaires, interviewers or members of the population to be surveyed. They can
often provide helpful comments and suggestions leading to revisions in the questions and response
categories.
5.1.5 Test and Revise the Questionnaire
It is important to test all versions (i.e., all language versions) of the questionnaire on ‘typical’ respondents
long before data collection begins (i.e., typical for the target population, which may mean respondents of
a certain age, sex and level of education). It may also be important to test the questionnaire on specific
subpopulations that may have problems with particular questions.
Responding to a question is a complex process. Respondents must first understand the question. They
must then search their memories or records to retrieve the requested information. After retrieving the
information, they must think about the correct answer to the question and how much of that answer they
are willing to reveal. Only then do they communicate an answer to the question. Each of these processes
may be a source of error.
Testing methods are intended to identify difficulties and errors with the questions. Testing can also
identify whether the question order affects the interpretation of questions, whether instructions are clear
and how respondents feel about the appearance of the questionnaire. The benefit of questionnaire testing
includes the production of a respondent and interviewer friendly questionnaire which permits the
collection of accurate data, with a format that facilitates data capture and coding thereby minimising
errors and reducing the cost and time of data collection, capture and processing.
Methods used to test questionnaires (their content, layout, etc.) are typically based on small, subjective
non-probability samples of respondents from the target population. The methods described in the
following sections are:
71.
QUESTIONNAIRE DESIGN
STATISTICS CANADA
59
-informal testing (pretesting);
- cognitive methods;
- focus groups;
- interviewer debriefings;
- behaviour coding of interviewer/respondent interactions;
- split sample tests;
- pilot tests.
5.1.5.1 Informal Testing (Pretesting)
Informal testing (sometimes referred to as pretesting) is easy and inexpensive and is a fundamental step in
the development of a questionnaire. If no other testing of the questionnaire is done, as a minimum,
informal testing should be performed. The size of the informal test sample can range from 20 to 100 or
more respondents. If the main purpose is to discover wording or sequencing problems, very few
interviews are needed. More interviews (50 to 100) are necessary to determine response categories for
closed questions based on the responses to open questions in the informal test. The questionnaire should
be administered in the same manner as planned for the main survey (e.g., interviewer-assisted in person or
by telephone; paper or computer-assisted). However, self-enumeration questionnaires should be tested
using an interviewer.
With informal testing, respondents are not debriefed; the respondent simply completes the questionnaire
or interview, mirroring what would happen during the actual data collection. Informal testing only
indicates where there is a problem. Without further investigation, it does not identify why or how it can
be corrected. Also, informal testing may not identify all problems with the questionnaire.
Informal testing of questionnaires is used to:
- discover poor question wording or ordering;
- identify errors in questionnaire layout or instructions;
- identify problems with the computer software application, if computer-assisted;
- determine problems caused by the respondent's inability or unwillingness to answer the questions;
- suggest additional response categories that can be pre-coded on the questionnaire;
- provide a preliminary indication of the interview length and response rate (including item
nonresponse).
5.1.5.2 Cognitive Methods
Cognitive methods are especially useful in testing questionnaires because they are designed to investigate
the steps in the response process. Cognitive methods provide the means to examine a respondent’s
thought processes as he or she answers the survey questions. In this way, cognitive methods help assess
the validity of questions and identify potential sources of response and nonresponse error.
Cognitive interviews provide the opportunity to evaluate the questionnaire from the respondent’s point of
view. They focus on issues such as comprehension and reactions to the form. This brings the respondent’s
perspective directly into the questionnaire design process, and leads to the design of respondent-friendly
questionnaires that can be easily understood and accurately completed.
Cognitive interviews often take place in a ‘laboratory’ setting or room that has a one-way mirror for
observation. Sample sizes are relatively small. As few as 12 to 15 to as many as 100 or more cognitive
72.
SURVEY METHODS ANDPRACTICES
STATISTICS CANADA
60
interviews are used to test a preliminary version of a questionnaire. Because sample sizes are relatively
small, an iterative approach is sometimes adopted whereby changes are made to the questionnaire
following a few cognitive interviews before further testing takes place.
Cognitive testing methods include:
i. The observation of respondents
The respondent is observed while completing the questionnaire. Observation provides information on
respondent behaviour such as:
- areas of the questionnaire that are read;
- the sequence in which questions are answered;
- whether reference is made to instructions;
- the types of records consulted;
- whether another person is consulted;
- the time required to complete each section;
- corrections or changes made to responses.
ii. Think aloud interviews
The respondent is asked to ‘think aloud’ while answering the questions, commenting on each question,
and explaining how the final response was chosen. This type of think-aloud interview is called a
concurrent think-aloud interview. If instead, the respondent explains his/her thought processes afterwards
during a follow-up discussion, then the interview is called a retrospective think-aloud interview. Both of
these methods are very useful in testing questionnaires and in identifying potential sources of error and
improvements that can be made.
Specific techniques such as probing questions, paraphrasing and confidence ratings are used during
cognitive interviews.
a. Probing questions
Probing questions are used to focus on particular aspects of the response process (i.e., understanding,
retrieving, thinking or responding). For example, the interviewer may ask how and why a respondent
chose an answer, or how concepts, words and time reference periods were interpreted.
b. Paraphrasing
The respondent is asked to repeat the instructions or the question in his or her own words, or to explain
the meaning of terms and concepts. Paraphrasing helps determine whether a respondent has read and
understood the instructions and questions as intended.
c. Confidence ratings
The respondent rates the degree of confidence in the accuracy of his or her own answers. This technique
indicates to what extent the respondent had difficulty in formulating an answer to a question and whether
or not guessing was involved.
73.
QUESTIONNAIRE DESIGN
STATISTICS CANADA
61
5.1.5.3Focus Groups
A focus group is a discussion of a selected topic by participants who are chosen from the population of
interest. Focus groups provide the opportunity to consult with members of the target population, data users, or
interviewers so that their points of view can be brought into the questionnaire design process. In the early
stages of questionnaire development, focus groups can be used to clarify survey objectives and data
requirements, to identify salient research issues, definitions, and concepts. Focus groups are also useful in
testing questionnaires. They are used to evaluate a respondent's understanding of the language and wording
used in questions and instructions, and to evaluate alternative question wordings and formats.
A focus group is led by a moderator who is knowledgeable about group interviewing techniques and the
purpose of the discussion. The size of each group is usually between 6 and 12 persons, with the optimum size
being 7 to 9 persons. A focus group usually lasts for about two hours. Focus groups are audio-recorded (and
sometimes video-recorded) and can be viewed by observers in an adjoining room behind a one-way mirror.
The observation of focus groups by the questionnaire developers is recommended. Although observers do not
take part in the focus group discussion, their observations can be helpful when communicated to the
moderator at the end of the focus group session.
If a self-enumeration questionnaire is being tested, then the questionnaire can be completed immediately prior
to the focus group discussion (time permitting) or completed in advance and brought to the focus group
session by the respondent. If the questionnaire is interviewer-assisted, the interviewers can administer the
questionnaire a few days before the focus group takes place.
A useful technique is to begin the focus group discussion by asking participants to provide their overall
reaction to the questionnaire. Specific questions and issues concerning the questionnaire are then discussed.
The focus group moderator reviews the whole questionnaire question-by-question or focuses on specific
questions of interest. The moderator should be skilled at probing since some focus group participants may be
reluctant to make negative comments even if they are pertinent. The moderator should also give each member
the opportunity to speak, to avoid situations where one or two persons dominate the discussion. The focus
group can be concluded by asking participants to recommend the most important improvement that they feel
should be made to the questionnaire.
5.1.5.4 Interviewer Debriefings
Interviewer debriefings often take place after a focus group session or during informal tests. Interviewers
discuss their experiences interviewing respondents and provide an understanding of how the
questionnaire is performing. Their perspective can identify questionnaire improvements. Interviewer
debriefings usually take place in a group setting that is very similar to a focus group. Alternatively, rating
forms or debriefing questionnaires can be used to collect information about problems encountered with
the questionnaire and suggestions for improvements.
5.1.5.5 Behaviour Coding of Interviewer/Respondent Interactions
While the questionnaire is being administered by an interviewer, behaviour coding can be conducted.
This type of testing involves the systematic coding by a third party of the interaction between the
interviewer and the respondent. The focus is on how the interviewer asks the questions and how the
respondent reacts. The test interview is often audio-recorded and the interviewer-respondent relation is
later analysed. Behaviour coding helps identify problems such as the interviewer failing to read the
74.
SURVEY METHODS ANDPRACTICES
STATISTICS CANADA
62
question as worded or a respondent asking for clarifications. If behaviour coding indicates difficulties
with a certain question, then corrective action may be warranted. Behaviour coding does not, however,
usually provide information about the reasons for the problems nor solutions to them. A large sample size
is often required to analyse the results of behaviour coding, especially if the questionnaire has many skip
patterns that take respondents through various paths of the questionnaire.
5.1.5.6 Split Sample Tests
Split sample tests are conducted to determine the ‘best’ of two or more alternative versions of a
questionnaire or question. Split sample testing is sometimes called ‘split ballot’ or ‘split panel’
experiments. It involves an experimental sample design that is incorporated into the data collection
process. In a simple split sample design, half of the sample receives one version of the questionnaire
while the other half receives the other version.
Besides comparing variations in questions, split sample tests can also compare different methods of data
collection in order to determine which method is better. A probability sample design and adequate sample
sizes are required to analyse differences between the samples.
5.1.5.7 Pilot Test
A pilot test is conducted in order to observe all stages of the survey process, including administration of
the questionnaire. A pilot study is a ‘dress rehearsal’; it duplicates the final survey design on a small scale
from beginning to end, including data processing and analysis. It allows the statistical agency to see how
well the questionnaire performs during all the steps in a survey (data collection, editing, imputation,
processing, data analysis, etc.). Normally, the questionnaire is thoroughly tested using the methods
mentioned previously before a pilot test takes place.
5.1.6 Finalise the Questionnaire
Questionnaire design is an iterative process: throughout questionnaire development and testing, changes
are continually being made. Objectives and information requirements are formulated and re-evaluated,
data users and respondents are consulted, proposed questions are drafted and tested, questions are
reviewed and revised until a final questionnaire is developed. The final stage of the process comes when
the decision is made that no further changes will be made to the questionnaire. At this point, the
questionnaire is finalised and printed or programmed, depending on the data capture method being used.
5.2 Types of Questions: Open versus Closed
There are two types of questions: open and closed. Open questions are those where response categories
are not provided to the respondent. The respondent provides an exact numerical figure or answers the
question in his or her own words which is either written down, in the case of self-enumeration, or
recorded verbatim by the interviewer. Open questions should be followed by sufficient space to record the
response.
An example of an open question is:
75.
QUESTIONNAIRE DESIGN
STATISTICS CANADA
63
Whatis the most important problem facing Canada?
Closed questions are those where response categories are listed with the question. Closed questions are
answered by checking a box or circling the proper response from those provided. The possible responses
listed for a question are called response categories.
An example of a closed question is:
Which of the following is the most important problem facing Canada? (Please check one only)
Unemployment
Economy/Recession
Federal Deficit
Taxes
National Unity
Crime/Violence
Environment
Other
Open questions allow the respondent to express an answer without being influenced by the response
categories that would be provided by a closed question. However, this allows the question to be
interpreted different ways. An open question therefore generally expands the scope of the question while
the closed version gives the respondent clues about how the question is to be interpreted. Closed
questions also restrict the respondent to a predetermined set of responses.
There are several applications of open questions. One advantage of open questions is that they allow the
respondent the opportunity for self-expression or elaboration. This is important when examining an issue
that is not well understood or is very broad. Consequently, open questions are often used during
questionnaire development and testing. For example, they are used in focus groups to obtain comments
and opinions on the question presented and to generate discussion. Open questions also allow the
statistical agency to obtain the respondent’s own ‘natural’ wording. This is important when examining
question wording and response categories for a closed question.
Another advantage of open questions is that they can be used to obtain exact numerical data, for example
a respondent’s exact age. Business surveys often ask for exact amounts for reported revenues and
expenses. Exact numerical data are necessary for certain types of data analysis (e.g., to calculate an
average or median).
Another use of open questions is to provide follow-up to closed questions. For example, a closed question
may ask:
Do you have any suggestions to improve our service to our customers?
No
Yes
If the respondent answers ‘Yes,’ then a follow-up open question might be:
76.
SURVEY METHODS ANDPRACTICES
STATISTICS CANADA
64
If yes, what are your suggestions?
Open questions such as ‘Do you have any additional comments?’ are often used at the end of sections of
questions or at the end of the questionnaire. This ensures that the respondent has the opportunity to
include everything that he or she feels is relevant to the issues being addressed by the questionnaire.
Some respondents may want to include additional information to clarify an answer. It is important to plan
for this type of information on the questionnaire.
There are disadvantages to open questions with write-in (as opposed to numeric) responses. They are
burdensome since the respondent must determine the intent of the question and formulate an answer
without the aid of response categories. And for self-enumeration surveys, recording the answer is time-
consuming. For interviewer-assisted surveys, data collection, capture and coding is burdensome. It is
often difficult for the interviewer to capture the respondent’s answer verbatim and after collection, in
order to facilitate processing and data analysis, all of the different responses are usually categorised and
assigned a numerical code. Open questions, therefore, usually lead to more costly, time-consuming and
error-prone processing than closed questions.
In the case of numerical data, open questions are more difficult for respondents to answer than closed
questions and more difficult and prone to error during data capture.
Examples of open questions requiring write-in responses are:
What products or services does your business provide?
What do you think you will be doing 5 years from now?
Please comment further on any questions or issues covered in this questionnaire
Examples of open questions requiring numeric responses are:
What is your best estimate of the total income before taxes and deductions of all household
members from all sources in the past 12 months?
How many years has the current owner operated this establishment?
In a typical month, how often do members of your household use the Internet at home?
There are numerous advantages to closed questions, the most important ones being that they are less
burdensome to respondents and data collection and capture is cheaper and easier. They are quicker and
easier to answer since respondents simply choose the appropriate response categories rather than
formulate a response and state it in their own words. The respondent is more likely to answer the question
as intended because the response categories indicate the focus of the questions. It is easier to analyse data
that has been collected using closed questions, since the answers are more consistent and already grouped.
Also, if a question is being used for several surveys, using the same response categories facilitates
comparisons across surveys.
77.
QUESTIONNAIRE DESIGN
STATISTICS CANADA
65
Thereare several disadvantages to closed questions. When drafting the questions, effort is sometimes
required to develop the response categories (i.e., coding is done before collection, but it can still be
difficult). As with all coding, the response categories must be mutually exclusive and exhaustive. If the
response categories are not clearly formulated, the respondent could have more problems than if an open
question were used. Another concern with closed questions is that because response categories are listed,
the respondent may feel obliged to choose one of the response categories whether or not her or she has
formulated an answer or even has the knowledge required to answer the question. For questions where an
opinion is asked, this can force the respondent to choose a category that does not correspond to his or her
opinion, or to express an opinion when in fact he or she has none. (To avoid this situation, a ‘Do not
know’ and/or ‘Not applicable’ category is sometimes included. For interviewer-assisted questionnaires, it
is common practice to include a ‘Refused’ response category.) Another potential problem is that response
categories can oversimplify an issue by restricting a respondent’s possible answer.
There are several kinds of closed questions: the most frequently used are two choice, multiple choice and
checklist, ranking and rating questions. They are described below.
For more information on coding open and closed questions, see Chapter 10 - Processing.
5.2.1 Two-Choice Questions
The two-choice question is the simplest version of a closed question. Often it is a yes/no question and is
used to split the respondents into two distinct groups. Two-choice questions are also used as screening
questions to prevent respondents from being asked a series of questions that do not apply to them. The
direction ‘Go to question X’ then appears directly after one of the response categories so that the
respondents can skip some questions. This results in what is referred to as skip patterns in a questionnaire.
For example:
Did you smoke cigarettes yesterday?
Yes
No -------------Go to Question 14
5.2.2 Multiple Choice and Checklist Questions
The multiple choice question asks the respondent to select one response from a list of choices, whereas
the checklist question asks the respondent to pick one or more responses from the list. It may not be
evident to the respondent whether the question is multiple choice or checklist. Therefore, instructions
should be included. Note that an ‘Other (specify)’ category is normally provided to ensure that the list is
exhaustive.
Example of a multiple choice question:
What type of dwelling is this? (Check one only)
78.
SURVEY METHODS ANDPRACTICES
STATISTICS CANADA
66
Single house
Double (side-by-side)
Garden home, town house or row house
Duplex (one-above-another)
Low-rise apartment (less than 5 stories)
High-rise apartment (5 stories or more)
Other (please specify)______________
Example of a checklist question:
During your vacation, in what types of accommodation did you stay? (Check as many as apply)
Hotel (including tourist home)
Motel
Camping or trailer park
Home of friends or relatives
Commercial cottage or cabin
Other (hostels, universities, etc.)
The response categories for multiple choice and checklist questions require careful drafting. The list of
response categories should be mutually exclusive and exhaustive. Consider the following example:
How old are you in years?
20-30
30-40
40-50
50 or more
The categories in this example are not mutually exclusive; they overlap. A respondent who is 30, 40 or 50
years old has a choice of two response categories. Data analysis would be difficult since it is impossible
to know which category such a respondent would choose. Another problem with the response categories
is that the list is not exhaustive. If persons under 20 are part of the target population, how would they
answer this question? A better choice of response categories would be:
How old are you in years?
under 20
20-29
30-39
40-49
50 or more
5.2.3 Ranking Questions
Another type of closed question is the ranking question, where the respondent is asked to order the
response categories. For example:
Here is a list of some of the ways that people go about finding jobs. Please rank them in order of
effectiveness by placing the number ‘1’ beside the method you think would be most helpful, a ‘2’
beside the method you think would be second most helpful, and so on.
79.
QUESTIONNAIRE DESIGN
STATISTICS CANADA
67
____Mailing out résumés
____ Newspaper or magazine ads
____ Government Employment Centres
____ Checking with friends
____ A private placement service
____ Direct contact with employers
____ Other (please specify) ________________________________
Respondents often find it burdensome to rank categories, especially if the items to be ranked are very
different from each other, or if the interview is conducted over the telephone. Another problem with
ranking questions is that the sizes of the rank intervals are unknown and unlikely to be equal: the interval
between 1 and 2 cannot be interpreted to be the same as that between 2 and 3. This complicates data
analysis. For example, if three items are listed to be ranked, a respondent will rank them 1, 2 and 3, but it
may be that the respondent considers the first two to be very close and the last item to be a distant third.
Such information cannot be gleaned from the simple ranking. Another problem is that a respondent may
assign two or more items the same ranking. In the above example, a respondent might rank both
‘Newspaper or magazine ads’ and ‘Government Employment Centres’ as 1. Another problem with
ranking questions is that respondents may not be able to rank all the choices on the list. It may be
reasonable to expect respondents to only rank a few (e.g., five or less).
The following is an example of a ranking question where the respondent is asked to select the most
important factors and then rank only the ones that are important.
Please rank the 5 most important factors that influence your company's choice of a
transportation carrier. This information will help us to focus our attention and resources on
areas that are critical to meeting your service needs.
Please rank their importance by placing the number ‘1’ beside the factor that you think is the
most important, a ‘2’ beside the factor that you think is the second most important, and so on.
___ Damage-free transportation
___ Price
___ Marketing and sales representatives
___ Customer service representatives
___ Prompt resolution of service problems
___ Freight claims handling
___ Service consistency
___ Service frequency
___ Transit time
___ Timely notification of service delays
___ Invoicing accuracy
___ Other (please specify)
5.2.4 Rating Questions
With rating questions, respondents are asked to rate their answer. For example:
80.
SURVEY METHODS ANDPRACTICES
STATISTICS CANADA
68
How satisfied are you with our customer service?
Very satisfied
Satisfied
Dissatisfied
Very dissatisfied
There are several considerations when formulating a rating question. First, how many categories should
the rating scale have? It could have just two – agree, disagree – or as many as 10, ranging from 1(not at
all important) to 10 (extremely important).
Second, there is the issue of whether or not the rating scale should have a neutral alternative – for
example, neither satisfied nor dissatisfied. In the absence of a neutral alternative, the respondent is forced
to make a choice. On the other hand, when a neutral response category is offered, respondents tend to
choose it. One option is to include the neutral alternative in an interviewer-assisted questionnaire but not
offer it to the respondent. This way it is selected only if the respondent spontaneously expresses it.
The above example does not offer a neutral alternative; the one below does.
How satisfied are you with our customer service?
Very satisfied
Satisfied
Neither satisfied nor dissatisfied
Dissatisfied
Very dissatisfied
The third consideration when formulating a rating question is whether to include a category such as ‘Do
not know/no opinion’ or ‘Not applicable’. This depends on the question being asked. For example, when
asking about a particular service that the respondent may have never used, it is necessary to include a ‘not
applicable’ category.
For each of these issues (the number of categories on rating scale, the use of a neutral alternative, the use
of ‘not applicable’), the solution depends on the survey objectives, the item to be rated, the method of
data collection and the statistical agency's own preferences.
The ranking question presented earlier in section 5.2.3 about the choice of transportation carriers can be
reformatted as a rating question as follows:
Listed below are a number of factors that influence a company's choice of a transportation
carrier. Some may be more or less important to your company than others. According to your
company's priorities, please rate the importance of each factor from 1 to 10 where 1 means ‘Not
at all important’ and 10 means ‘Extremely important’.
___ Damage-free transportation
___ Price
___ Marketing and sales representatives
___ Customer service representatives
___ Prompt resolution of service problems
___ Service consistency
___ Service frequency
___ Transit time
___ Timely notification of service delays
___ Invoicing accuracy
81.
QUESTIONNAIRE DESIGN
STATISTICS CANADA
69
Whilethe rating question version would take longer to ask in an interview, it is much easier for the
respondent to rate each response category than to rank the response categories. This is particularly true for
telephone interviews.
5.3 Guidelines for Wording Survey Questions
Questions should be formed so that they are clear and meaningful to survey respondents. Survey data will
be of higher quality if respondents can easily understand the meaning of the words used. Respondents will
also be more willing and able to provide information if they clearly understand what is being asked of
them. Furthermore, it is essential that respondents understand a survey question in the way intended by
the questionnaire designer.
The wording of a question can distort survey results and provide inaccurate data if respondents:
- do not understand what the words in a question mean;
- interpret the words differently than intended;
- are unfamiliar with the concept(s) conveyed by the wording of a question.
To avoid these problems, the following sections describe some general guidelines to keep in mind.
5.3.1 Keep it Simple
The best way to communicate clearly with respondents is to use simple, everyday words and to make sure
that all terms are appropriate for the population being surveyed. The following question does not use
simple, everyday language.
Are you aware of the impending amalgamation of surrounding constituencies into the New Metro
area?
Many survey respondents may not be aware of, or understand, the meaning of the terms: impending
amalgamation, constituencies, or New Metro area.
Always consider the language skills of respondents when developing questions. Try to choose words that
are easy for everybody to understand. When surveying more educated populations such as lawyers,
teachers or other professionals, it is possible to use more complex language. The important thing is that
the language used should correspond to what is commonly understood by the target population.
In general, avoid using technical words or specialised jargon with which respondents are unfamiliar.
However, if such terms are needed, respondents should be given additional clarification or definitions.
New or complex concepts must be defined so that all respondents have the same understanding of the
question. Definitions can be included in the question, in a set of instructions for respondents that appears
elsewhere on the questionnaire or in a separate instruction booklet (although a separate booklet is less
likely to be read).
The following question does not use simple, common words.
Have you ever received a pneumococcus vaccination?
82.
SURVEY METHODS ANDPRACTICES
STATISTICS CANADA
70
It is likely that most people in the general population would not know the medical term, pneumococcus,
and thus would have a hard time answering the question. As a result, many people would probably not be
able to provide an accurate response. Better wording would be:
Have you ever received a flu vaccination?
5.3.2 Define Acronyms and Abbreviations
Acronyms and abbreviations are often found in technical and scientific writing, as well as in legal and
business writing. They are best used in contexts where readers are familiar with them. In surveys of the
general population, they should not be used unless they are commonly used. Questions are more likely to
be clearly understood if they contain the complete form of the word, term or organisation they refer to,
rather than the abbreviation. Any acronyms or abbreviations that must be used should always be defined
first.
The following question uses an acronym that may confuse respondents.
Do you know the location of the nearest PFRA office?
Many respondents will not know that PFRA is the acronym for Prairie Farm Rehabilitation
Administration.
5.3.3 Ensure that Questions are Applicable
It is important to make an effort to minimise the burden on respondents. One important way to do this is
to ensure that respondents are only asked questions that are relevant to them. This reduces the length of
interviews, cuts down on the time respondents are required to participate, and lowers the cost of the
survey.
For example, the following question would not apply to all respondents – only to those who are
employed.
What is your present occupation?
This question should follow a screening question designed to find out if a respondent is employed, and it
should only be asked of those who indicate that they are. Although the question seems harmless, it could
prove annoying to those who are not employed.
Questionnaire designers should also ensure that respondents have enough knowledge to answer the
questions asked. If not, they may choose not to respond, or they may give a false answer. For example,
few people in the general population have enough specialised knowledge to provide an informed answer
to the following question.
Do you think that incineration at 1600o
C for 30 minutes is an adequate way to dispose of
polychlorinated biphenyls?
83.
QUESTIONNAIRE DESIGN
STATISTICS CANADA
71
5.3.4Be Specific
The wording of survey questions must be as specific as possible to ensure that respondents understand
exactly what is required of them. Here, a similar process as that used to define concepts, presented in
Chapter 2 - Formulation of Survey Objectives, is used. The questionnaire designer must ask: Who?
What? Where? and When? For each question, it should be clearly specified:
- Who the question applies to;
- What information should be included in or excluded from the response;
- What units the answer should be provided in (e.g., kg or lbs);
- What time period the question refers to (When?).
At first glance, the following question may seem simple and straightforward.
What is your income?
Upon reflection, however, the question is not that easy to answer. First, it is not evident who the word
your refers to. Does it refer to the respondent’s personal income, his or her family income, or his or her
household income? This should be made clear. Second, what is the time period that the respondent should
provide the requested income information for? Last week, last month, or last year? Finally, what should
the respondent count as income? Salary and wages only? Salary and wages including gratuities? Salary
and wages, as well as income from other sources? Or something else?
The following two examples show better ways to ask the question (assuming that ‘household’ has been
defined for the respondent).
What was your household's total income, from all sources before taxes and deductions, for last
year?
Last year, what was your total household income before deductions? Include income that you
received from wages, salaries, and all other sources.
The following question illustrates the problem that can occur when the wording of a question is not
specific enough. Prior to being asked this question in a survey, respondents were shown a bottle of orange
beverage (A Civil Action 47LL (1945), U.S. D.C. N.J., U.S. vs 88 Cases – Bireley’s Orange Beverage).
How much orange juice do you think it contains?
Here are examples of the many different responses that could be given:
one orange and a little water and sugar
25% orange and 75% carbonated water
juice of one half dozen oranges
3 ounces of orange juice
full strength
a quarter cup of orange juice
none
not much
one-fourth orange juice
very little, if any, orange juice
do not know
not very much
3 to 4 ounces of orange juice
a pint
most of it
about a glass and a half.
More precise ways to word the orange juice question follow:
84.
SURVEY METHODS ANDPRACTICES
STATISTICS CANADA
72
This bottle holds 300 ml of a drink. How many millilitres of that would you say is orange juice?
___ ml
What percentage of this drink would you say is orange juice? ___ %
What part of this drink—a quarter, a half, three-quarters, or what—would you say is orange
juice? ___
Each of these questions requests an answer in specific units: millilitres, a percentage, or a fraction. By
asking the questions in one of these ways, the statistical agency is more likely to be given responses in the
units mentioned in the question.
5.3.5 Avoid Double-Barrelled Questions
A question that actually asks two questions in one is called a double-barrelled question. These
questions generally deal with more than one concept. For example:
Do you plan to leave your car at home and take the bus to work during the coming year?
This question may be very difficult for some respondents to answer since their personal situation may not
fit into a simple yes or no. For example, a respondent may plan to:
- take the car sometimes and take the bus sometimes;
- always leave the car at home and always bicycle to work;
- take the car sometimes and bicycle to work sometimes;
- always leave the car at home and always travel to work by some other means;
- take the car sometimes and travel to work by some other means sometimes;
- some other combination.
The question really asks two questions: Do you plan to leave your car at home during the coming year?
and Do you plan to take the bus to work during the coming year? The best solution may be to split the
question into these two questions.
Questionnaire designers should review all questions containing the words and and or to see whether they
are likely to confuse respondents. It is a good idea to examine the objective of such questions to
determine if a single question is appropriate or whether it would be better to:
- split the question into two or more questions;
- highlight key words in the question;
- provide clarifying instructions;
- provide examples;
- ask only what is relevant to the survey’s objectives.
That being said, it is important to recognise that not all questions containing the words and and or are
necessarily double-barrelled. For example:
What is the language you first learned and still understand?
The objective of this question is to determine, among the languages the respondent understands, which
was the first one learned. The answer required is the language that satisfies both conditions in the
question. Although this may be evident to the questionnaire designer, some respondents may not be sure
85.
QUESTIONNAIRE DESIGN
STATISTICS CANADA
73
howto respond. To help respondents understand what is required, it is a good idea to provide instructions
with examples, and to emphasise the word and in the question, for example:
What is the language you first learned and still understand?
(Respondent instructions: This question is asked to determine the language that satisfies the
two conditions, language you first learned and still understand. For example, a person may
have first learned Chinese but no longer understands it because he/she emigrated to Canada
at a very young age. Hence, the response Chinese would be incorrect since it does not satisfy
the two conditions of the question. Subsequently, the next language learned was English and
the person still understands it. In this case, the correct response to the question is English,
which is the language first learned and still understood.)
5.3.6 Avoid Leading Questions
A leading or loaded question is one that suggests or leads the respondent to a certain answer. In other
words, the way the question is phrased has an influence on the response. Leading questions can distort
survey responses and affect survey results.
Leading question:
Please tell me whether you agree with, disagree with, or have no opinion on the following
statement: ‘Tourism is beneficial to Northumberland County and therefore should be promoted.’
Neutral question:
Please tell me whether you agree with, disagree with, or have no opinion on the following
statement: ‘Tourism to Northumberland County should be promoted.’
Survey questions should ensure that all possible alternatives are clear to the respondent. If not, it can
result in a leading question that adversely affects the survey results. The following question leads to only
one response alternative (Payne, 1951).
Do you think most manufacturing companies that lay off workers during slack periods could
arrange things to avoid layoffs, giving steady work right through the year?
Yes
No
No option
Results
63% Yes, companies could avoid layoffs
22% No, companies could not avoid layoffs
15% No opinion
In this question, the only alternative offered respondents is whether they think companies can arrange
things to avoid layoffs. Often, when only one alternative is presented, there is a tendency for respondents
to agree with that alternative. In this example, 63% of respondents said they thought that companies could
avoid layoffs—the only option provided in the question. An alternate wording for the same question
follows.
86.
SURVEY METHODS ANDPRACTICES
STATISTICS CANADA
74
Do you think most manufacturing companies that lay off workers during slack periods could
arrange things to avoid layoffs, and provide employees with steady work throughout the year, or
do you think that layoffs are unavoidable?
Yes, companies could avoid layoffs
No, layoffs are unavoidable
No opinion
Results
35% Yes, companies could avoid layoffs
41% No, layoffs are unavoidable
24% No opinion
This question includes two clear alternatives: companies could avoid layoffs and layoffs are unavoidable.
When this question was asked, the results were more evenly distributed between yes, no and no opinion
than for the previous question.
In theory, providing possible alternative responses in the question makes it more likely that people will
reflect on the answer before responding and thus provide a more reliable answer.
5.3.7 Avoid using Double Negatives
Sentence structures that contain double negatives should be avoided because respondents will not know
whether they agree or disagree. For example,
Would you be for or against not allowing the sale of alcohol in convenience stores?
To answer the question, the respondent would have to figure out that being for not allowing the sale of
alcohol in convenience stores would be to be against allowing it. Similarly, to be against not allowing the
sale of alcohol in convenience stores would be the same as being for allowing it.
This question is difficult because it contains a double negative: against and not are both negative words.
Questions containing double negatives are often confusing to respondents who, without realising it, may
give an answer that contradicts their beliefs. It is far better to rephrase the question so that it contains no
more than one negative word. A clearer version of this question follows:
Would you be for or against allowing the sale of alcohol in convenience stores?
5.3.8 Soften the Impact of Sensitive Questions
Questions that respondents consider sensitive, personal or threatening may lead to social desirability bias.
Respondents tend to choose the response that is most favourable to their self-esteem, or that accords with
social norms, rather than express a real belief or reveal the truth. This can result in the under-reporting of
behaviours or characteristics being measured.
For example, the following questions may result in social desirability bias:
Was there ever a time when you were not able to provide for your family?
87.
QUESTIONNAIRE DESIGN
STATISTICS CANADA
75
Haveyou ever driven a motor vehicle after having had too much to drink?
What is your income?
How much do you weigh?
In the past month, how often have you participated in chat groups on the Internet?
Have you ever thought about committing suicide?
As mentioned in Chapter 4 - Data Collection Methods, some methods of data collection (namely, self-
enumeration questionnaires and telephone surveys) are more anonymous than others, so respondents are
less threatened by sensitive questions. If the questionnaire is administered by an interviewer, sensitive
questions, in particular, should not be asked of a respondent when others are present.
Careful wording can also help reduce the impact of sensitive questions on survey responses. There are
several techniques for asking a sensitive question in a less threatening way. One approach is to introduce
the question by suggesting that the sensitive behaviour is not uncommon. Terms such as many people or
most people can be used to introduce the question. When using this technique, care must be taken not to
introduce bias (i.e., the question should not induce the respondent to report behaviour that never
occurred). Another technique is to use warm-up questions; lead into the sensitive question with a number
of related, less sensitive questions. A third technique is to use a closed question with a range of response
categories. For example, for personal information such as age or income, or the frequency of undesirable
behaviour, the respondent may be more willing to answer the question if a range of responses is provided.
For example:
What was your total personal income before deductions last year? (Include income that you
received from wages, salaries, and all other sources.)
Less than $20,000
$20,000 to $39,999
$40,000 to $59,999
$60,000 to $79,999
$80,000 to $99,999
$100,000 or more
5.3.9 Ensure that Questions Read Well
Survey questions should be as concise as possible and use everyday language that the survey population
has no trouble understanding. Respondents should be addressed in the second person (you) for a friendly,
personal tone and basic rules of grammar should be followed.
The most important test is how the questions sound when read out loud. They should sound natural and
conversational, and be easy for the listener to follow. The following question does not follow this
guideline.
How would you rate the usefulness of the provision of information on the psychological and
sociological aspects of transition such as access to the computerised interactive vocational
counselling program provided by the departmental regional office to retiring employees where
available and as determined by the regional personnel officer?
88.
SURVEY METHODS ANDPRACTICES
STATISTICS CANADA
76
This question is too long, uses complex language and constructions and sounds stiff and bureaucratic – all
of which makes it difficult to understand and answer.
5.4 Response Error
In Chapter 3 - Introduction to Survey Design one of the sources of nonsampling error discussed was
measurement error, which is the difference between the recorded response to a question and the ‘true’
value. In the questionnaire design literature, this error is more commonly referred to as response error.
Since the questionnaire is the means by which data are collected, it can be a major source of response
errors. It is therefore crucial that the questionnaire be designed and tested to minimise such errors.
5.4.1 Sources of Response Error
Response errors can occur anywhere in the question-answer-recording process. The errors can be
attributed to the questionnaire, the respondent, the interviewer, the method of data collection or the
measuring tool (in the case of a direct measurement survey).
Sources of response error due to the questionnaire have already been mentioned in previous sections. For
example, closed questions can force the respondent to choose a response whether or not he or she has an
opinion or even the knowledge to answer the question, and social desirability bias can be a problem with
sensitive questions. Any poorly worded question can be misinterpreted. In general response errors caused
by the questionnaire may be due to:
- the type of question (open or closed);
- the wording of the question;
- the length of the questionnaire (leading to respondent fatigue);
- the layout of the questionnaire (e.g., complicated skip patterns can cause errors, particularly for paper
questionnaires, see section 5.5);
- the processing of the questionnaire (see section 5.6).
The respondent may also have difficulty recalling past behaviours or events. This source of response error
is called memory error. One type of memory error is recall error whereby the respondent does not recall
all the events that occurred within the reference period. This results in the under-reporting of behaviours
or events. The reverse situation is also possible. The respondent may report activities that occurred
outside the reference period as having occurred during the reference period. This source of error is called
telescoping error and it usually results in the over-reporting of behaviours or events. This is because
respondents tend to report behaviours or events as having occurred more recently that they actually did.
This is called forward telescoping. Respondents may occasionally report that behaviours or events
occurred longer ago than they actually did. This is called backward telescoping. Generally speaking, the
longer the reference period, the greater is the recall loss (and hence the potential for recall error).
However, shorter reference periods tend to increase telescoping errors.
Repeated surveys can experience what is referred to as the seam problem, which occurs when an
abnormally large number of changes are reported at the seam of two reference periods compared to the
number changes within a reference period. It can be corrected using dependent interviewing.
Some examples of questions that require the respondent to recall past events or behaviours are:
In the last 12 months, how many times did you visit a medical doctor?
89.
QUESTIONNAIRE DESIGN
STATISTICS CANADA
77
Duringthe last month, which magazines have you read?
During the last week, which TV programs did you watch?
Interviewers can also be a source of response error. Each interviewer must ask the questions in the same
manner each time an interview is conducted. If there are several interviewers and one interviewer
modifies the wording of a question, then the meaning of the question can be changed. Interviewers may
also incorrectly record the response – carelessly or deliberately (believing that the respondent should have
answered differently) or through misinterpretation of the response. In direct measurement surveys, the
characteristic (e.g., blood pressure) could be incorrectly measured being measured by the interviewer.
Interviewers, by their reaction to answers, can also influence respondent behaviour. For example, if the
interviewer expresses surprise at how much a respondent spends on clothing, the respondent may report
less for subsequent expenditure questions.
5.4.2 Techniques to Reduce Response Error
The sources of response errors can be identified and techniques employed to reduce the impact of these
types of errors.
The length of the question may have an impact on response errors. Questionnaires often cover a variety of
topics. For questionnaires administered by an interviewer, it is difficult for the respondent to anticipate
the next question. A technique that aids the respondent to focus on a new topic is the use of longer
questions which are still specific, simple and clear. A longer version of a question gives the respondent
more time to formulate an answer. Research suggests that the longer question may stimulate the
respondent to talk more, and that this additional talk may aid the respondent's recall. Also, it may give the
respondent more time to think and to provide a more complete answer.
Short question:
What health problems have you had in the past year?
Long question:
The next question asks about health problems during the past year. This is something that we ask
everyone in the survey. What health problems have you had in the past year?
In order to reduce response errors introduced by interviewers, they should be well trained and quality
control procedures such as re-interviewing techniques should be implemented in order to identify
problems and provide retraining to the interviewers as needed.
To reduce response errors introduced by the questionnaire, every effort should be made to produce a well-
designed questionnaire as outlined in this chapter.
If problems with memory are detected in a questionnaire, any of the following techniques can be used:
i. The reference period can be shortened if it is determined that the respondent has difficulty
remembering all the events that occurred within the reference period.
90.
SURVEY METHODS ANDPRACTICES
STATISTICS CANADA
78
This can occur for events that occur frequently. For example, if there is a question about the number of
times the respondent visited the doctor in the last year it may be difficult to recall every occurrence if the
respondent visited the doctor often. With a shorter reference period, it is possible that the answers will be
more accurate than with the longer period. However, the reference period should not be so short that an
insufficient number of events are reported. During the evaluation of the questionnaire, the optimal length
for the reference period could be determined.
ii. Use of a calendar, or milestones like holidays can also help to minimise memory error.
iii. A technique to reduce telescoping errors is bounded recall.
Respondents are interviewed at the beginning and at the end of the reference period. The events identified
at the time of the first interview can be discounted if they are reported again during the second interview.
iv. Dependent interviewing can also be performed for repeated surveys to reduce response error.
With dependent interviewing information provided by a respondent in a previous cycle of the survey is
made available at subsequent cycles. This can help respondents place events in the requested time frame
and prevent them from reporting previously reported events.
v. If it is difficult for the respondent to report an event accurately, it may be possible to make use of
records.
For example, if the respondent is asked to report income for the past year, the respondent could confirm
the answer by referring to their income tax forms. There may be other situations where the respondent
keeps records. Some people keep records of household expenses, such as monthly telephone bills or
records of fuel purchases. The use of records to reduce memory errors is more likely to be applied to the
self-enumeration questionnaire.
vi. Another technique that is useful for self-enumeration questionnaires is the diary.
When it is important to collect detailed information over an extended period of time, the respondent can
use a diary to record the events as they occur. Diaries tend to be used for surveys on household
expenditures, food consumption, time use, television viewing and radio listening.
In the case of interviewer-assisted questionnaires, other techniques can be used to aid the respondent in
accurately answering the questions. If the respondent is asked to report food consumption over a 24-hour
period it may be difficult for the respondent to indicate portion sizes. The interviewer could have visual
aids available that would indicate various portion sizes and the respondent could select the appropriate
one.
Other survey design issues such as the timing of data collection can also improve recall, for example
scheduling an income survey in April.
5.5 Questionnaire Layout
In addition to question type and wording, the order of the questions, transitional statements, instructions
and the format of the questionnaire also play an important role in creating a quality questionnaire.
91.
QUESTIONNAIRE DESIGN
STATISTICS CANADA
79
5.5.1Sequencing of Questions
The order of the questions should be designed to encourage the respondent to complete and maintain
interest in the questionnaire or interview. The sequence of questions should be logical to the respondent
and facilitate recall. The questions should flow smoothly from one question to the next. Questions on a
subject should be grouped together.
i. Introduction
The introduction to the survey – read by or to the respondent – is very important because it sets the tone
for the whole questionnaire. The introduction of the questionnaire should:
- provide the title or subject of the survey;
- identify the sponsor of the survey;
- explain the purpose of the survey;
- request the respondent’s co-operation;
- explain why it is important to complete the questionnaire;
- ensure that the value of providing information is made clear to the respondents;
- explain how the survey data will be used;
- explain how the respondent can access the survey results;
- indicate that the answers will be kept confidential and indicate any agreements to share data with
other statistical agencies, government departments, clients, etc.;
- for mail surveys, provide the return address and the date for return.
ii. Opening questions
The opening questions play an important role in encouraging the respondent to participate in the survey.
The first question should relate directly to the purpose of the survey and apply to all respondents,
otherwise the respondent will question the relevance of the survey. The first questions should also be easy
to answer; starting with an open question that requires a detailed answer may lead to nonresponse if the
questionnaire is perceived to be too burdensome to complete.
iii. Placement of sensitive questions
Careful consideration should be given to the placement of sensitive questions. If introduced too early, the
respondent may be reluctant to answer them, while if asked at the end of a long questionnaire, respondent
fatigue may play a role in the quality of the answers. Therefore, sensitive questions should be introduced
at a point where the respondent is most likely to feel comfortable answering them and where they are
most meaningful in the context of other questions. For example, sensitive questions about health should
be introduced in the section with other health-related questions.
iv. Placement of demographic and classification questions
This information is often used for grouping purposes for data analysis and to allow comparisons across
surveys. The reason for asking these types of questions should be explained, for example, ‘The next few
questions will help to relate information on your health to that of other people with similar backgrounds.’
In the case of household surveys and other social surveys, the demographic information is occasionally
located at the end of the questionnaire.
92.
SURVEY METHODS ANDPRACTICES
STATISTICS CANADA
80
5.5.2 Transitional Statements
Transitional statements are used in questionnaires to introduce sections of related questions. Their use
is important in interviewer-assisted questionnaires because it indicates to the respondent that a new
topic is going to be discussed. For example:
Part A - We first would like to collect some background information about your farm
operation.
Part B - We would now like you to provide information about your production acreage in the
last year.
Part C - The next questions are about your farm business income statements during the last
year.
5.5.3 Instructions
Whether self-enumeration or interviewer-assisted, a questionnaire should include clear, short and
easy-to-find instructions. These instructions may be placed directly above the questions concerned, at
the beginning of the questionnaire, in a separate guide that accompanies the questions, on a fold-out
page, etc.
In the following example the instructions are included in bold as a part of the second question.
For whom did you work?
What kind of business, industry or service was this? Give a full description. For example,
paper box manufacturing, road construction, retail shoe store, etc.
If the instructions are located elsewhere in the questionnaire, the respondent or interviewer must be
told where to find the instructions. For example, the question could refer the respondent to
instructions in a reference guide. Sometimes instructions are included at the beginning of the
questionnaire or at the beginning of a section of the questionnaire. For example:
Note: The following questions refer to your job or business last week. If you did not have a
job or business last week, answer for your job of the longest duration since January 1. If you
had more than one job last week, answer for the job at which you worked the most hours.
In the above example, the directions are included before the questions are asked and may be presented in
a different typeface than that used for the questions.
Definitions should be provided at the beginning of the questionnaire if they are relevant to questions
throughout the questionnaire, otherwise they can be provided in the specific questions as required. The
use of boldface print emphasises important items such as reference or reporting periods so that the
respondent is more likely to think in terms of the reference period of the question. If it is necessary to
specify particular items as inclusions or exclusions, it is best to include them directly in the questions and
not as separate instructions. For example:
How many rooms are there in this dwelling?
93.
QUESTIONNAIRE DESIGN
STATISTICS CANADA
81
-Include the kitchen, bedrooms, finished rooms in the attic or basement, etc.
Last year, did any of the operators of this agricultural operation suffer a farm-related injury that
required medical attention from a health professional (doctor, nurse, etc.) or resulted in lost work
time?
- Include only injuries to operators of this agricultural operation.
- Do not include chronic health conditions.
What is the total area of field crops to be harvested this year, even if they were sown or planted in
an earlier year?
- Include all field crops whether the land area is owned, rented or leased from others.
- Include all land to be seeded even if it is not yet seeded.
- Report the areas only once, even if more than one crop will be harvested this year.
How many weeks per year do you usually work at this position? Please include paid vacation and
other paid leave.
For paper questionnaires, skip instructions should be clearly indicated. Well-placed and bold arrows
should be used to direct the respondent or interviewer to the next appropriate question. Skip instructions
should be clearly linked to the relevant response box (e.g., by lines connecting directly to the response
box or circle). Finally, the use of skip instructions should be minimised on self-enumeration
questionnaires.
5.5.4 Format Considerations
There are many considerations when organising the printed word on paper or a computer screen.
Consistency of typeface and font should be maintained for questions, instructions, headings and
transitional statements. The use of different typeface and font for questions and instructions allows the
respondent or interviewer to easily identify the questions. Titles and section headings are usually in a
larger font than the questions and response categories. The questions should be numbered consecutively
throughout the entire questionnaire. Numbers, titles or letters can indicate sections. Data entry codes that
appear on the questionnaire should not interfere with the questions or the numbering of the questions.
It is a good idea to provide titles or headings for each section of the questionnaire. For example:
INFORMATION FOR RESPONDENTS
SECTION 1: General Information
SECTION 2: Statement of Income
SECTION 3: Capital Expenditures
SECTION 4: Labour Force
SECTION 5: Comments
All aspects of the questionnaire relating to how the questionnaire looks must be considered. For self-
enumeration questionnaires, the front cover is extremely important since it must attract the attention of the
respondent. Decisions have to be made regarding the type and size of paper used for the questionnaire.
Colour can be used in several ways on questionnaires. Different versions of the questionnaire (e.g., for
different languages) can be printed on different coloured paper. As well, for questionnaires printed on
94.
SURVEY METHODS ANDPRACTICES
STATISTICS CANADA
82
coloured paper, the response boxes are white or a lighter shade of the same colour. This aids the
respondent or interviewer in finding the correct placement of the answer for each question.
The convention of using response boxes for open questions and response circles for closed questions is
another way to aid the respondent or interviewer. It is easier to identify where the answer should be
entered when using this convention. The circle for closed answer categories should be consistently placed
either before or after the answer. Graphics can be used to enhance the questionnaire. If appropriate, the
graphics can be used to indicate section topics but should not interfere with the completion of the
questionnaire.
For computer-assisted interview applications, Statistics Canada’s has developed standards in order to
present a common interface to all interviewers and reduce development, testing and training costs. These
standards apply to such things as:
- the use of colour and/or black and white;
- fonts;
- function keys;
- navigation keys;
- standard question screens;
- Microsoft Windows interface.
Details of these standards can be found in Screen Display and Functionality Standards for Social Survey
Full BLAISE Applications (2001).
5.6 Processing Considerations in Questionnaire Design
Processing transforms survey responses obtained during collection into a form that is suitable for
tabulation and data analysis. It includes all data handling activities after collection and prior to
estimation. In order to streamline processing, some activities – namely, data capture, editing and coding –
can be done during data collection with a computer-assisted application.
Processing tasks should be considered during the design and development of the questionnaire. The
coding scheme should be developed at the same time as the questions are drafted. The codes associated
with closed questions should appear on the paper questionnaire. As well, consideration should be given to
data capture when deciding on the layout of a paper questionnaire.
The ease with which data capture of paper questionnaires can be accomplished is affected by the layout of
the questionnaire. The consistent placement of numeric codes next to response categories and the
alignment of questions in columns facilitates data capture. All the processing steps involving the
questionnaire (data capture, coding, etc.) should be tested to ensure that the questionnaire works
effectively with these operations.
When drafting questions the impact on data capture should be considered. Each questionnaire should
include a unique identification number. This facilitates the verification of data capture. Sometimes it is
necessary to go back to the original questionnaire to determine if the information has been captured
accurately. For paper questionnaires, the data should be captured as soon as possible after receiving them.
This allows for the implementation of systems used to verify that the information on the file is the same
as the information on the questionnaire.
For more details on processing, see Chapter 10 - Processing.
95.
QUESTIONNAIRE DESIGN
STATISTICS CANADA
83
5.7Summary
This chapter addressed how to design and develop a questionnaire. The first step is the formulation of
survey objectives. Next, data users and respondents are consulted and questionnaires for similar surveys
are reviewed. A draft version of the questionnaire is composed which should be tested and revised
thoroughly before finalising the questionnaire. Testing can include: informal testing, cognitive testing,
focus groups, interviewer debriefings, behaviour coding, split sample tests and a pilot test.
Questions can be of two types: open or closed. Closed questions may be two-choice questions, multiple
choice, ranking or rating questions. Open questions allow for self-expression but can be burdensome and
time-consuming as well as difficult to analyse. Closed questions are usually less burdensome for the
respondent and data collection and capture is cheaper and easier. However a poor choice of response
categories can cause response error.
When wording a survey question, the following guidelines should be followed:
- keep it simple;
- define acronyms and abbreviations;
- ensure questions are applicable;
- be specific;
- avoid double-barrelled questions;
- avoid leading questions;
- avoid using double negatives;
- soften the impact of sensitive questions;
- ensure that questions read well.
The questionnaire should be designed to minimise possible response errors. The layout of the
questionnaire is also important. The introduction and sequencing of questions can help or hinder
respondent participation. Transitional statements introducing new topics should be used and instructions
for the respondent or interviewer should be clear, short and easy-to-find. The general format of the
questionnaire should be assessed for their impact on the respondent and interviewer: the font, section
headings, colour of the questionnaire, format of response categories, etc. Finally, how the questionnaire is
to be processed should be considered: it should be designed to facilitate data collection and capture.
Bibliography
Advertising Research Foundation. 1985. Focus Groups: Issues and Approaches. Advertising Research
Foundation, Inc., New York, New York. 10022.
American Statistical Association. 1993. How to Conduct Pretesting. The Section on Survey Research
Methods. American Statistical Association.
Babyak, C., A. Gower, L. Gendron, J. Mulvihill and R.A. Zaroski. 2000. Testing of Questionnaires for
Statistics Canada’s Unified Enterprise Survey. Proceedings of the International Conference on
Establishment Surveys II. American Statistical Association.
Biemer, P.P., R.M. Groves, L.E. Lyberg, N.A. Mathiowetz and S. Sudman, eds. 1991. Measurement
Errors in Surveys. John Wiley and Sons, New York.
96.
SURVEY METHODS ANDPRACTICES
STATISTICS CANADA
84
Bishop, G.F. 1987. Experiments with the Middle Response Alternative in Survey Questions. Public
Opinion Quarterly, 51: 220-232.
Bureau of the Census. Pretesting Policy and Options: Demographic Surveys at the Census Bureau. U.S.
Department of Commerce, Washington, D.C.
Carlson, Lynda T., J.L. Preston and D.K. French. 1993. Using Focus Groups to Identify User Needs and
Data Availability. Proceedings of the International Conference on Establishment Surveys.
American Statistical Association. 300-308.
Converse, J.M. and S. Presser. 1986. Survey Questions: Handcrafting the Standardized Questionnaire.
Sage University Paper Series on Quantitative Applications in the Social Sciences. 07-063. Sage
Publications, Thousand Oaks, California.
Couper, M.P. 2001. Web Surveys. Public Opinion Quarterly, 64(4): 464-494.
Desvousges, W.H. and J.H. Frey. 1989. Integrating Focus Groups and Surveys: Examples from
Environmental Risk Studies. Journal of Official Statistics, 5(4): 349-363.
Dillman, D.A. 1978. Mail and Telephone Surveys: The Total Design Method. John Wiley and Sons, New
York.
Dillman, D.A., M.D. Sinclair and J.R. Clark. 1993. Effects of Questionnaire Length, Respondent-friendly
Design, and a Difficult Question on Response Rates for Occupant-addressed Census Mail
Surveys. Public Opinion Quarterly, 57(3): 289-304.
Esposito, J.L., P.C. Campanelli, J.M. Rothgeb and A.E. Polivka. 1991. Determining Which Questions are
Best: Methodologies for Evaluating Survey Questions. Proceedings of the Section on Survey
Research Methods, American Statistical Association. 46-57.
Fowler, F.J., Jr. 1995. Improving Survey Questions: Design and Evaluation. Applied Social Research
Methods Series. 38. Sage Publications, Thousand Oaks, California.
Fowler, F.J., Jr. and T.W. Mangione. 1990. Standardized Survey Interviewing. Applied Social Research
Methods Series. 18, Sage Publications, Thousand Oaks, California.
Gower, A.R. 1994. Questionnaire Design for Business Surveys. Survey Methodology, 20(2): 125-136.
Gower, A.R. 1997. Asking Questions Using Combinations of Sequential, Matrix, Single Sheet and Book
Formats in a Test of the Canadian Census Questionnaire. Proceedings of Statistics Canada
Symposium 97: New Directions in Surveys and Censuses. Statistics Canada. 219-224.
Gower, A.R. and G. Haarsma. 1997. A Comparison of Two Methods in a Test of the Canadian Census
Questionnaire: Think-aloud Interviews vs. Focus Groups. Proceedings of the Minimum Standards
in Questionnaire Testing Workshop. Statistics Sweden. 35-37.
Gower, A.R., B. Bélanger and M.-J. Williams. 1998. Using Focus Groups with Respondents and
Interviewers to Evaluate the Questionnaire and Interviewing Procedures after the Survey Has
Taken Place. Proceedings of the 1998 Joint Statistical Meetings, Section on Survey Research
Methods. American Statistical Association. 404-409.
97.
QUESTIONNAIRE DESIGN
STATISTICS CANADA
85
Gower,A.R., K. McClure, A. Paletta and M.-J. Williams. 1999. When to Use Focus Groups versus
Cognitive Interviews in the Development and Testing of Questionnaires: The Statistics Canada
Experience. Proceedings: Quality Issues in Question Testing (QUEST 99). Office for National
Statistics, England. 51-66.
Jabine, T., E. Loftus, M. Straf, J. Tanur, and R. Tourangeau, eds. Cognitive Aspects of Survey
Methodology: Building a Bridge Between Disciplines. National Academy of Science,
Washington, DC.
Kalton, G. and H. Schuman. 1982. The Effect of the Question on Survey Responses: A Review. Journal
of the Royal Statistical Society, 145(1): 42-73.
Krueger, R.A. 1997. Analyzing and Reporting Focus Group Results. Focus Group Kit. 6. Sage
Publications, Thousand Oaks, California.
Krueger, R.A. 1997. Developing Questions for Focus Groups. Focus Group Kit. 3. Sage Publications,
Thousand Oaks, California.
Morgan, D.L. 1997. Planning Focus Groups. Focus Group Kit. 2. Sage Publications, Thousand Oaks,
California.
Morgan, D.L. 1997. The Focus Group Guidebook. Focus Group Kit. 1. Sage Publications, Thousand
Oaks, California.
Oppenheim, A.N. 1992. Questionnaire Design, Interviewing and Attitude Measurement. Pinter
Publishers, London.
Payne, S.L. 1951. The Art of Asking Questions, Princeton University Press, Princeton, New Jersey
Platek, R., F.K. Pierre-Pierre and P. Stevens. 1985. Development and Design of Survey Questionnaires.
Statistics Canada. 12-519E.
Presser, S. and J. Blair. 1994. Survey Pretesting: Do Different Methods Produce Different Results?
Sociological Methodology, 24: 73-104.
Statistics Canada. 1994. Policy on the Development, Testing and Evaluation of Questionnaires. Policy
Manual. 2.8.
Statistics Canada. 1996a. Policy on Informing Survey Respondents. Policy Manual. 1.1.
Statistics Canada. 2001. Screen Display and Functionality Standards for Social Survey Full BLAISE
Applications.
Statistics Canada. 2001. Standard Question Blocks for Social Survey Full BLAISE Applications.
Tourangeau, R., L.J. Rips and K. Rasinski. 2000. The Psychology of Survey Response, Cambridge
University Press, Cambridge, U.K.
98.
E L EC T R O N I C P U B L I C A T I O N S
A V A I L A B L E A T
www.statcan.gc.ca
99.
STATISTICS CANADA
87
Chapter 6- Sample Designs
6.0 Introduction
Chapter 3 - Introduction to Survey Design stated that during the planning phase the statistical agency
must decide whether to conduct a census or sample survey. If the decision is a sample survey, then the
agency needs to plan how to select the sample. Sampling is a means of selecting a subset of units from a
population for the purpose of collecting information for those units to draw inferences about the
population as a whole.
There are two types of sampling: non-probability and probability sampling. The one chosen depends
primarily on whether reliable inferences are to be made about the population. Non-probability sampling,
discussed in section 6.1, uses a subjective method of selecting units from a population. It provides a fast,
easy and inexpensive way of selecting a sample. However, in order to make inferences about the
population from the sample, the data analyst must assume that the sample is representative of the
population. This is often a risky assumption to make in the case of non-probability sampling.
Probability sampling, discussed in section 6.2, involves the selection of units from a population based on
the principle of randomisation or chance. Probability sampling is more complex, time consuming and
usually more costly than non-probability sampling. However, because units from the population are
randomly selected and each unit’s inclusion probability can be calculated, reliable estimates can be
produced along with estimates of the sampling error, and inferences can be made about the population.
There are several different ways in which a probability sample can be selected. The design chosen
depends on a number of factors such as: the available survey frame, how different the population units are
from each other (i.e., their variability) and how costly it is to survey members of the population. For a
given population, a balance of sampling error with cost and timeliness is achieved through the choice of
design and sample size.
The purpose of this chapter is to present different probability sample designs and factors to consider when
determining which one is appropriate for a specific survey. For details on factors affecting sample size,
see Chapter 8 - Sample Size Determination and Allocation.
6.1 Non-Probability Sampling
Non-probability sampling is a method of selecting units from a population using a subjective (i.e., non-
random) method. Since non-probability sampling does not require a complete survey frame, it is a fast,
easy and inexpensive way of obtaining data. The problem with non-probability sampling is that it is
unclear whether or not it is possible to generalise the results from the sample to the population. The
reason for this is that the selection of units from the population for a non-probability sample can result in
large biases.
For example, a common design is for the interviewer to subjectively decide who should be sampled. Since
the interviewer is most likely to select the most accessible or friendly members of the population, a large
portion of the population has no chance of ever being selected, and this portion of the population is likely
to differ in a systematic manner from those selected members. Not only can this bias the results of the
100.
SURVEY METHODS ANDPRACTICES
STATISTICS CANADA
88
survey, it can falsely reduce the apparent variability of the population due to a tendency to select ‘typical’
units and eliminate extreme values. By contrast, probability sampling avoids such bias by randomly
selecting units (see section 6.2).
Due to selection bias and (usually) the absence of a frame, an individual’s inclusion probability cannot be
calculated for non-probability samples, so there is no way of producing reliable estimates or estimates of
their sampling error. In order to make inferences about the population, it is necessary to assume that the
sample is representative of the population. This usually requires assuming that the characteristics of the
population follow some model or are evenly or randomly distributed over the population. This is often
dangerous due to the difficulty of assessing whether or not these assumptions hold.
Non-probability sampling is often used by market researchers as an inexpensive and quick alternative to
probability sampling, but it is not a valid substitute for probability sampling for the reasons delineated
above. So, why bother with non-probability sampling? Non-probability sampling can be applied to
studies that are used as:
- an idea generating tool;
- a preliminary step towards the development of a probability sample survey;
- a follow-up step to help understand the results of a probability sample survey.
For example, non-probability sampling can provide valuable information in the early stages of an
investigation. It can be used for exploratory or diagnostic studies to gain insights into people’s attitudes,
beliefs, motivations and behaviours. Sometimes non-probability sampling is the only viable option – for
example, sampling volunteers may be the only way of obtaining data for medical experiments.
Non-probability sampling is often used to select individuals for focus groups and in-depth interviews. For
example, at Statistics Canada, non-probability sampling is used to test Census of Population questions, to
ensure that the questions asked and concepts used are clear to respondents. In addition, if the content of a
question is deemed to be controversial, subpopulations may be selected and tested. If, through the use of
focus groups, these questions can be made acceptable to these people, they may be acceptable for all
members of the population. (For more on focus groups, see Chapter 5 - Questionnaire Design.)
Another example of the use of non-probability sampling is for preliminary studies. If a new survey is
being designed to cover a field about which very little is known, pilot surveys often use non-probability
designs. For example, consider the relatively new industry of web page designer. Suppose nothing is
known about the number of people working in the industry, how much they earn, or other details of the
profession. A pilot survey could be designed, with questionnaires sent to a few persons known to design
Web pages. Feedback from the questionnaire may provide an idea about their earnings, and may indicate
that many web designers work out of their homes, are only listed under their personal phone numbers and
advertise exclusively on the Internet.
The advantages of non-probability sampling are that:
i. It is quick and convenient.
As a general rule, non-probability samples can be quickly drawn and surveyed: it is very easy to simply
walk outside and ask questions of the first hundred people encountered on the street.
101.
SAMPLE DESIGNS
STATISTICS CANADA
89
ii.It is relatively inexpensive.
It usually only takes a few hours of an interviewer’s time to conduct such a survey. As well, non-
probability samples are generally not spread out geographically, therefore travelling expenses for
interviewers are low.
iii. It does not require a survey frame.
iv. It can be useful for exploratory studies and survey development.
The disadvantages of non-probability sampling are that:
i. In order to make inferences about the population it requires strong assumptions about the
representativeness of the sample. Due to the selection bias present in all non-probability samples,
these are often dangerous assumptions to make. When inferences are to be made, probability
sampling should be performed instead.
ii. It is impossible to determine the probability that a unit in the population is selected for the sample,
so reliable estimates and estimates of sampling error cannot be computed.
The following sections describe five different types of non-probability sampling schemes: haphazard
sampling, volunteer sampling, judgement sampling, quota sampling and modified probability sampling.
Network or snowball sampling, which is less commonly used, is presented in section 6.3.
6.1.1 Haphazard Sampling
Units are selected in an aimless, arbitrary manner with little or no planning involved. Haphazard sampling
assumes that the population is homogeneous: if the population units are all alike, then any unit may be
chosen for the sample. An example of haphazard sampling is the ‘man in the street’ interview where the
interviewer selects any person who happens to walk by. Unfortunately, unless the population is truly
homogeneous, selection is subject to the biases of the interviewer and whoever happened to walk by at
the time of sampling.
6.1.2 Volunteer Sampling
With this method, the respondents are volunteers. Generally, volunteers must be screened so as to get a
set of characteristics suitable for the purposes of the survey (e.g., individuals with a particular disease).
This method can be subject to large selection biases, but is sometimes necessary. For example, for ethical
reasons, volunteers with particular medical conditions may have to be solicited for some medical
experiments.
Another example of volunteer sampling is callers to a radio or television show, when an issue is discussed
and listeners are invited to call in to express their opinions. Only the people who care strongly enough
about the subject one way or another tend to respond. The silent majority does not typically respond,
resulting in a large selection bias. Volunteer sampling is often used to select individuals for focus groups
or in-depth interviews (i.e., for qualitative testing, where no attempt is made to generalise to the whole
population).
102.
SURVEY METHODS ANDPRACTICES
STATISTICS CANADA
90
6.1.3 Judgement Sampling
With this method, sampling is done based on previous ideas of population composition and behaviour. An
expert with knowledge of the population decides which units in the population should be sampled. In
other words, the expert purposely selects what is considered to be a representative sample.
Judgement sampling is subject to the researcher's biases and is perhaps even more biased than haphazard
sampling.
Since any preconceptions the researcher has are reflected in the sample, large biases can be introduced if
these preconceptions are inaccurate. However, it can be useful in exploratory studies, for example in
selecting members for focus groups or in-depth interviews to test specific aspects of a questionnaire.
6.1.4 Quota Sampling
This is one of the most common forms of non-probability sampling. Sampling is done until a specific
number of units (quotas) for various subpopulations has been selected. Quota sampling is a means for
satisfying sample size objectives for the subpopulations.
The quotas may be based on population proportions. For example, if there are 100 men and 100 women in
the population and a sample of 20 are to be drawn, 10 men and 10 women may be interviewed. Quota
sampling can be considered preferable to other forms of non-probability sampling (e.g., judgement
sampling) because it forces the inclusion of members of different subpopulations.
Quota sampling is somewhat similar to stratified sampling in that similar units are grouped together (see
section 6.2.6 for stratified sampling). However, it differs in how the units are selected. In probability
sampling, the units are selected randomly while in quota sampling a non-random method is used – it is
usually left up to the interviewer to decide who is sampled. Contacted units that are unwilling to
participate are simply replaced by units that are, in effect ignoring nonresponse bias.
Market researchers often use quota sampling (particularly for telephone surveys) instead of stratified
sampling to survey individuals with particular socio-economic profiles. This is because compared with
stratified sampling, quota sampling is relatively inexpensive and easy to administer and has the desirable
property of satisfying population proportions. However, it disguises potentially significant selection bias.
As with all other non-probability sample designs, in order to make inferences about the population, it is
necessary to assume that persons selected are similar to those not selected. Such strong assumptions are
rarely valid.
6.1.5 Modified Probability Sampling
Modified probability sampling is a combination of probability and non-probability sampling. The first
stages are usually based on probability sampling (see the following section). The last stage is a non-
probability sample, usually a quota sample. For example, geographical areas may be selected using a
probability design, and then within each region, a quota sample of individuals may be drawn.
103.
SAMPLE DESIGNS
STATISTICS CANADA
91
6.2Probability Sampling
Probability sampling is a method of sampling that allows inferences to be made about the population
based on observations from a sample. In order to be able to make inferences, the sample should not be
subject to selection bias. Probability sampling avoids this bias by randomly selecting units from the
population (using a computer or table of random numbers). It is important to note that random does not
mean arbitrary. In particular, the interviewers do not arbitrarily choose respondents since then sampling
would be subject to their personal biases. Random means that selection is unbiased – it is based on
chance. With probability sampling, it is never left up to the discretion of the interviewer to subjectively
decide who should be sampled.
There are two main criteria for probability sampling: one is that the units be randomly selected, the
second is that all units in the survey population have a non-zero inclusion probability in the sample and
that these probabilities can be calculated. It is not necessary for all units to have the same inclusion
probability, indeed, in most complex surveys, the inclusion probability varies from unit to unit.
There are many different types of probability sample designs. The most basic is simple random sampling
and the designs increase in complexity to encompass systematic sampling, probability-proportional-to-
size sampling, cluster sampling, stratified sampling, multi-stage sampling, multi-phase sampling and
replicated sampling. Each of these sampling techniques is useful in different situations. If the objective of
the survey is simply to provide overall population estimates and stratification would be inappropriate or
impossible, simple random sampling may be the best. If the cost of survey collection is high and the
resources are available, cluster sampling is often used. If subpopulation estimates are also desired (such as
estimates by province, age group, or size of business), stratified sampling is usually performed.
Most of the more complex designs use auxiliary information on the survey frame to improve sampling. If
the frame has been created from a previous census or from administrative data, there may be a wealth of
supplementary information that can be used for sampling. For example, for a farm survey, the statistical
agency may have the size of every farm in hectares from the last agricultural census. For a survey of
people, information (e.g., age, sex, ethnic origin, etc.) may be available for everyone from the last
population census. For a business survey, the statistical agency may have administrative information such
as the industry (e.g., retail, wholesale, manufacturing), the type of business (e.g., food store), the number
of employees, etc. In order for the auxiliary information to improve sampling, there must be a correlation
between the auxiliary data and the survey variables.
The main advantage of probability sampling is that since each unit is randomly selected and each unit’s
inclusion probability can be calculated reliable estimates and an estimate of the sampling error of each
estimate can be produced. Therefore, inferences can be made about the population. In fact, with a
probability design, a relatively small sample can often be used to draw inferences about a large
population.
The main disadvantages of probability sampling are that it is more difficult, takes longer and is usually
more expensive than non-probability sampling. In general, the expense of creating and maintaining a
good quality frame is substantial. And because probability samples tend to be more spread out
geographically across the population than non-probability samples, sample sizes are generally much
larger and data collection is often more costly and difficult to manage. However, for a statistical agency,
the ability to make inferences from a probability sample usually far outweighs these disadvantages.
For the qualities of a good frame, see Chapter 3 - Introduction to Survey Design. For more information
on the uses of administrative data, see Appendix A - Administrative Data.
104.
SURVEY METHODS ANDPRACTICES
STATISTICS CANADA
92
6.2.1 Statistical Efficiency
Simple Random Sampling (SRS) is used as a benchmark for evaluating the efficiency of other sampling
strategies. In order to understand the concept of efficient sampling, some definitions are presented here.
A parameter is a population characteristic that the client or data user is interested in estimating, for
example the population average, proportion or total. An estimator is a formula by which an estimate of
the parameter is calculated from the sample and an estimate is the value of the estimator using the data
from the realised sample. The sampling strategy is the combination of the sample design and estimator
used.
For example, the parameter of interest might be the population average, Y , which is calculated as
follows:
∑∈
=
Ui
i
N
y
Y
where yi is the value of the variable y for the ith
unit, U is the set of units in the population and there are N
units in the population.
For an SRS with 100% response rate, the usual – but not the only – estimator for the population average
is:
∑∈
=
rSi
i
n
y
Yˆ
where Sr is the set of respondents in the sample and there are n units in the sample. The value of
∑∈ rSi
i
n
y
for a particular sample is called the estimate.
Estimates calculated from different samples differ from one another. The sampling distribution of an
estimator is the distribution of all the different values that the estimator can have for all possible
samples from the same design from the population. This distribution thus depends on the sampling
strategy.
Estimators have certain desirable properties. One is that the estimator be unbiased or approximately
unbiased. An estimator is unbiased if the average estimate over all possible samples is equal to the true
value of the parameter. Another desirable property of an estimator is that the sampling distribution be
concentrated as closely as possible about the average (i.e., that the sampling error be small). The sampling
error of an estimator is measured by its sampling variance, which is calculated as the average squared
deviation about its mean calculated across all possible samples generated from the sample design. An
estimator with small sampling variance is said to be precise. Precision increases as the sampling variance
decreases. Note that an estimator can be precise but biased. Accuracy is a measure of both the bias and
precision of the estimator: an accurate estimator has good precision and is nearly unbiased.
105.
SAMPLE DESIGNS
STATISTICS CANADA
93
Onesampling strategy is more efficient than another if the sampling variance of the estimator for the
sampling strategy is smaller than that of another sampling strategy. So as not to confuse this type of
efficiency with other types – for example, cost efficiency – this will be referred to as statistical efficiency.
Statistical efficiency is an important consideration when comparing different possible designs since if one
design can provide improved or equivalent precision using a smaller sample size, this can provide
considerable cost savings. The following sample designs compare their efficiency relative to SRS.
Formally, this is measured by calculating the design effect, presented in section 7.3.3 of Chapter 7 -
Estimation.
For more details on estimation, factors affecting precision and estimating precision, see Chapter 7 -
Estimation.
6.2.2 Simple Random Sampling (SRS)
The starting point for all probability sampling designs is simple random sampling (SRS). SRS is a one-
step selection method that ensures that every possible sample of size n has an equal chance of being
selected. As a consequence, each unit in the sample has the same inclusion probability. This probability,
π , is equal to n/N, where N is the number of units in the population.
Sampling may be done with or without replacement. Sampling with replacement allows for a unit to be
selected more than once. Sampling without replacement means that once a unit has been selected, it
cannot be selected again. Simple random sampling with replacement (SRSWR) and simple random
sampling without replacement (SRSWOR) are practically identical if the sample size is a very small
fraction of the population size. This is because the possibility of the same unit appearing more than once
in the sample is small. Generally, sampling without replacement yields more precise results and is
operationally more convenient. For the purpose of this chapter, sampling is assumed to be without
replacement unless otherwise specified.
Consider a population of five people and suppose that a sample of three is selected (SRSWOR). Label the
people in the population 1, 2, 3, 4 and 5 and denote the population as the set {1, 2, 3, 4, 5}. There are ten
possible samples of three people: {1, 2, 3}, {1, 2, 4}, {1, 2, 5}, {1, 3, 4}, {1, 3, 5}, {1, 4, 5}, {2, 3, 4}, {2,
3, 5}, {2, 4, 5} and {3, 4, 5}. Each of these samples has an equal chance of being selected and each
individual is selected in 6 out of the 10 possible samples, thus each individual has an inclusion probability
of 5/3/ == Nnπ .
To select a simple random sample, the statistical agency usually has constructed a complete frame (either
a list or area frame) before sampling. On a list frame, the units are generally numbered 1 to N, although
the method of assigning a unique number to each unit is not important. Next, n units from the list are
chosen at random using a random number table or a computer-generated random number and the
corresponding units make up the sample.
As a means of illustrating the technique of SRSWOR, consider a survey of students from a school.
Assume that a suitable list of students is available or can be created from existing sources. This list serves
as the survey or sampling frame. Now, suppose that the population list contains N=1530 students of
which a sample of size n=90 is required. The next step is to decide how to select the 90 students.
106.
SURVEY METHODS ANDPRACTICES
STATISTICS CANADA
94
Sample selection can be done using a table of random numbers (see Table 1). The first step involves
selecting a four-digit number (four since this is the number of digits in 1530). Sampling begins by
selecting a number anywhere in the table and then proceeding in any direction. The first 90 four-digit
numbers that do not exceed 1530 are selected.
Suppose row 01 and column 85 - 89 are selected as the starting point. Proceeding down this column, the
random numbers selected are 189, 256, 984, 744, 1441, 617, etc. Selection continues until 90 different
numbers are obtained. The result is a sample that consists of students with the corresponding numbers in
the listing of the population. (Since the method under discussion is SRSWOR, any number that appears
more than once is ignored). Although a random number table was used above to illustrate the manual
selection of a simple random sample, practically speaking, a computer program would randomly select
units.
SRS has a number of advantages over other probability sampling techniques, including:
i. It is the simplest sampling technique.
ii. It requires no additional (auxiliary) information on the frame in order to draw the sample.
The only information that is required is a complete list of the survey population and contact information.
iii. It needs no technical development.
The theory behind SRS is well established, so that standard formulas exist to determine the sample size,
population estimates and variance estimates and these formulas are easy to use.
The disadvantages of SRS are:
i. It makes no use of auxiliary information even if such information exists on the survey frame. This
can result in estimates being less statistically efficient than if another sample design had been
used.
ii. It can be expensive if personal interviews are used, since the sample may be widely spread out
geographically.
iii. It is possible to draw a ‘bad’ SRS sample. Since all samples of size n have an equal chance of
being included in the sample, it is possible to draw a sample that is not well dispersed and that
poorly represents the population.
SURVEY METHODS ANDPRACTICES
STATISTICS CANADA
96
Simple Random Sample (illustrated, n=12)
6.2.3 Systematic Sampling (SYS)
In systematic sampling (SYS), units are selected from the population at regular intervals. Systematic
sampling is sometimes used when the statistical agency would like to use SRS but no list is available, or
when the list is roughly random in order in which case SYS is even simpler to conduct than SRS. A
Sampling interval and a random start are required. When a list frame is used and the population size, N,
is a multiple of the sample size, n, every kth
unit is selected where the interval k is equal to N/n. The
random start, r, is a single random number between 1 and k, inclusively. The units selected are then: r,
r+k, r+2k, ..., r+(n-1)k. Like SRS, each unit has an inclusion probability, π , equal to n/N but, unlike
SRS, not every combination of n units has an equal chance of being selected: SYS can only select
samples in which the units are separated by k. Thus, under this method, only k possible samples can be
drawn from the population.
To illustrate SYS, suppose a population contains N=54 units and a sample of size n=9 units is to be
drawn. The sampling interval would be k=N/n=54/9=6. Next, a random number between 1 and k=6, say 2,
is chosen. The population units selected for the sample are then numbered: 2, 8, 14, 20, 26, 32, 38, 44 and
50. With a sampling interval of 6 and a population of size 54, there are only 6 possible SYS samples,
while for a simple random sample of size 6, there are over 25 million possible samples.
One advantage of systematic sampling is that it can be used when no list of the population units is
available in advance. In this case, a conceptual frame can be constructed by sampling every kth
person
until the end of the population is reached.
One problem with SYS is that the sample size, n, is not known until after the sample has been selected.
Another problem arises when the sampling interval, k, matches some periodicity in the population. For
example, suppose that a survey of traffic flow is to be conducted in an area and only one day of the week
can be sampled, in other words k is every 7th
day. The survey’s estimated traffic flow will be dramatically
different if the sampled days are all Sundays as opposed to all Tuesdays. Of course, if the sampling period
is every 5th
day, then every day of the week could be surveyed. Unfortunately, in most cases, periodicity
is not known in advance.
109.
SAMPLE DESIGNS
STATISTICS CANADA
97
IfN cannot be evenly divided by n, the sampling interval for SYS is not a whole number. In this case, k
could be set equal to the nearest whole number, but then the sample size would vary from sample to
sample. For example, suppose that N=55 and n=9, then k=55/9=6.1. If k is assumed to be 6, and if r=2,
the sample contains those units numbered: 2, 8, 14, 20, 26, 32, 38, 44 and 50. If the random start is r=1
and every sixth unit is selected, then the sample consists of units: 1, 7, 13, 19, 25, 31, 37, 43, 49 and 55.
In this case, the sample is of size 10, not 9. Another approach is to set each of the values r, r+k, r+2k, …,
r+(n-1)k to the nearest whole number. With this approach, the realised sample size is fixed. For example,
suppose again that N=55 and n=9, so that k=55/9=6.1. If r=1, the sample consists of units 1, 7, 13, 19, 25,
31, 38, 44 and 50.
Alternatively, if N cannot be evenly divided by n then, to avoid a variable sample size, circular systematic
sampling could be performed. With this method, the population units are thought to exist on a circle and
modular counting is used. The value of k is set equal to the whole number nearest to N/n, but now the
random start, r, can be between 1 and N, rather than 1 and k (i.e., the first unit can be anywhere on the
list). The selected units, as before, are: r, r+k, r+2k, ..., r+(n-1)k. If the jth
unit is such that r+(j-1)k > N,
then the selected unit is r+(j-1)k - N. That is, when the end of the list is reached, sampling continues at the
beginning of the list. The advantage of the circular method is that each unit has an equal chance of being
in the sample. For example, using the previous example, suppose that N=55 and n=9 and k=6. A random
start, r, between 1 and 55 is selected, say r=42. Then the selected population units are: 42, 48, 54, 5, 11,
17, 23, 29 and 35.
SYS has a number of advantages depending on the circumstances and objective of the survey:
i. It is a proxy for SRS when there is no frame.
ii. It does not require auxiliary frame information, like SRS.
iii. It can result in a sample that is better dispersed than SRS (depending on the sampling interval and
how the list is sorted).
iv. It has a well-established theory, just like SRS, and so estimates can be easily calculated.
v. It is simpler than SRS since only one random number is required.
The disadvantages of SYS are:
i. It can result in a ‘bad’ sample if the sampling interval matches some periodicity in the population.
ii. Like SRS, it does not use any auxiliary information that might be available on the frame, and thus
it can result in an inefficient sampling strategy.
iii. The final sample size is not known in advance when a conceptual frame is used.
iv. It does not have an unbiased estimator of the sampling variance. In order to do variance
estimation, the systematic sample is often treated as if it were a simple random sample. This is
only appropriate when the list is sorted randomly. (For more information on variance estimation
for a systematic sample, see Cochran (1977) or Lohr (1999).)
v. It can lead to a variable sample size if the population size, N, cannot be evenly divided by the
desired sample size, n (but this can be avoided using circular SYS).
110.
SURVEY METHODS ANDPRACTICES
STATISTICS CANADA
98
Systematic Sample (illustrated, n=12, N=36, k=3)
SRS and circular SYS are both equal probability sample designs, since every possible sample has exactly
the same chance of being selected. Not all sampling techniques result in equal probabilities. The sample
designs described in the following sections can result in unequal probabilities. It is important to remember
that in probability sampling, the criterion is not that all units have the same inclusion probability but that
all units have a known non-zero inclusion probability. Often, sampling with unequal probabilities can
improve the statistical efficiency of the sampling strategy.
6.2.4 Probability-Proportional-to-Size (PPS) Sampling
Probability-proportional-to-size (PPS) sampling is one technique that uses auxiliary data and yields
unequal probabilities of inclusion. If population units vary in size and these sizes are known, such
information can be used during sampling to increase the statistical efficiency.
PPS can yield dramatic increases in precision if the size measures are accurate and the variables of
interest are correlated with the size of the unit. For less accurate size measures, it is better to create size
groupings and perform stratified sampling (Section 6.2.6).
A good example of a PPS size variable is area. Farm surveys often use PPS, where the size measure is the
size of the farm in hectares. Admittedly, the size of a farm can grow (or shrink) if the farmer buys or sells
land, but for the most part, farm size is constant from year to year. In addition, typical questions for farm
surveys, such as income, crop production, livestock holdings and expenses are often correlated with land
holdings. Other size measures for business surveys include the number of employees, annual sales and the
number of locations, although these variables are more likely to change from year to year.
In PPS sampling, the size of the unit determines the inclusion probability. Using farms as an example, this
means that a farm with an area of 200 hectares has twice the probability of being selected as a farm with
100 hectares.
111.
SAMPLE DESIGNS
STATISTICS CANADA
99
Toillustrate, assume that there is a population of six farms and that the client is interested in estimating
the total expenses of this farming population by sampling one farm. (A sample of size one is used for the
purpose of illustration; in practice, a statistical agency rarely selects only one unit.). Suppose that there is
a stable size measure for each farm (the size of the farm in hectares) and, to illustrate the efficiency gains
over SRS, assume that each farm’s expenses are known. (Obviously, in real life, if the expenses were
known, there would be no need to conduct the survey.)
Consider the following list of farms:
Table 2: Population Values
Sampling Unit:
Farm
Auxiliary Frame Information:
Size of Farm in Hectares
Survey Variable of Interest:
Expenses ($)
1 50 26,000
2 1,000 470,000
3 125 63,800
4 300 145,000
5 500 230,000
6 25 12,500
Total 2,000 947,300
For this population of six farms, the true total expenses are $947,300. A simple random sample could be
selected, where each sample contains one unit and each unit has an inclusion probability of 1/6. Six
different SRS samples of size n=1 are possible. Consider the results from SRS (see table 3). To do so,
some estimation concepts (explained in detail in Chapter 7 - Estimation) must be introduced. For a
sample of size one, the total expenses for the population is estimated by multiplying the sampled unit’s
expenses by the unit’s weight. This weight is the average number of units in the survey population that
the sampled unit represents and is the inverse of the inclusion probability.
For the PPS sample, the sampling variability is much lower. The estimates from the six possible samples
now only range from a low of $920,000 to a high of $1.04 million – much better than SRS (see table 4).
(The PPS inclusion probability is calculated as the size of the farm divided by the total size of all farms).
In this example, it was assumed that there is a relationship between expenses and the size of the farm, an
assumption that obviously is valid here, or PPS would not have been as successful as it was. Indeed, if the
variables of interest and the size variable were not correlated, PPS might not have been any better than
SRS, and could have been worse.
The main advantage of PPS sampling is that it can improve the statistical efficiency of the sampling
strategy by using auxiliary information. This can result in a dramatic reduction in the sampling variance
compared with SRS or even stratified sampling (Section 6.2.6).
112.
SURVEY METHODS ANDPRACTICES
STATISTICS CANADA
100
Table 3: Possible SRS Samples of Size n=1
Sample
(Farm Selected)
Inclusion
Probability
(π )
Design Weight
( π/1 )
Expenses ($) Population Estimate of
Total Expenses ($)
Sample 1 (Farm 1) 1/6 6 26,000 156,000
Sample 2 (Farm 2) 1/6 6 470,000 2,820,000
Sample 3 (Farm 3) 1/6 6 63,800 382,800
Sample 4 (Farm 4) 1/6 6 145,000 870,000
Sample 5 (Farm 5) 1/6 6 230,000 1,380,000
Sample 6 (Farm 6) 1/6 6 12,500 75,000
Average Sample Estimate 947,300
Notice the large sampling variability in the SRS estimates, ranging from $75,000 to $2.8 million. PPS can
give estimates with much smaller sampling variability.
Table 4: Possible PPS Samples of Size n=1
Sample
(Farm Selected)
Size of
Farm
Inclusion
Probability
(π )
Design
Weight
( π/1 )
Expenses ($) Population Estimate
of Total Expenses ($)
Sample 1 (Farm 1) 50 50/2,000 2,000/50 26,000 1,040,000
Sample 2 (Farm 2) 1,000 1,000/2,000 2,000/1000 470,000 940,000
Sample 3 (Farm 3) 125 125/2,000 2,000/125 63,800 1,020,800
Sample 4 (Farm 4) 300 300/2,000 2,000/300 145,000 966,667
Sample 5 (Farm 5) 500 500/2,000 2,000/500 230,000 920,000
Sample 6 (Farm 6) 25 25/2,000 2,000/25 12,500 1,000,000
Average Sample Estimate 947,300
The disadvantages of PPS sampling are:
i. It requires a survey frame that contains good quality, up-to-date auxiliary information for all units
on the frame that can be used as size measures.
ii. It is inappropriate if the size measures are not accurate or stable. In such circumstances, it is better
to create size groupings and perform stratified sampling.
iii. It is not always applicable, since not every population has a stable size measure that is correlated
with the main survey variables.
iv. It can result in a sampling strategy that is less statistically efficient than SRS for survey variables
that are not correlated with the size variables.
v. Estimation of the sampling variance of an estimate is more complex.
vi. Frame creation is more costly and complex than SRS or SYS, since the size of each unit in the
population needs to be measured and stored.
113.
SAMPLE DESIGNS
STATISTICS CANADA
101
6.2.4.1Methods of PPS Sampling
How is a PPS sample drawn? There are many PPS sampling schemes, however, three commonly used
techniques are the random method, the systematic method and the randomised systematic method. (The
following assumes that the size measures are integer values.)
i. The random method for PPS sampling
- for each unit in the population, cumulate the size measures for units up to and including itself;
- determine the range corresponding to each unit in the population, that is, from (but not including)
the cumulative sum for the previous unit to the cumulative sum for the current unit;
- select a random number between 0 (if dealing with non-integer size measures) or 1 (for integer
size measures) and the total cumulative size and select the unit whose range contains the random
number;
- repeat previous step until n units have been selected.
To illustrate using the farm example:
Table 5: PPS Sampling using the Random Method
Farm Size Cumulative Size Range
1 50 50 1-50
2 1000 1050 51-1050
3 125 1175 1051-1175
4 300 1475 1176-1475
5 500 1975 1476-1975
6 25 2000 1976-2000
For a sample containing three units, three random numbers between 1 and 2000 are selected. Suppose
these numbers are: 1697, 624 and 1109. Then the farms selected are: farm 5, farm 2 and farm 3.
In the case of the random method for PPS sampling without replacement, if more than one unit is
selected, complications arise both in attempting to keep probabilities directly proportional to size and in
estimating the sampling variances of survey estimates. This becomes even more complicated when more
than two or three units are selected with PPS without replacement, and in fact, is the subject of
considerable research. Much of this research is contained in the writings of Horvitz and Thompson
(1952), Yates and Grundy (1953), Rao, Hartley and Cochran (1962), Fellegi (1963), and Brewer and
Hanif (1983).
ii. The systematic method
- for each unit in the population, cumulate the size measures for units up to and including itself;
- determine the range corresponding to each unit in the population, that is, from (but not including)
the cumulative sum for the previous unit to the cumulative sum for the current unit;
- determine the sampling interval, k=(total cumulative size)/n;
114.
SURVEY METHODS ANDPRACTICES
STATISTICS CANADA
102
- determine a random start, r, between 0 (if dealing with non-integer size measures) or 1 (for
integer size measures) and k;
- select those units whose range contains the random numbers r, r+k, r+2k, ... r+(n-1)k.
iii. The randomised systematic method
In this scheme, the list is randomised prior to the application of systematic sampling. Just as with
systematic sampling, if the list is used in its original order, some possible samples may be eliminated. By
randomising the list, the number of potential samples that can be drawn is increased.
Note that these methods do pose certain problems. For example, for the systematic and randomised
systematic methods, if the size of any unit is greater than the interval, it may be selected more than once.
This problem can only be overcome by placing such large units into separate strata and sampling them
independently (Section 6.2.6). A second problem is the difficulty of estimating sampling variances.
6.2.5 Cluster Sampling
Cluster sampling is the process of randomly selecting complete groups (clusters) of population units from
the survey frame. It is usually a less statistically efficient sampling strategy than SRS and is performed for
several reasons. The first reason is that sampling clusters can greatly reduce the cost of collection,
particularly if the population is spread out and personal interviews are conducted. The second reason is
that it is not always practical to sample individual units from the population. Sometimes, sampling groups
of the population units is much easier (e.g., entire households). Finally, it allows the production of
estimates for the clusters themselves (e.g., average revenue per household).
Cluster sampling is a two-step process. First, the population is grouped into clusters (this may consist of
natural clustering, e.g., households, schools). The second step is to select a sample of clusters and
interview all units within the selected clusters.
The survey frame may dictate the method of sampling. Until now, the focus has been on sampling
individual units of the population from a list frame. If the units of the population are naturally grouped
together, it is often easier to create a frame of these groups and sample them than try to create a list frame
of all individual units in the population. For example, the client may be interested in sampling teachers
but only have available a list of schools. In the case of household or farm surveys, many countries do not
have complete and up-to-date lists of the people, households or farms for any large geographic area, but
they do have maps of the areas. In this case an area frame could be created, with the geographical areas
divided into regions (clusters), the regions sampled and everyone within the region interviewed. Different
sample designs can be used to select the clusters, such as SRS, SYS or PPS. A common design uses PPS
where sampling is proportional to the size of the cluster.
There are a number of considerations to bear in mind for cluster sampling. In order for estimates to be
statistically efficient, the units within a cluster should be as different as possible. Otherwise, if the units
within a cluster are similar, they all provide similar information and interviewing one unit would be
sufficient.
Unfortunately, units within a cluster frequently have similar characteristics and therefore are more
homogeneous than units randomly selected from the general population. This results in a sampling
procedure that is less efficient than SRS. For example, suppose that for a city of 100,000, two samples are
115.
SAMPLE DESIGNS
STATISTICS CANADA
103
drawn.For the first sample, cluster sampling is used and one city block, containing 400 residents, is
selected at random. For the second sample, SRS is used to select 400 people from the list of 100,000
residents. The 400 residents in the SRS sample are likely to be far more diverse in terms of income, age,
occupation, and educational background (to name only a few variables) than the 400 people in the cluster
sample who all live on the same city block.
The statistical efficiency of cluster sampling depends on how homogeneous the units within the clusters
are, how many population units are in each cluster and the number of clusters sampled. When
neighbouring units are similar, it is more statistically efficient to select many small clusters rather than a
few, larger clusters. However, when personal interviews are conducted, the more dispersed the sample is,
the more expensive the survey. The statistical agency must strike a balance between the optimal number
and size of clusters, and the cost.
There can be logistical difficulties with cluster sampling. If the survey frame is an area frame based on a
map and the sampling unit is a cluster of dwellings, it can be difficult to determine if a dwelling is in a
cluster or not. Some basic rules should be created to determine which units are in a cluster. For example,
having a rule saying dwellings belong to the cluster in which their main entrance (front door) lies would
eliminate most problems (usually, the entire dwelling is either in or out of the boundary of the cluster). If
a dwelling seems to be evenly divided between clusters, toss a coin to avoid bias. In the Canadian Labour
Force Survey, clusters are determined by drawing a line down the middle of the street. This makes it easy
to determine whether a dwelling is in the sample or not. (For more information on these practical
considerations, see Chapter 9 - Data Collection Operations).
The advantages of cluster sampling are:
i. It can greatly reduce the cost of collection by having a less dispersed sample than SRS. This is
particularly important when the population is spread out and personal interviews are conducted,
since savings can be achieved by reducing the travel time of interviewers, especially for rural
populations.
ii. It is easier to apply than SRS or SYS to populations that are naturally clustered (e.g., households,
schools) and for certain conceptual populations, such as people crossing a border during a
specific time interval. For such populations, it may be difficult, expensive or impossible to
construct a list of all individual units of the population, required by SRS.
iii. It allows the production of estimates for the clusters themselves. For example, estimates of the
average number of teachers per school (where schools are clusters).
iv. It can be more statistically efficient than SRS if the units within the clusters are heterogeneous
(different) with respect to the study variables and the clusters are homogeneous (similar). But in
practice this is usually not the case.
The disadvantages of cluster sampling are:
i. It can be less statistically efficient than SRS if the units within the clusters are homogeneous with
respect to the study variables. This is frequently the case, since units within a cluster tend to have
similar characteristics. However, to offset this loss in statistical efficiency, the number of clusters
selected can be increased.
116.
SURVEY METHODS ANDPRACTICES
STATISTICS CANADA
104
ii. Its final sample size is not usually known in advance, since it is not usually known how many
units are within a cluster until after the survey has been conducted.
iii. Its survey organisation can be more complex than for other methods.
iv. Its variance estimation will be more complex than for SRS if clusters are sampled without
replacement.
Cluster Sample (illustrated, 4 clusters are sampled)
6.2.6 Stratified Sampling (STR)
With stratified sampling, the population is divided into homogeneous, mutually exclusive groups called
strata, and then independent samples are selected from each stratum. Any of the sample designs
mentioned in this chapter can be used to sample within strata, from the simpler methods such as SRS or
SYS to the more complex methods such as PPS, cluster, multi-stage or multi-phase sampling (discussed
later in this chapter). For example, with cluster sampling, it is very common to first stratify, then draw the
cluster sample. This is called stratified cluster sampling.
A population can be stratified by any variables that are available for all units on the frame prior to the
survey being conducted. For instance, this information may simply be the address of the unit, allowing
stratification by province, or there may be income data on the frame, allowing stratification by income
group. Commonly used stratification variables include: age, sex, geography (e.g., province), income,
revenues, household size, size of business, type of business, number of employees, etc.
There are three main reasons for stratification. The first is to make the sampling strategy more efficient
than SRS or SYS. The second is to ensure adequate sample sizes for specific domains of interest for
which analysis is to be performed. The third is to protect against drawing a ‘bad’ sample.
117.
SAMPLE DESIGNS
STATISTICS CANADA
105
First,for a given sample size and estimator, stratification may lead to lower sampling error or, conversely,
for a given sampling error, to a smaller sample size. Note that, while both cluster sampling and
stratification group units in the population, with stratified sampling, samples are drawn within each
stratum, while for cluster sampling, samples of clusters are drawn and everyone in the cluster surveyed.
And while stratification generally increases the precision of estimation with respect to SRS, clustering
generally decreases it (since neighbouring units are usually similar).
In order to improve the statistical efficiency of a sampling strategy with respect to SRS, there must be
strong homogeneity within a stratum (i.e., units within a stratum should be similar with respect to the
variable of interest) and the strata themselves must be as different as possible (with respect to the same
variable of interest). Generally, this is achieved if the stratification variables are correlated with the
survey variable of interest. The reason why stratification can increase the precision of the estimates
relative to SRS is explained by Cochran (1977):
If each stratum is homogeneous, in that the measurements vary little from one unit to another, a
precise estimate of any stratum mean can be obtained from a small sample in that stratum. These
estimates can be combined in a precise estimate for the whole population.
Stratification is particularly important in the case of skewed populations (i.e., when the distribution of
values of a variable is not symmetric, but leans to the right or the left). For example, business and farm
surveys often have highly skewed populations – the few large business establishments and farms often
have large values for variables of interest (e.g., revenues, expenditures, number of employees). In such
cases, a few population units can exert a large influence on estimates – if they happen to be selected in the
sample, they can greatly increase the estimate, and if they are not selected, the estimate will be much
lower. In other words, these units can increase the sampling variability of the estimate. Therefore, such
units should be placed in a stratum by themselves to ensure that they do not represent other, potentially
much smaller, units in the population.
To stratify businesses, a size variable based on the number of employees, for example, is often used. If the
size variable has three values – small, medium and large – the statistical efficiency is improved if the
large businesses have similar sales, the medium businesses have similar sales, and the small businesses
have similar sales and if large and medium businesses and the medium and small business have quite
different sales. Similarly, for a sample design using area frames, the proper representation of large cities
can be ensured by placing them in a separate stratum, and sampling each stratum separately.
In the previous example, it was reasonable to stratify by the number of employees, since this is a measure
of the size of the company and is likely to be highly related to sales. However, if a survey is interested in
the age of its employees, it makes no sense to stratify by the number of employees since there is no
correlation. Also, stratification that is statistically efficient for one survey variable may not work well for
others. Usually the stratification variables are chosen based on their correlation with the most important
survey variables. This means that for those, less important, survey variables that are uncorrelated to the
stratification variables, estimates for a stratified sample can be less efficient than SRS.
The second reason for stratification is to ensure adequate sample sizes for known domains of interest.
When designing a survey, often the overall goal is to estimate a total. How many people were
unemployed last month? What were the total retail sales last month?
118.
SURVEY METHODS ANDPRACTICES
STATISTICS CANADA
106
In addition to overall totals, the client often requires estimates for subgroups of the population, called
domains. For example, the client may wish to know how many men were unemployed and compare this
with the number of women who were unemployed. Similarly, the client may want to know the sales last
month for clothing stores, or for all retail stores in a certain province. Creating estimates for subgroups is
called domain estimation. If domain estimates are required, the ability to calculate them with a large
enough sample in each domain should be incorporated into the sample design. If the information is
available on the frame, the easiest way to do this is to ensure that strata exactly correspond to the domains
of interest.
The third reason for stratifying is to protect against drawing a ‘bad’ sample. In the case of SRS, the
selection of the sample is left entirely to chance. Stratified sampling attempts to restrict the possible
samples to those that are less extreme by ensuring that at least certain parts of the population are
represented in the sample. For example, to ensure that both men and women are included in the sample,
the survey frame should be stratified by sex (assuming this auxiliary variable is available on the frame).
In addition to these reasons, stratification is often used for operational or administrative convenience. It
can enable the statistical agency to control the distribution of fieldwork among its regional offices. For
example, if data collection is conducted by province, then stratification by province is appropriate, in
which case the provincial regional office can be given their portion of the sample.
Once the population has been divided into strata, the statistical agency needs to determine how many
units should be sampled from each stratum. This step is referred to as allocation of the sample and is
covered in Chapter 8 - Sample Size Determination and Allocation.
Inclusion probabilities usually vary from stratum to stratum; it depends on how the sample is allocated to
each stratum. To calculate the inclusion probabilities for most sample designs, the size of the sample and
the size of the population in each stratum must be considered. To illustrate, consider a population with
N=1000 units stratified into two groups: one stratum has N1=250 units and the other has N2=750 units.
Suppose that SRS is used to select n1=50 units from the first stratum and n2=50 units from the second the
probability, π 2, that a unit in the second stratum is selected is 15/1750/502 ==π . Units thus have
different probabilities of inclusion – a unit in the first stratum is more likely to be selected than one in the
second.
The advantages of stratified sampling are:
i. It can increase the precision of overall population estimates, resulting in a more efficient sampling
strategy. A smaller sample can save a considerable amount on the survey, particularly data
collection.
ii. It can guarantee that important subgroups, when defined as strata, are well represented in the
sample, resulting in statistically efficient domain estimators.
iii. It can be operationally or administratively convenient.
iv. It can protect against selecting a ‘bad’ sample.
v. It allows different sampling frames and procedures to be applied to different strata (e.g., SRS in
one stratum, PPS in another).
119.
SAMPLE DESIGNS
STATISTICS CANADA
107
Thedisadvantages of stratified sampling are:
i. It requires that the sampling frame contain high quality auxiliary information for all units on the
frame, not just those in the sample, that can be used for stratification.
ii. Frame creation is more costly and complex than for SRS or SYS, since the frame requires good
auxiliary information.
iii. It can result in a sampling strategy that is less statistically efficient than SRS for survey variables
that are not correlated to the stratification variables.
iv. Estimation is slightly more complex than for SRS or SYS.
Stratified Sample (illustrated, 4 strata, 3 units selected per stratum)
6.2.7 Multi-Stage Sampling
Thus far, the discussion has centred around one stage sample designs. Multi-stage sampling is the process
of selecting a sample in two or more successive stages. The units selected at the first stage are called
primary sampling units (PSU’s), units selected at the second stage are called second stage units (SSU’s),
etc. The units at each stage are different in structure and are hierarchical (for example, people live in
dwellings, dwellings make up a city block, city blocks make up a city, etc.). In two-stage sampling, the
SSU’s are often the individual units of the population.
A common multi-stage sample design involves two-stage cluster sampling using an area frame at the first
stage to select regions (the PSU’s) and then a systematic sample of dwellings (the SSU’s) within a region
at the second stage. With the one-stage cluster sampling presented earlier, every unit within a sampled
cluster is included in the sample. In two-stage sampling, only some of the units within each selected PSU
are subsampled.
120.
SURVEY METHODS ANDPRACTICES
STATISTICS CANADA
108
Multi-stage sampling is commonly used with area frames to overcome the inefficiencies of one-stage
cluster sampling, which in fact is rarely used. If the neighbouring units within a cluster are similar, then it
is more statistically efficient to sample a few SSU’s from many PSU’s than to sample many SSU’s from
fewer PSU’s.
Multi-stage samples can have any number of stages, but since the complexity of the design (and
estimation) increases with the number of stages, designs are often restricted to two or three stages. It
should be noted that the frame for the first stage is generally quite stable. For example, an area frame
covering large geographical areas does not change rapidly over time. Second (and subsequent) stage
frames required to sample units at subsequent stages are usually less stable. Often, these frames are list
frames created in the field during collection. For example, for the geographic areas sampled at stage one,
a list frame could be created for all those dwellings within the sampled areas. Note that, listing only
sampled areas requires much less effort than trying to list the whole population. (See Chapter 9 - Data
Collection Operations for details on listing).
Each stage of a multi-stage sample can be conducted using any sampling technique. Consequently, one of
the chief advantages of a multi-stage sample is its flexibility. For example, within one PSU drawn at the
first stage, an SRS sample may be drawn. For another PSU, there may be a measure of size that is
correlated with the key survey variables, so PPS may be used within this PSU.
The Canadian Labour Force Survey (LFS) sample is an example of a multi-stage stratified sample. The
country is divided into over 1,100 strata. Each stratum consists of a group of enumeration areas (EA’s).
EA’s are geographic areas defined by the Census of Population so that the area that they cover can be
canvassed by one census representative (they are created by keeping in mind the size of territory and the
density of the population). The first stage of sampling is a stratified sample of clusters (EA’s or groups of
EA’s) from within these strata. At the second stage, the clusters are mapped, all dwellings in them are
listed, and the census representative selects a systematic sample of dwellings from each list. All persons
within a selected dwelling are then interviewed for the survey.
Finally, note that although the examples provided thus far use an area frame at the first stage this is by no
means a requirement for multi-stage sampling. An example of a multi-stage sample using a different kind
of frame is a travel survey conducted at an airport. The primary sampling unit could be time – days in a
month, while the second stage unit could be actual travellers. For a more complex travel survey, the
second stage unit could be arriving passenger planes, while the third stage unit could be actual seats on
the plane.
The advantages of multi-stage sampling are:
i. It can result in a more statistically efficient sampling strategy than a one-stage cluster design
when clusters are homogeneous with respect to the variables of interest (i.e., a sample size
reduction).
ii. It can greatly reduce the travel time and cost of personal interviews as a result of the sample being
less dispersed than for other forms of sampling, such as SRS.
iii. It is not necessary to have a list frame for the entire population. All that is needed is a good frame
at each stage of sample selection.
121.
SAMPLE DESIGNS
STATISTICS CANADA
109
Thedisadvantages of multi-stage sampling are:
i. It is usually not as statistically efficient as SRS (although it can be more efficient than a one-stage
cluster strategy).
ii. The final sample size is not always known in advance, since it is not usually known how many
units are within a cluster until after the survey has been conducted. (The sample size can be
controlled, however, if a fixed number of units are selected per cluster.)
iii. Its survey organisation is more complex than for one-stage cluster sampling.
iv. Its formulas for calculating estimates and sampling variance can be complex.
Multi-Stage Sample (illustrated, 2 stage cluster design, 6 PSU’s selected with 1 to 3 SSU’s selected
within each PSU)
6.2.8 Multi-Phase Sampling
Despite the similarities in name, multi-phase sampling is quite different from multi-stage sampling.
Although multi-phase sampling also involves taking two or more samples, all samples are drawn from the
same frame and the units have the same structure at each phase. A multi-phase sample collects basic
information from a large sample of units and then, for a subsample of these units, collects more detailed
information. The most common form of multi-phase sampling is two-phase sampling (or double
sampling), but three or more phases are also possible. However, as with multi-stage sampling, the more
phases, the more complex the sample design and estimation.
Multi-phase sampling is useful when the frame lacks auxiliary information that could be used to stratify
the population or to screen out part of the population. For example, suppose information is needed about
cattle farmers, but the survey frame only lists farms, with no auxiliary information. A simple survey could
be conducted whose only question is: ‘Is part or all of your farm devoted to cattle farming?’ With only
one question, this survey should have a low cost per interview (especially if done by telephone) and
consequently the agency should be able to draw a large sample.
122.
SURVEY METHODS ANDPRACTICES
STATISTICS CANADA
110
Once the first sample has been drawn, a second, smaller sample can be drawn from amongst the cattle
farmers and more detailed questions asked of these farmers. Using this method, the statistical agency
avoids the expense of surveying units that are not in scope (i.e., who are not cattle farmers).
Multi-phase sampling can also be used to collect more detailed information from a subsample when there
is insufficient budget to collect information from the whole sample, or when doing so would create
excessive response burden. The Canadian Quarterly Retail Commodity Survey (QRCS) is one example.
The first phase of the survey is the Monthly Wholesale Retail Trade Survey (MWRTS). Each month,
MWRTS asks wholesale and retail establishments for two variables – their monthly sales and inventories.
QRCS subsamples the retail establishments and asks them to report their sales by retail commodity, for
example, clothing, electronics, foodstuffs, etc.
Similarly, multi-phase sampling can be used when there are very different costs of collection for different
questions on a survey. Consider a health survey that asks some basic questions about diet, smoking,
exercise and alcohol consumption. In addition, suppose the survey requires that respondents be subject to
some direct measurements, such as running on a treadmill and having their blood pressure and cholesterol
levels measured. It is relatively inexpensive to ask a few questions, but the medical tests require the time
of a trained health practitioner and the use of an equipped laboratory, so are relatively expensive. This
survey could be done as a two-phase sample, with the basic questions being asked at the first phase and
only the smaller, second phase sample receiving the direct measurements.
In addition to stratification or screening information, data collected at the first phase can be used to
improve the efficiency of estimation (e.g., for regression estimation). For more on estimation, see
Chapter 7 - Estimation.
The advantages of multi-phase sampling are:
i. It can greatly increase the precision of estimates (compared with SRS).
ii. It can be used to obtain auxiliary information that is not on the sampling frame (in particular,
stratification information for second phase sampling).
iii. It can be used when the cost of collection for some of the survey variables is particularly
expensive or burdensome for the respondent.
The disadvantages of multi-phase sampling are:
i. It takes longer to get results than from a one-phase survey, if results from the first phase are
required to conduct the second phase.
ii. It can be more expensive than a one-phase survey since it requires interviewing a sampled unit
more than once.
iii. If the population is mobile or if the characteristics of interest change frequently, time delays
between phases may pose problems.
iv. Its survey organisation can be complex.
v. Its formulas for the calculation of estimates and sampling variance can be quite complex.
123.
SAMPLE DESIGNS
STATISTICS CANADA
111
Multi-phasesample (illustrated, 12 units selected at the first phase, 4 at the second)
6.2.9 Replicated Sampling
Replicated sampling involves the selection of a number of independent samples from a population rather
than a single sample. Instead of one overall sample, a number of smaller samples, of roughly equal size,
called replicates, are independently selected, each based upon the same sample design. Replicated
sampling might be used in situations where preliminary results are needed quickly. Such preliminary
results might be based upon the processing and analysis of a single replicate.
The main reason for replicated sampling is to facilitate the calculation of the sampling variance of survey
estimates (sampling variance is a measure of sampling error). While it is generally possible to calculate
the sampling variance based on probability samples, such calculations can be exceedingly difficult
depending on the complexity of the sample design. The problem is that some mathematical expressions
for sampling variance are difficult to derive and tedious and costly to program. In particular, in the case of
systematic sampling, variance estimates cannot be calculated directly unless assumptions are made about
the arrangement of units in the list.
Measures of sampling error are determined by examining the extent to which sample estimates, based
upon all possible samples of the same size and design, differ from one another. Replicated sampling
simulates this concept. Instead of drawing all possible samples (which is not practical), a reasonable
number of smaller samples are selected using identical methods. For example, instead of selecting one
sample of size 10,000, ten independent samples of size 1,000 could be drawn. The estimates from each of
these ten samples can be compared and estimates of sampling variance derived. The reliability of the
sampling variance estimates increases with the number of replicates selected. (See section 7.3.4 of
Chapter 7 - Estimation, for an example of replicated sampling for variance estimation.)
There are a number of other procedures that use replication to estimate the sampling variance for complex
sample designs. These include balanced repeated replication, jackknife and bootstrap. These techniques,
which all extend the basic idea of replicated sampling, differ from one another in terms of the accuracy
with which they measure the sampling variance of different types of survey estimates and their
operational complexity and the situations to which they best apply.
There are drawbacks to this approach. One disadvantage of this scheme is that estimates of sampling
variance, in general, tend to be less precise than if they were based directly on the statistical expressions
that incorporate sample design features such as multi-stage, stratification, etc.
124.
SURVEY METHODS ANDPRACTICES
STATISTICS CANADA
112
Replicated Sampling (illustrated, 2 samples drawn of size 6)
6.3 Special Topics in Sample Design
Sometimes, sample designs are modified to meet the special needs of a particular survey. This may be
necessary because the target population is particularly difficult to locate, because the characteristic of
interest is very rare in the population, because of the analytical needs of the survey or because of the
method of data collection. Chapter 4 - Data Collection Methods presented telephone sampling designs,
including Random Digit Dialling (RDD). The following sections describe other special applications of
sample designs to fit particular survey needs.
6.3.1 Repeated Surveys
Surveys that are conducted once differ in several ways from repeated surveys. The aim of a repeated
survey is often to study trends or changes in the characteristics of interest over a period of time.
Decisions made in the sample design of repeated surveys should take into account the possibility of
deterioration in the statistical efficiency of the sampling strategy over time. A statistical agency may elect,
for example, to use stratification variables that are more stable, avoiding those that may be more
statistically efficient in the short run, but which change rapidly over time.
Another feature of a repeated survey is that, in general, a great deal of information is available which is
useful for future design purposes. The adequacy of various features of the sample design such as the
appropriateness of stratification variables and boundaries, the method of sample allocation and the size of
units at various stages of a multi-stage design may be studied over time with a view to increasing
statistical efficiency. Often, information required to efficiently design a one-time survey is very limited.
In the design of a repeated survey, provisions must be made to accommodate such events as births, deaths
and changes in size measure. The sampling and estimation methods used in repeated surveys should
incorporate these changes in a statistically efficient way with as little disruption as possible to the ongoing
survey operations.
125.
SAMPLE DESIGNS
STATISTICS CANADA
113
Oneparticular type of repeated survey is a panel or longitudinal survey, where data are collected from the
same sample units on several occasions. Such surveys usually measure changes in the characteristics of a
given population with greater precision than do a series of independent samples of comparable size.
If a survey is to be repeated there are advantages to using a longitudinal sample, rather than doing a
series of ad hoc independent samples. Some of the advantages are:
i. It reduces the sampling variance for estimates of change (i.e., 12
ˆˆ YY − , where 1
ˆY is an estimate of
the total at time 1 and 2
ˆY is an estimate of the total at time 2). For example, this might be a
measure of the change in the number of unemployed persons from one month to the next.
ii. It can be used to obtain information on the behaviour of respondents over time.
iii. It may reduce response errors (since respondents acquire a better understanding of the
questionnaire).
iv. It may result in a cost reduction over time (development of survey, programming of computer
systems, staff training, etc., are done over a long period of time).
Some of the disadvantages of using a longitudinal sample instead of several independent samples are:
i. Its estimation, treatment of nonresponse, etc., is more complex.
ii. It requires that the budget for the survey be guaranteed for the life of the panel. This entails a cost
commitment over a long period of time.
iii. It is harder to maintain representativeness across time periods because of changes that occur in
the population over time such as the addition of new units and the withdrawal of others.
iv. It may increase response error (for example, respondents’ knowledge of the questionnaire may
lead some to answer questions incorrectly in order to speed up the interview).
v. It can lead to higher nonresponse over time (due to respondent fatigue – the same person is
surveyed repeatedly over time; difficulty tracing, etc.)
vi. Its organisation is more complex than for a one-time survey.
vii. It can result in survey-induced behaviour. For example, a respondent who is repeatedly asked
about visits to the doctor may start visiting a doctor as a result of the survey.
viii. It can be difficult to define some concepts (e.g., household composition can change over time, so
how is a longitudinal household defined?).
ix. If the initial sample drawn is a ‘bad’ sample, the statistical agency must continue with that
sample.
One design that is intermediate between independent samples on successive occasions and a longitudinal
sample takes the form of a rotating sample design in which part of the sample is replaced at each survey
occasion.
126.
SURVEY METHODS ANDPRACTICES
STATISTICS CANADA
114
For example, the Canadian Labour Force Survey (LFS) employs a rotation design in which households
are included in the sample for six consecutive months, and every month, one sixth of the sample is
replaced by a new group of households. The LFS sample is divided into six panels (or groups). Each
panel in the survey is surveyed once a month for six months. At the end of its six months, the panel is
removed from the survey (rotated out) and a new one is rotated in. This puts a limit on respondent burden
(the average LFS interview is under 10 minutes) and gives a good sample overlap each month. An
additional advantage is that the sample is refreshed each month. If the sample were never updated, then
members of the sample would age over time, and families in new dwellings would never have a chance to
enter the sample. As a result, the sample would no longer reflect the current population and would
become biased over time.
This design offers the advantage of measuring monthly changes with greater precision, less cost and with
less disruption to the field operations than would otherwise be the case if independent samples were used.
It also reduces the problem of respondent burden associated with panel studies. (Nonetheless, to reflect
changes in the size and structure of the population and data requirements, the LFS undergoes periodic
redesigns, usually in the wake of the decennial census.)
In addition to the LFS, such designs are often used in business surveys. Note that rotating sample designs,
in addition to the basic sample design, also require a methodology for how to rotate the sample. This can
be complex and goes beyond the scope of this manual. For more details on rotating samples and
longitudinal surveys in general, see Kalton, 1992.
6.3.2 Entry/Exit Surveys
Entry/exit surveys apply to populations crossing a border, for example people entering (or leaving) a
country or users of a toll road. The problem with such populations is creating an up-to-date list frame with
contact information so that the units can be interviewed or sent questionnaires. For example, suppose the
client wishes to interview foreign visitors to Canada and that it is possible to obtain a list from customs of
all visitors who entered the country on a particular date. One problem is how to find these people to
interview them? By the time the frame is created, the travellers may have returned home, making an
interview impractical. If they are still in Canada, it is unlikely that there is an address for them.
It is for these reasons that a conceptual frame and systematic sampling, or two-stage cluster sampling with
systematic sampling within sampled clusters, is often used to survey such populations. The conceptual
frame might be a list of the population units enumerated within a certain time interval at particular
locations. For the frame to have complete coverage, these locations must be areas where the target
population is concentrated. Often, entrance and exit areas are used. Exit areas are more popular since most
surveys are interested in the activities the unit pursued before leaving the area.
An important consideration in the sample design – as with all sample designs – is field procedures. The
operational and design challenge is to make optimal use of fieldworkers while maintaining a probability
sample. An uneven flow of visitors creates a highly variable workload, making efficient staff allocation
difficult. The most effective use of an interviewer’s time is to interview the kth
visitor after completing the
current interview, but this would be a non-probability design. Systematic sampling where one person
counts people and a small team of interviewers hand out questionnaires or conduct interviews is
preferable. The team size will depend on the flow density and the length of the interview, if interviews are
conducted.
127.
SAMPLE DESIGNS
STATISTICS CANADA
115
Datacollection can be done via self-enumeration, interviews or direct observation, when appropriate. For
self-enumeration questionnaires, the response rate is better if the respondent completes the questionnaire
on site, rather than mailing it back to the statistical agency. Interviews obviously require more field staff,
but result in higher response rates. Direct observation is very accurate and desirable, but not always
applicable.
The main advantage of an entry/exit survey is that the frame for the final stage can be created while in
the field.
The disadvantages of an entry/exit survey are:
i. It can be difficult to relate the survey population to a commonly understood population. This is
because entry/exit surveys measure visitors, rather than people. For example, if a survey is
conducted at a store, someone who visits the store more than once during the time period will be
counted more than once.
ii. It can be difficult to manage field operations due to variable flows in the population. For this
reason, it is recommended that interviews be kept short.
iii. It typically yields low response rates.
6.3.3 Snowball Sampling
Suppose the client wishes to find rare individuals in the population and already knows of the existence of
some of these individuals and can contact them. One approach is to contact those individuals and simply
ask them if they know anyone like themselves, contact those people, etc. The sample grows like a
snowball rolling down a hill to hopefully include virtually everybody with that characteristic. Snowball
sampling is useful for small or specialised populations such as blind, deaf, or other persons who may not
belong to an organised group or such as musicians, painters, or poets, not readily identified on a survey
list frame. However, snowball sampling is a method of nonprobability sampling: some individuals or sub-
groups may have no chance of being sampled. In order to make inferences, strong modelling assumptions
(which are usually not met) are required.
Network sampling and adaptive cluster sampling are similar sample designs that are used to target rare or
specialised populations.
6.4 Summary
This chapter covered the basics of sampling. The two main types of sampling are probability sampling
and non-probability sampling. Non-probability sampling is of limited use for surveys conducted by
statistical agencies, since the biased selection of units does not readily permit inferences to be made about
the survey population. However, it is fast and easy and can be useful for exploratory studies or during the
development phase of a survey (e.g., to test the questionnaire).
Probability sampling should be used when inferences about the population are to be made based on the
survey results. In a probability sample, every unit on the frame has a non-zero probability of being
selected and the units are selected randomly. As a result, selection is unbiased and it is possible to
calculate the probabilities of inclusion, calculate the sampling variance of estimates and make inferences
128.
SURVEY METHODS ANDPRACTICES
STATISTICS CANADA
116
about the population. The main disadvantages of probability sampling is that it requires more time, is
more costly than non-probability sampling and requires a high quality sampling frame.
The simplest probability sample designs are simple random sampling and systematic sampling, which
result in equal probabilities of inclusion. More complex designs that can result in unequal probabilities of
inclusion and most of which require auxiliary information include: stratified, probability-proportional-to-
size, cluster, multi-stage and multi-phase sampling. Unequal probability designs are typically used to
improve the statistical efficiency of the sampling strategy or to reduce the cost of sampling. Sometimes,
their use is dictated by the sampling frame.
When deciding between the various possible designs, the first thing to determine is what designs are
feasible given the survey frame, units on the survey frame, domains of interest, response burden, the
method of data collection, budget, etc.?
Some things to consider are:
- Does the survey frame have auxiliary data that could be used to improve the efficiency of sampling?
(Should the survey frame be stratified and/or should PPS be performed?)
- Does the survey frame lack auxiliary information that could be used to screen out units or that would
be useful for stratification? Is data collection very expensive or burdensome? (Should two-phase
sampling be performed?)
- Is the population naturally clustered or are the units on the survey frame clusters? Is the population
spread out geographically and personal interviews to be conducted? (Should single-stage or multi-
stage cluster sampling be performed?)
Finally, there are several special applications of sample designs that can be made depending on the
specific needs of the survey.
For how to determine the size of sample required to satisfy a given level of precision, and how to compare
the efficiency of different sample designs by comparing design effects, see Chapter 8 - Sample Size
Determination and Allocation.
Bibliography
Bebbington, A.C. 1975. A Simple Method of Drawing a Sample without Replacement. Applied Statistics,
24(1).
Binder, D.A. 1998. Longitudinal Surveys: Why are These Surveys Different from all Other Surveys?
Survey Methodology, 24(2): 101-108.
Brewer K.R.W. and M. Hanif. 1983. Sampling with Unequal Probabilities. Springer-Verlag, New York.
Cochran, W.G. 1977. Sampling Techniques. John Wiley and Sons, New York.
Conner, W.S. 1966. An Exact Formula for the Probability that Two Specified Sample Units Will Occur in
a Sample Drawn with Unequal Probabilities and Without Replacement. Journal of the American
Statistical Association, 61: 385-390.
Cox, B.G., D.A. Binder, B.N. Chinnappa, A. Christianson, M.J. Colledge and P.S. Kott, eds. 1995.
Business Survey Methods. John Wiley and Sons, New York.
129.
SAMPLE DESIGNS
STATISTICS CANADA
117
Droesbeke,J.-J., B. Fichet and P. Tassi, 1987. Les Sondages. Economica, Paris.
Fellegi, I.P. 1963. Sampling with Varying Probabilities Without Replacement Rotating and Non-Rotating
Samples. Journal of the American Statistical Association, 58: 183-201.
Fink, A. 1995. The Survey Kit. Sage Publications, California.
Fowler, F.J. 1984. Survey Research Methods. 1. Sage Publications, California.
Gambino, J.G., M.P. Singh, J. Dufour, B. Kennedy and J. Lindeyer. 1998. Methodology of the Canadian
Labour Force Survey. Statistics Canada. 71-526.
Gray, G.B. 1971. Joint Probabilities of Selection of Units in Systematic Samples. Proceedings for the
American Statistical Association. 271-276.
Hidiroglou, M.A. 1994. Sampling and Estimation for Establishment Surveys: Stumbling Blocks and
Progress. Proceedings of the Section on Survey Research Methods. American Statistical
Association. 153-162.
Hidiroglou, M.A. and G.B. Gray. 1980. Construction of Joint Probabilities of Selection for Systematic
P.P.S. Sampling. Applied Statistics, 29(1): 663-685.
Hidiroglou, M.A. and K.P. Srinath. 1993. Problems Associated with Designing Sub-Annual Business
Surveys. Journal of Economic Statistics, 11: 397-405.
Horvitz, D.G. and D.J. Thompson. 1952. A Generalization of Sampling Without Replacement from a
Finite Universe. Journal of the American Statistical Association, 47: 663-685.
Kalton, G. 1992. Panel Surveys: Adding the Fourth Dimension. Proceedings of Statistics Canada
Symposium 1992: Design and Analysis of Longitudinal Surveys. 7-18.
Kalton, G., J. Kordos and R. Platek, eds. 1992. Small Area Statistics and Survey Designs. Central
Statistical Office, Warsaw. 31-75.
Kasprzyk, D., G.J. Duncan, G. Kalton and M.P. Singh, eds. 1989. Panel Surveys. John Wiley and Sons,
New York.
Kish, L. 1965. Survey Sampling. John Wiley and Sons, New York.
Lavallée, P. 1998. Course notes for Theory and Application of Longitudinal Surveys, Statistics Canada.
Levy, P. and S. Lemeshow. 1991. Sampling of Populations. John Wiley and Sons, New York.
Lohr, Sharon. 1999. Sampling: Design and Analysis. Duxbury Press, U.S.A.
McLeod, A.I. and D.R. Bellhouse. 1983. A Convenient Algorithm for Drawing a SRS. Applied Statistics,
32(2).
Moser C.A. and G. Kalton. 1971. Survey Methods in Social Investigation. Heinemann Educational Books
Limited, London.
130.
SURVEY METHODS ANDPRACTICES
STATISTICS CANADA
118
Rao, J.N.K, H.O. Hartley and W.G. Cochran. 1962. On a Simple Procedure of Unequal Probability
Sampling Without Replacement. Journal of the Royal Statistical Society, B, 27: 482-490.
Särndal, C.E., B. Swensson and J. Wretman. 1992. Model Assisted Survey Sampling. Springer-Verlag,
New York.
Satin, A. and W. Shastry. 1993. Survey Sampling: A Non-Mathematical Guide – Second Edition.
Statistics Canada. 12-602E.
Stuart, A. 1968. Basic Ideas of Scientific Sampling. Charles Griffin and Company Limited, London.
Thompson, M. 1997. Theory of Sample Surveys. Chapman and Hill, United Kingdom.
Thompson, S.K. 1992. Sampling. John Wiley and Sons, New York.
Yates, F. and P.M. Grundy. 1953. Selection Without Replacement from Within Strata with Probability-
proportional-to-size. Journal of the Royal Statistical Society, B, 15: 235-261.
131.
STATISTICS CANADA
119
Chapter 7- Estimation
7.0 Introduction
Chapter 1 - Introduction to Surveys states that the client is typically motivated by a wish to study the
characteristics of a population. Estimation is the means by which the statistical agency obtains values
for the population of interest so that it can draw conclusions about that population based on
information gathered from only a sample of the population.
The principle behind estimation in a probability survey is that each sample unit represents not only itself,
but also several units of the survey population. It is common to call the average number of units in the
population that a unit in the sample represents the design weight of the unit. Determining this weight is an
important part of the estimation process. While the design weights can be used for estimation, most
surveys produce a set of estimation weights by adjusting the design weights. The two most common
reasons for making adjustments are to account for nonresponse and to make use of auxiliary data.
Once the final estimation weights have been calculated, they are applied to the sample data in order to
compute estimates. Summary measures of the population such as totals, averages and proportions are
typically estimated for a wide range of characteristics collected from the sample units. These
characteristics, often referred to as variables in statistical theory, may be qualitative – for example, sex or
marital status – or quantitative – for example, age or income. Depending on the type of data, different
formulas are appropriate for the estimation of summary measures.
An important part of estimation is estimating the magnitude of the sampling error in the estimate. This
provides a measure of the quality of the survey’s estimates for the specific sample design. Sampling error
can only be estimated if probability sampling is used.
The purpose of this chapter is to illustrate how to calculate weights, generate estimates of summary
measures and estimates of their sampling error for probability sample surveys.
7.1 Weighting
The first step in estimation is assigning a weight to each sampled unit or to each of the responding
sampled units. The design weight can be thought of as the average number of units in the survey
population that each sampled unit represents and is determined by the sample design. The design
weight, wd (where d stands for design) for a unit is the sample is the inverse of its inclusion probability, π.
Note that for a multi-stage or multi-phase design, a unit’s probability of selection is the combined
probability of selection at each stage or phase. Thus, for a two-phase sample where a unit’s probability of
selection is π1 at the first phase and π2 at the second phase, a sample unit’s design weight is:
21
11
ππ
×=dw
Survey sample data are generally provided in a file with one record for each sampled unit. Recall that
with probability sampling, each unit has a known probability, π, of being sampled. If that inclusion
probability is, for example, one in fifty, then each selected unit represents on average 50 units of the
survey population and the design weight is wd=50. If the weight is a whole number, one way to produce
132.
SURVEY METHODS ANDPRACTICES
STATISTICS CANADA
120
estimates for the population would be to replicate each record so that there are 50 copies of each one and
then to calculate any values of interest (such as averages, totals, ratios, etc.) from this file. Replication
becomes more difficult when the weight is not an integer value. (For example, if two units out of five are
selected using simple random sampling, then the design weight is wd=2.5). In general, it is easier to
include a weight variable to the record of each unit in the sample.
The discussion of weighting will begin with equal probability designs which is the simplest case of
weighting.
7.1.1 Weighting for Equal Probability Sample Designs
Sample designs are called self-weighting when the design weights are the same for all units in the sample.
This occurs when each unit has the same inclusion probability. For self-weighting designs, if no
subsequent adjustments are made to the design weights (e.g., for nonresponse or auxiliary data), weights
can be ignored in the production of some statistics, such as proportions and averages. The production of
totals simply requires that the sample total be inflated by the design weight.
Which one-stage designs are self-weighting? Simple random samples (SRS) and systematic samples are
self-weighting since each unit has an equal chance of being included in the sample. In the case of a
stratified design, a self-weighting design is obtained, for example, when an SRS is selected in each
stratum and the sample size in each stratum is proportional to the population size of the stratum. Thus, the
sampling fraction is the same in each stratum and all units in the population have the same inclusion
probability. (Allocating the sample across the strata in this manner is called N-proportional allocation and
is discussed in more detail in Chapter 8 - Sample Size Determination and Allocation.)
Example 7.1: Stratified SRS with N-Proportional Allocation
Suppose a population of N=1,000 persons is divided into two strata on the survey frame. The first stratum
is composed of N1=400 men and the second one of N2=600 women. A total sample of size n=250, across
both strata, is selected and the sample is allocated proportionally to the size of each stratum. The sampling
fraction in each stratum is thus equal to n/N=250/1,000=1/4.
Table 1: Stratified SRS with N-Proportional Allocation
Stratum Population Size Sample Size
Men N1=400 n1=100
Women N2=600 n2=150
Total N =1,000 n=250
The inclusion probabilities in each stratum are:
Stratum 1, Men: Stratum 2, Women:
4
1
400
100
1
1
1
=
=
=
N
n
π
4
1
600
150
2
2
2
=
=
=
N
n
π
133.
ESTIMATION
STATISTICS CANADA
121
Therefore, everyonehas the same probability of being selected and the same design weight,
4/1 == πdw .
For a multi-stage design, self-weighting is achieved by selecting clusters with probability-proportional-to-
size (PPS) at all stages except the final one. At the final stage, a fixed number of units within a cluster is
selected (e.g., always pick n=5 at the final stage). PPS is often used in multi-stage designs since it can
lead to a self-weighting sample while controlling the size of the sample.
An example of a self-weighting two-phase design would be one where an SRS or systematic sample or a
stratified sample with N-proportional allocation is drawn at each phase.
For more information on sample designs, see Chapter 6 - Sample Designs.
7.1.2 Weighting for Unequal Probability Sample Designs
Although the simplicity of self-weighting designs is appealing, it is not always possible or desirable to
select a self-weighting sample. For example, in the case of a stratified design for a national survey for
smaller regions, N-proportional allocation may result in inadequate sample sizes and for larger regions, it
may result in unnecessarily large samples.
The following example illustrates design weights for a stratified sample design where the sample size in
each stratum is not proportional to the size of the population in the stratum. (For more details on
disproportional allocation, see Chapter 8 - Sample Size Determination and Allocation.)
Example 7.2: Stratified SRS with Disproportional Allocation
For a survey on public transportation, the population of N=1,100 persons is divided in two geographical
strata. Since it is felt that persons living in urban and rural areas might be very different with respect to
the information collected from the survey, a stratified sample design is used. The urban stratum is of size
N1=1,000 while the rural stratum is of size N2=100. A sample of n=250 persons is selected: n1=200 in the
urban stratum and n2=50 in the rural stratum. What are the design weights of the sampled persons?
Table 2: Stratified SRS with Disproportional Allocation
Stratum Population Size Sample Size
Urban N1=1,000 n1=200
Rural N2=100 n2=50
Total N =1,100 n=250
The inclusion probabilities in each stratum are:
Stratum 1, Urban: Stratum 2, Rural:
5
1
000,1
200
1
1
1
=
=
=
N
n
π
2
1
100
50
2
2
2
=
=
=
N
n
π
134.
SURVEY METHODS ANDPRACTICES
STATISTICS CANADA
122
On the sample file, each respondent in the urban stratum has a design weight of wd,1=5 and each
respondent in the rural stratum has a design weight of wd,2=2.
For multi-stage or multi-phase sampling, the overall design weight is calculated my multiplying the
probability of selection at each stage or phase and then taking the inverse. For example, suppose a two-
stage cluster sample selects an SRS of n1=10 out of N1=100 clusters at the first stage and an SRS of n2=30
units within each cluster at the second stage, where the number of units within each cluster is N2=60.
The probability of selection at the first stage is:
10
1
100
10
1
1
1
=
=
=
N
n
π
and the probability at the second stage is:
2
1
60
30
2
2
2
=
=
=
N
n
π
So the design weight is:
20
210
11
21
=
×=
×=
ππdw
7.1.3 Weight Adjustment for Nonresponse
All surveys suffer from nonresponse, which occurs when all or some of the information requested from
sampled units is unavailable for some reason. As presented in Chapter 3 - Introduction to Survey
Design, there are two main types of nonresponse, item and total nonresponse. Item (or partial)
nonresponse occurs when information is available for only some items, such as when the respondent
answers only part of the questionnaire. In this case, the most common approach is to impute the missing
values. (Different approaches for imputing item or partial nonresponse are discussed in Chapter 10 -
Processing.)
This section focuses on total nonresponse – the case when all or almost all data for a sampled unit are
missing. This can occur when the sample unit refuses to participate, no contact is made, the unit cannot be
located or the information obtained is unusable. The easiest way to deal with such nonresponse is to
ignore it. In some exceptional circumstances, proportions or averages estimated without adjusting for total
135.
ESTIMATION
STATISTICS CANADA
123
nonresponse arethe same as those produced using a nonresponse adjustment. However, not compensating
for the nonresponding units leads to the underestimation of totals (for example, the size of a population,
total income or total acreage of crops).
The most common way of dealing with total nonresponse is to adjust the design weights based on the
assumption that the responding units represent both responding and nonresponding units. This is
reasonable under the assumption that, for the characteristics measured in the survey, the nonrespondents
are like the respondents. The design weights of the nonrespondents are then redistributed amongst the
respondents. This is often done using a nonresponse adjustment factor that is multiplied by the design
weight to produce a nonresponse adjusted weight, as illustrated in example 7.3 below.
It should be noted that data from a census may also have a nonresponse weight adjustment, where the
initial design weights in this case would be equal to one, wd = 1. For more details on nonresponse bias, see
Chapter 3 - Introduction to Survey Design and Chapter 5 - Questionnaire Design.
7.1.3.1 Nonresponse Weight Adjustment Factors
The nonresponse adjustment factor is usually defined as the ratio of the sum of the weights in the original
sample to the sum of the weights of the responding units. In a self-weighting design, this is equivalent to
the ratio of the number of units in the original sample to the number of responding units and is illustrated
below.
Example 7.3: Nonresponse Adjustment Factor for SRS, One Nonresponse Group
An SRS of n = 25 persons was selected from a population of N=100 persons. Denote the number of
respondent units by nr. Only nr = 20 persons provided all the information required. What are the
nonresponse adjusted weights of the sample units?
1. The first step is to calculate the inclusion probabilities for an SRS:
4
1
100
25
=
=
=
N
n
π
Therefore, the design weight for every sampled unit is wd = 4.
2. The second step is to calculate the nonresponse adjustment factor.
Since only nr = 20 persons out of the n = 25 selected provided the information required, the final sample
size is 20. Assuming the responding units can be used to represent both responding and nonresponding
units, the nonresponse adjustment factor is:
136.
SURVEY METHODS ANDPRACTICES
STATISTICS CANADA
124
25.1
20
25
=
=
rn
n
3. The last step is to compute the nonresponse adjusted weight.
The nonresponse adjusted design weight, wnr, is the product of the design weight and the nonresponse
adjustment factor:
5
25.14
=
×=
=
r
dnr
n
n
ww
Therefore, each respondent represents 5 people in the survey population. A final weight of 5 is assigned to
each unit on the data file.
If the assumption that all non-respondents are like respondents for the characteristics measured in the
survey is appropriate, the same nonresponse adjustment factor can be used for all respondent units (as
above). However, there are usually subgroups with different response propensities and different
characteristics, in which case, one adjustment for all respondents can bias the results. For example, single
person households often have lower response rates and different characteristics than multi-person
households. In such cases, separate nonresponse adjustments should be performed.
In the example below, a different nonresponse adjustment factor is applied to each of the two strata: urban
and rural. The reason for this is that characteristics of interest differ between strata.
Example 7.2 (continued): Nonresponse Adjustment Factor for Stratified SRS (where Nonresponse
Group = Stratum)
During data collection, only nr,1 = 150 persons in the urban stratum and nr,2=40 persons in the rural
stratum provide the required information. What are the nonresponse adjusted weights of these
respondents?
Table 3: Stratified SRS with Nonresponse
Stratum Population Size Sample Size Number of Respondents
Urban N1=1,000 n1=200 nr,1=150
Rural N2=100 n2=50 nr,2=40
1. The design weight in each stratum is wd,1 = 5 for the urban stratum and wd,2 = 2 for the rural stratum.
2. A nonresponse adjustment factor is calculated for each stratum as follows:
Stratum 1, Urban: Stratum 2, Rural:
33.1
150
200
1,
1
=
=
rn
n
25.1
40
50
2,
2
=
=
rn
n
137.
ESTIMATION
STATISTICS CANADA
125
3. Thenonresponse adjusted weight for each stratum is the product of the design weight and the
nonresponse adjustment factor.
Stratum 1, Urban: Stratum 2, Rural:
67.6
33.15
1,
1
1,1,
=
×=
=
r
dnr
n
n
ww
5.2
25.12
2,
2
2,2,
=
×=
=
r
dnr
n
n
ww
On the sample file, each respondent in the urban stratum is given a final weight of 6.67 and each
respondent in the rural stratum is given a final weight of 2.5.
When calculating the nonresponse adjustment factor, it is important to take into consideration the fact that
some sampled units may turn out to be out-of-scope (i.e., not part of the target population). For example,
in a survey of retail businesses, some of the frame information may be incorrect and a sampled unit may
actually be a wholesaler. The nonresponse adjustment should only be calculated with respect to in-scope
units. This is because out-of-scope units in the sample typically represent other out-of-scope units in the
frame. Because out-of-scope units are not expected to answer the survey, their response rates can be
assumed to be 100%. The above example assumes that all nonrespondents are in-scope; the resulting
adjustment factors could be quite different depending on what are believed to be the true number of in-
scope nonrespondents.
For all of these methods, it is best to group together similar records, as is done for nonresponse weight
adjustments (see Chapter 7 - Estimation). These groupings are referred to as imputation classes.
The nonresponse adjustment should be performed separately for similar groups of respondents, where
each group of respondents can represent the nonrespondents in that group. These groupings may be strata,
or post-strata (see following section), or analysis can be performed to determine the groupings (e.g., chi-
square tests or logistic regression). For more details on nonresponse adjustments, see Groves and Couper
(1998).
For an explanation of chi-square tests and logistic regression, see Chapter 11 - Analysis of Survey Data.
7.1.4 Using Auxiliary Information to Adjust Weights
The design weight multiplied by the nonresponse adjustment factor can be used to produce final weights
and survey estimates of the desired characteristics. However, sometimes information about the survey
population is available from other sources, for example information from a previous census. This
information can also be incorporated in the weighting process.
There are two main reasons for using auxiliary data at estimation. The first reason is that it is often
important for the survey estimates to match known population totals or estimates from another, more
reliable, survey. For example, many social surveys adjust their survey estimates in order to be consistent
with estimates (age, sex distributions, etc.) of the most recent census of population. Auxiliary information
may also be obtained from administrative data or from another survey that is considered to be more
reliable because of its larger sample size or because its published estimates must be respected.
The second reason for using auxiliary data is to improve the precision of the estimates. Recall that an
138.
SURVEY METHODS ANDPRACTICES
STATISTICS CANADA
126
estimator with small sampling variance – a measure of sampling error – is said to be precise. Chapter 6 -
Sample Designs discussed the importance using auxiliary data when designing the sample in order to
improve the statistical efficiency of the sampling strategy. At the design stage, however, auxiliary
information must be available for all units on the frame. At estimation, auxiliary data can be used to
improve the precision of the estimates as long as the values of the auxiliary variables are collected for the
surveyed units and that population totals or estimates are available for these auxiliary variables from
another reliable source.
For example, if a person’s age is not available on the frame, then it cannot be used to stratify the
population. However, if this information is collected by the survey, then the survey’s estimates can be
adjusted to match the Census’ age distribution. If age is correlated to other variables collected by the
survey (for example, health variables), its use as auxiliary data can improve the precision of the estimates.
This will be illustrated in the following sections.
Auxiliary information may also be used to further correct for different nonresponse rates in different
subgroups of the population. It may also help to adjust for coverage inadequacies that result in the survey
population differing from the target population.
There are three basic requirements for the successful use of auxiliary data at the estimation stage:
- the auxiliary data must be well correlated with the survey variables;
- the external sources of information concerning the population must be accurate;
- the auxiliary information must be collected for all responding sample units if only population totals
are known.
The gains in efficiency of estimates that use auxiliary data depend on how well the survey variables are
correlated with the available auxiliary data. The accuracy of the auxiliary information is important. Not
only do the data have to be reliable, it is important that the external data source pertain to the same target
population and be based upon comparable concepts, definitions, reference periods, etc., as that of the
survey.
The following sections describe how auxiliary data can be used for estimation. For more information on
the use of auxiliary data, see Appendix A - Administrative Data.
7.1.4.1 Post-Stratification
Post-stratification is used to adjust the survey’s weights using variables that are suitable for stratification
but which could not be used at the design stage because the data were not available, or for which more
up-to-date, reliable stratification information for the population became available after sample selection.
Post-stratification is used when the auxiliary data are in the form of counts, for example, the number of
men and women in the population. It is most effective at reducing sampling variance when the population
averages of the variables of interest are as different as possible across the post-strata. It should be noted
that whenever possible, it is preferable to stratify at the design stage rather than to post-stratify.
The following example shows how to use post-stratification to improve the estimate of the number of
smokers in a company.
Example 7.4: Post-Stratification Weight Adjustment for SRS
Suppose that a survey is conducted to get information on smoking habits of the employees of a small
company. An SRS of n=25 persons is selected from the list of N=78 employees. At the design stage, no
139.
ESTIMATION
STATISTICS CANADA
127
auxiliary informationwas available that could be used for stratification.
In addition to information on smoking habits, the age and sex of each respondent is collected. Of the
original n=25 persons, nr=15 respond with the following distribution:
Table 4: SRS with Nonresponse and Post-Stratification
Post-Stratum 1,
Men
Post-Stratum 2,
Women
Number of Respondents
All Employees 3 12 15
Employees who Smoke 1 7 8
1. The inclusion probability for each sampled unit is:
32.0
78
25
=
=
=
N
n
π
The design weight therefore is wd=1/π=3.12.
2. The nonresponse adjustment factor, assuming that everyone in the survey has the same probability of
responding to the survey (i.e., one nonresponse group) is:
67.1
15
25
=
=
rn
n
3. The nonresponse adjusted weight is:
2.5
67.112.3
=
×=
=
r
dnr
n
n
ww
So, all respondents have the same nonresponse adjusted weight, wr=5.2. Using these weights, the
following survey estimates are generated (for details on how to generate survey estimates, see section
7.2):
Table 5: Survey Estimates with Nonresponse Adjustment
Men Women Total
Number of Employees 15.6 62.4 78.0
Number of Smokers 5.2 36.4 41.6
Proportion of Smokers 0.33 0.59 0.53
The nonresponse adjusted weights lead to an estimate of about 16 men and 62 women working in the
company, with an estimated 33% of men and 59% of women in the company smoking. Suppose that after
the survey has been conducted, the following auxiliary information becomes available: there are 42 men
and 36 women working in the company. The estimates produced by the survey are quite different from
140.
SURVEY METHODS ANDPRACTICES
STATISTICS CANADA
128
these true values.
The statistical agency would like the survey estimates to be consistent with the known number of men and
women. The agency also suspects that smoking habits are related to a person’s sex, so post-stratification
could improve the precision of the smoking estimates. In fact, if this information had been available at the
time of the sample design, the statistical agency would have stratified by sex. What can be done?
It is possible to stratify the sample after the fact and create what are referred to as post-stratified weights
to be used at estimation. The post-stratified weight, wpst, is the product of the nonresponse adjusted
weight, wnr, and the post-stratified adjustment factor.
The post-stratified adjustment factor is computed for each post-stratum. This factor corresponds to the
ratio of the number of population units in the post-stratum, N, to the estimated number of population units
in the post-stratum, Nˆ , which is estimated using the design weights adjusted for nonresponse.
4. In this example, the post-stratification adjustment factor is:
Post-Stratum 1, Men: Post-Stratum 2, Women:
69.2
6.15
42
ˆ
=
=
men
men
N
N
58.0
4.62
36
ˆ
=
=
women
women
N
N
(Note that the while this example is for SRS the same formula, NN ˆ/ , is used for more complex design
weights.)
When applied to the nonresponse adjusted weight, it produces the final post-stratified weights:
Post-Stratum 1, Men: Post-Stratum 2, Women:
14
69.22.5
ˆ,
=
×=
×=
men
men
nrmenpst
N
N
ww
3
58.02.5
ˆ,
=
×=
×=
women
women
nrwomenpst
N
N
ww
Using the post-stratified weights, the survey estimates are now:
Table 6: Survey Estimates with Nonresponse and Post-Stratification Adjustment
Men Women Total
Number of Persons 42 36 78
Number of Smokers 14 21 35
Proportion of Smokers 0.33 0.59 0.45
The estimates of the number of men and women are now consistent with the known totals of men and
women in the company, and to the extent that sex is related to the number and proportion of smokers,
considerable improvements in precision may be obtained. Note that the proportion of smokers within each
post-stratum has not changed, but that the proportion of smokers in the total population, which involves
more than one post-stratum, has changed.
141.
ESTIMATION
STATISTICS CANADA
129
7.1.4.2 RatioEstimation
A method commonly used in surveys for incorporating auxiliary information to improve survey estimates
is ratio estimation. When the data are in the form of counts, ratio estimation corresponds to post-
stratification. In general, with ratio estimation the weights of the records in a classification group are
adjusted by a multiplicative factor. This factor is the ratio of the estimate from the auxiliary data to the
survey estimate for the same variable, for the classification group.
For example, if the objective of a survey is to estimate the acreage of wheat in specific regions, then
knowledge of the total acreage in each region could be a useful auxiliary variable. If the acreage of wheat
is highly correlated with the total land within the region, this auxiliary information could improve the
estimates of acreage of wheat. Using ratio estimation, the adjustment factor for each region would be the
total land area in the region divided by the sample estimate of the total land area in the region (i.e., the
adjustment factor would be of the form )ˆ/YY . In Example 7.4, the ratios were the number of men
divided by the estimated number of men and the same ratio for women, which, since these are counts,
corresponds to post-stratification. Like the preceding methods, ratio estimation can be applied separately
by stratum, if auxiliary information is available at that level and the sample size in each stratum is
adequate.
7.1.4.3 More Complex Weight Adjustments: Calibration and Generalised Regression
Ratio estimation is based on the assumption that there is a simple multiplicative relationship between the
survey characteristics and an auxiliary variable (i.e., 2.7 as many men implies 2.7 as many male smokers).
However, this assumption may not hold true in all situations. First, using a single auxiliary variable may
be insufficient to provide good estimates. Second, the relationship between the variable being estimated
and the auxiliary variable may be more complex than a simple multiplicative one. In this case, regression
estimation may be used. Regression estimation is a more complex approach that allows the analyst to
consider more sophisticated models, including models with more than one auxiliary variable.
Another problem with ratio estimation is that it may be necessary to ensure that the weighted sample
totals agree with known population totals for more than one characteristic. When the weighted sample
totals must agree with reference totals for more than one characteristic, a method called calibration needs
to be used. This situation would arise, for example, when poststrata are formed using more than one
variable and only the marginal population totals for each variable are known. For example, if population
counts were available by age group and by sex but the counts of men and women within each age group
were unknown, in which case, the post-stratification method described previously could not be applied
using both characteristics. (Ratio estimation and post-stratification are calibration using one variable.)
An extension of the ratio method, referred to as raking ratio estimation allows the statistical agency to
compute adjusted weights so that the estimates are very close to marginal reference counts for each
characteristic. A description of this method can be found in Deming and Stephan (1940), Arora and
Brackstone (1977), Bankier (1978), Brackstone and Rao (1978), Binder (1988).
Generalised estimation procedures have also been developed to produce estimates that agree with
reference totals for many characteristics simultaneously. In these general techniques, the process of
ensuring that the reference totals are matched is referred to as calibration and the weight adjustments
produced are called calibration factors.
142.
SURVEY METHODS ANDPRACTICES
STATISTICS CANADA
130
As with post-stratification and ratio estimation, these techniques result in adjustments to the initial design
weights. The final weights used to calculate estimates become the product of the initial weights adjusted
for nonresponse and calibration factors. Generalised estimation procedures are beyond the scope of this
document. The reader will find the theory of generalised regression estimation in Särndal, Swensson and
Wretman (1992), Deville and Särndal (1992), and Hidiroglou and Särndal (1998). See also Chapter 11 -
Analysis of Survey Data for an introduction to linear regression.
7.2 Production of Simple Estimates (Totals, Averages and Proportions)
The examples so far have illustrated how to calculate design weights and adjust them for nonresponse and
auxiliary data. This section explains how to generate estimates using the final estimation weights.
We have already noted in Chapter 6 - Sample Designs that with probability sampling, the sampling
distribution of the estimator can be determined. With non-probability sampling, since the probabilities of
different samples being selected are unknown, the sampling distribution cannot be calculated. Being able
to measure sampling error is an important part of survey estimation and therefore one of the main reasons
for performing probability sampling.
7.2.1 Estimators for Different Types of Data
Simple descriptive statistics such as totals, averages and proportions are produced for virtually every
survey. Usually, more complex statistics and analyses are also required. In most surveys, data are
collected for a wide range of variables which may be qualitative (also referred to as categorical) or
quantitative.
For some qualitative variables, such as sex or marital status, only a few categories are possible. For
opinion questions, the respondents' answers are often collected using a scale of agreement such as
strongly agree, agree, neither agree nor disagree, disagree, strongly disagree. Note that with categorical
data, each unit fits into one and only one category.
If the unit of measurement indicates quantities such as metres or years, the data are called quantitative
data. Quantitative data are typically answers to questions of the type how much? or how many? Some
examples are age, number of children, number of hours worked, expenditure and income, and blood
pressure.
Different types of estimators are appropriate for these different types of variables. Proportions and total
counts are typically produced for qualitative variables while averages and totals are estimated for
quantitative variables. In this section, the procedures for the production of estimates will be presented
separately for qualitative and quantitative data.
Besides the type of data, another consideration during estimation is the nature of the population for which
the estimates are to be made. Estimates can be produced for the whole survey population or for specific
subgroups or domains of the population (e.g., provinces). When the original classification of sampling
units has changed between the time of sample selection and estimation, the new classification should be
used for domain estimation.
The answers to the following questions will help determine how the survey estimates are computed:
- What type of statistic is needed? A total, an average, a proportion?
143.
ESTIMATION
STATISTICS CANADA
131
- Whattype of data is being used? Qualitative or quantitative?
- What are the final weights?
- What are the domains of interest?
The procedures for estimating totals, averages and proportions for the whole survey population and
domains using weights are described below for qualitative and quantitative data.
The following estimators can be applied to any probability sample design – simple (e.g., SRS, SYS) or
more complex. What is important is that each unit’s final weight correctly account for the sample design.
i. Estimating a population total
For qualitative and quantitative data, the estimate of the total number of units in the survey population is
calculated by adding together the final adjusted weights of the responding units:
∑∈
=
rSi
iwNˆ
where i is the ith
responding unit in the sample and wi is its final adjusted weight and Sr is the set of
responding units.
For quantitative data, the estimate of a total value (such as total expenditure) is the product of the final
weight, wi, and the value, yi, for each responding unit, summed over all responding units:
i
Si
i ywY
r
∑∈
=ˆ
ii. Estimating a population average
For quantitative data, the estimate of an average value in the population is obtained by adding together the
product of the sample value and the weight for each responding unit, and dividing this amount by the sum
of the weights. In other words, the estimate of the average in the population is the estimate of the total
value for quantitative data divided by the estimate of the total number of units in the population.
N
Y
w
yw
Y
r
r
Si
i
i
Si
i
ˆ
ˆ
ˆ
=
=
∑
∑
∈
∈
Note that for SRS or SYS with 100% response rate and no weight adjustments, the estimator reduces to:
n
y
Y
i
Si r
∑∈
=ˆ
144.
SURVEY METHODS ANDPRACTICES
STATISTICS CANADA
132
iii. Estimating a population proportion
For qualitative data, the estimate of the proportion of units in the survey population having a given
characteristic is obtained by adding together the weights for the units having that characteristic, and
dividing this total by the sum of the weights for all respondents. In other words, the estimate of the
proportion in the population is the estimate of the total number of units possessing the given characteristic
divided by the estimate of the total number of units in the population.
N
N
w
w
P
C
Si
i
CSi
i
r
r
ˆ
ˆ
ˆ
=
=
∑
∑
∈
∩∈
where C is the collection of units having the given characteristic.
iv. Estimating for domains of the population
Estimates may be required for domains such as age group, type of dwelling, size of household, or class of
income.
- The size of the population for a domain of interest for either qualitative or quantitative data is
estimated as follows:
∑∩∈
=
domainSi
idomain
r
wNˆ
- The estimate of a domain total for quantitative data is:
∑∩∈
=
domainSi
iidomain
r
ywYˆ
- The estimate of a domain average for quantitative data is:
domain
domain
domainSi
i
domainSi
ii
domain
N
Y
w
yw
Y
r
r
ˆ
ˆ
ˆ
=
=
∑
∑
∩∈
∩∈
145.
ESTIMATION
STATISTICS CANADA
133
- Theestimate of a domain proportion for qualitative or quantitative data is:
domain
Cdomain
domainSi
i
CdomainSi
i
domain
N
N
w
w
P
r
r
ˆ
ˆ
ˆ
∩
∩∈
∩∩∈
=
=
∑
∑
These estimation procedures are illustrated in the following sections.
7.2.2 Estimating Totals, Averages and Proportions
The correct use of the final weights in the estimation process is crucial in the production of estimates.
Example 7.6: Estimation When Final Weights are Unequal, SRS
A survey is conducted to provide information on a population of farms. A sample of n=10 farms is
selected using a stratified sample design. All 10 farms respond and no weight adjustments are performed,
so the final estimation weight is equal to the design weight. Estimates need to be produced from the
following data file:
Stratum Final Weight Type of Farm Income $
1 5.67 1 75,000
1 5.67 2 15,000
1 5.67 1 125,000
1 5.67 1 67,000
1 5.67 2 80,000
1 5.67 1 40,000
2 16.5 1 30,000
2 16.5 1 14,000
2 16.5 2 48,000
2 16.5 1 22,000
Type of Farm
1=Crop (N1=34, n1=6)
2=Livestock (N2=66, n2=4)
- The estimated number of farms in the population is:
100
5.165.165.165.1667.567.567.567.567.567.5
ˆ
=
+++++++++=
= ∑∈ rSi
iwN
Note that if the weights had been ignored, then the estimate would have been incorrectly calculated to be
10.
146.
SURVEY METHODS ANDPRACTICES
STATISTICS CANADA
134
- The estimated number of livestock farms is:
28
5.1667.567.5
ˆ
=
++=
= ∑∩∈ livestockSi
ilivestock
r
wN
- The estimated proportion of livestock farms is:
28.0
100
28
ˆ
=
=
=
∑
∑
∈
∩∈
r
r
Si
i
livestockSi
i
w
w
P
- The estimated total income for the entire population of farms is:
340,160,4
22,00016.5.15,0005.6775,0005.67
ˆ
=
×+…+×+×=
= ∑∈
i
Si
i ywY
r
- The estimated average income for the entire population of farms is:
595,41
02.100
340,160,4
ˆ
=
=
=
∑
∑
∈
∈
r
r
Si
i
i
Si
i
w
yw
Y
- The estimated total income for livestock farms is given by:
650,330,1
23,00016.548,0005.6784,0005.67
ˆ
=
×+×+×=
= ∑∩∈
i
livestockSi
ilivestock ywY
r
147.
ESTIMATION
STATISTICS CANADA
135
- Theestimated average income for livestock farms is given by:
796,47
8.27
650,330,1
5.1667.567.5
23,00016.548,0005.6784,0005.67
ˆ
=
=
++
×+×+×
=
=
∑
∑
∩∈
∩∈
livestockSi
i
i
livestockSi
i
livestock
r
r
w
yw
Y
Note that if the sampling weights were ignored, the estimates would be incorrect, as illustrated in the table
below:
Table 7: Comparing Estimates Calculated with and without the Weights
Parameter Correct Estimate, using Weights Incorrect Estimate, Ignoring Weights
N 100 10
livestockN 28 3
P 0.28 0.30
Y $4,160,340 $516,000
Y $41,595 $51,600
livestockY $1,330,650 $155,000
livestockY $47,796 $51,667
It is possible to produce estimates for qualitative data using the techniques usually reserved for
quantitative variables. An indicator variable can be defined for each category of the qualitative variable
that takes the value 1 if the unit belongs to the category and 0 otherwise. The estimate of the total number
of units possessing the characteristic is obtained by calculating the product of the value of the indicator
variable (1 or 0) and the weight for each respondent unit, and then summing over all responding units.
With this approach, the procedures for estimation of qualitative and quantitative data are the same.
7.2.3 Estimation Issues
7.2.3.1 Estimation for Small Domains
Whenever possible, the sample design should take into consideration the domains of interest through
stratification. This will ensure adequate sample size and precision. However, restrictions on sample size
and other design criteria (such as survey frame information) may mean that only a modest number of
strata can be formed, so for some domains, particularly small ones, the sample size may be inadequate.
Inadequate sample size in a domain can pose a problem at estimation. Various techniques are available to
generate estimates in such cases. These include synthetic estimation, composite estimation and others.
These methods usually require correlated information from another source, or the use of good models.
The application of these techniques can become complex and is beyond the scope of this manual. More
information on this advanced topic can be found in Särndal, Swensson and Wretman (1992), Ghosh and
148.
SURVEY METHODS ANDPRACTICES
STATISTICS CANADA
136
Rao (1994), Singh, Gambino and Mantel (1994).
7.2.3.2 Outliers
Barnett and Lewis (1995) define an outlier to be an observation or subset of observations which appears
to be inconsistent with the remainder of the dataset. There are a variety of methods available to reduce
the impact of outliers on the survey estimates. Simply ignoring them can result in a loss in precision;
giving them a weight of one or zero can bias the results. Alternatively, auxiliary information and post-
stratification can be used to ensure that outliers do not contribute an unreasonably large amount to the
estimates. Treatment of outliers will be covered further in Chapter 10 - Processing. More information on
this advanced topic can be found in Kish (1965), Hidiroglou and Srinath (1981).
7.3 Estimating the Sampling Error of Survey Estimates
Estimates produced from a survey are subject to error. In Chapter 3 - Introduction to Survey Design, it
was stated that there are two basic types of error – sampling error and nonsampling errors. Nonsampling
errors often cause bias and are difficult to measure; sampling error causes variability – it measures the
extent to which an estimate from different possible samples of the same size and design, using the same
estimator, differ from one another.
Chapter 6 - Sample Designs explained the importance of having an estimate of the sampling variance at
the design stage in order to compare the statistical efficiency of different sample designs. Chapter 8 -
Sample Size Determination and Allocation shows how an estimate of the sampling variance is used to
determine the size of the sample required to satisfy a given level of precision.
The purpose of this chapter is to illustrate how sampling variance is measured and the importance of
correctly incorporating the sample design. This chapter only presents variance estimators for an estimated
mean or total for an SRS or Stratified SRS, assuming no adjustments to the original design weights.
Variance estimation for a proportion estimated from an SRS and more complex designs (using a design
effect) are presented in Chapter 8 - Sample Size Determination and Allocation.
Each sampling strategy has its own specific formula for estimating sampling variance, at times very
complicated. In order to estimate correctly the sampling variance for a survey with complex data (i.e., for
more complex designs and/or in the presence of weight adjustments), a survey statistician familiar with
this type of problem should be consulted.
The formulas presented in this chapter can be found in any introductory book on sampling theory, for
example, Cochran, 1977 or Lohr, 1999.
7.3.1 Sampling Variance
Mathematically, the sampling variance of an estimate is the average squared deviation about the
estimator’s average value, across all possible samples. Chapter 3 - Introduction to Survey Design listed
the factors affecting the magnitude of the sampling variance:
- the variability of the characteristic of interest in the population;
- the size of the population;
- the response rate;
149.
ESTIMATION
STATISTICS CANADA
137
- thesample design and method of estimation.
The affect of these factors on the sampling variance is illustrated below using the estimator for the
sampling variance of a population average estimated from an SRSWOR with 100% response rate. (See
also Chapter 8 - Sample Size Determination and Allocation.)
The value of each variable, yi, usually varies from one unit to another in the population. The population
variance, σ2
, of all units, yi, in the population is defined as follows:
22 )1(
S
N
N −
=σ
where
∑∈ −
−
=
Ui
i
N
Yy
S
1
)( 2
2
.
and U is the set of units in the population and there are N units in the population.
An unbiased estimator of the population average for an SRSWOR of size n with 100% response rate is:
∑∈
=
rSi
i
n
y
Yˆ
where Sr is the set of respondents in the sample and there are n units in the sample.
The estimate, Yˆ , varies from sample to sample. An expression for the sampling variance of Yˆ for an
SRSWOR of size n is:
n
S
N
n
YVar
2
)1()ˆ( −=
It is clear from the above equation that an estimate for a characteristic with large unit to unit differences –
high variability in the population – has greater sampling variance than that of an estimate for a
characteristic with low population variability. Usually, S2
is unknown and must be estimated (see section
7.3.2.3.).
It is also clear that the size of the population has an impact on the sampling variance: the term f=n/N is
referred to as the sampling fraction and the term (1-f)=1-n/N as the finite population correction factor
(fpc). As the sample size, n, increases the sampling variance decreases and for a census (where n=N)
there is no sampling variance. When the sampling fraction is small (i.e., the sample size is small
compared to the population), the fpc can be ignored. (Cochran, 1977, states that this factor can be ignored
whenever it does not exceed 5% and for many purposes even if it is as high as 10%.) Notice also that
nonresponse increases the sampling variance by effectively decreasing the sample size.
As explained in Chapter 6 - Sample Designs, some sampling strategies are more efficient than others.
For example, stratification and the use of ratio estimators can improve an estimate’s precision.
In the following discussion of sampling variance, it is assumed that the estimator is unbiased. There are,
however, some instances when a biased estimator is preferred (for example, when its precision is much
better than any alternative unbiased estimator). If bias is present for whatever reason – due to a biased
150.
SURVEY METHODS ANDPRACTICES
STATISTICS CANADA
138
estimator or arising from nonsampling error – then the sampling variance formulas presented in the
following sections calculate the mean square error (MSE), which is a measure of sampling variance and
bias. This can lead to problems with confidence intervals, see Chapter 11 -Analysis of Survey Data for
more details.
7.3.1.1 Calculating the True Sampling Variance
The following example illustrates how to calculate the true sampling variance of the estimated average
video expenditure for an SRSWOR of size n=2.
Example 7.7:
The expenditure on video products for a population of 4 households is given below. For an SRSWOR of
size n=2 what is the true sampling variance of the estimated average expenditure?
Table 8: Video Expenditure per Household
Household Video Expenditure ($)
1 10
2 20
3 30
4 40
First, note that the value of the parameter the population average video expenditure is:
25
4
40302010
=
+++
=
= ∑∈Ui
i
N
y
Y
The usual estimator for the estimated average for an SRS is:
∑
∑
∈
∈
=
=
r
r
Si
i
Si
i
y
n
y
Y
2
ˆ
We can calculate the true sampling variance of the estimated average, )ˆ(YVar , for an SRSWOR of size
n=2 by looking at the results of all possible SRSWOR samples of size 2. These are presented in the table
below:
151.
ESTIMATION
STATISTICS CANADA
139
Table 9:Calculating the True Sampling Variance of Yˆ
Sample Units in sample Sample Estimate ($),
Yˆ
)ˆ( YY − 2
)ˆ( YY −
1 (1,2) 15 -10 100
2 (1,3) 20 -5 25
3 (2,3) 25 0 0
4 (1,4) 25 0 0
5 (2,4) 30 5 25
6 (3,4) 35 10 100
Average 25 0 41.7
1. Calculate the average of all possible sample averages:
Y
YYYYYY
Y
=
=
+++++
=
+++++
=
25
6
353025252015
6
ˆˆˆˆˆˆ
ˆ )6()5()4()3()2()1(
Note that the average value of the estimate across all possible samples is equal to the population average,
Y . This is to be expected since the estimator for Yˆ is unbiased.
2. Calculate the difference between each sample’s estimate and the average estimate across all samples
(i.e., YYj −ˆ , for the jth
sample), seen in the fourth column of the table above.
3. Compute the square of these differences (i.e., 2
)ˆ( YYj − ), seen in the fifth column of the table.
4. For the set, J, of all samples in the population, compute the average squared difference:
7.41
6
100250025100
6
)ˆ(
)ˆ(
2
=
+++++
=
−
= ∑∈Jj
j YY
YVar
Therefore, for this population the true sampling variance of the estimated average video expenditures
from an SRSWOR of size n=2 is 7.41)ˆ( =YVar .
The problem with the above approach is that it is not practical to select all possible samples from the
population. One alternative is to select many replicated samples, as mentioned in section 6.2.9 of
Chapter 6 - Sample Designs and in the following section 7.3.4. Alternatively, the equation presented
152.
SURVEY METHODS ANDPRACTICES
STATISTICS CANADA
140
earlier could be used directly:
n
S
N
n
YVar
2
)1()ˆ( −=
where:
7.166
)14(
)2540()2530()2520()2510(
1
)(
2222
2
2
=
−
−+−+−+−
=
−
−
= ∑∈Ui
i
N
Yy
S
Therefore:
7.41
2
7.166
)
4
2
1(
)1()ˆ(
2
=
−=
−=
n
S
N
n
YVar
The problem with the above equation is that unless a census has previously been conducted the population
variability – S2
– is unknown and must be estimated from a single sample. If probability sampling is used,
then the sampling distribution of the estimator can be calculated and the population variance can be
estimated on the basis of a single sample.
For standard sample designs (SRS, stratified sampling, etc.), formulas for 2ˆS can be found in any
sampling theory textbook. When the sample design or the estimation procedure is complex, alternative
methods such as those described in section 7.3.4 have to be used.
For an SRSWOR, it can be shown that an unbiased estimate of the sampling variance of the estimated
mean, Yˆ , is:
n
S
N
n
YraV
2ˆ
)1()ˆ(ˆ −=
where:
∑∈ −
−
=
Si
i
n
yy
S
1
)(ˆ
2
2
and
∑∈
=
Si
i
n
y
y
This formula will be illustrated in section 7.3.2.3.
It can be shown that for an SRSWOR, an unbiased estimate of the sampling variance of the estimated
total, Yˆ , is:
153.
ESTIMATION
STATISTICS CANADA
141
n
S
N
n
NYraVNYNraVYraV
2
22
ˆ
)1()ˆ(ˆ)ˆ(ˆ)ˆ(ˆ −==×=
Forthe sampling variance of an estimated proportion, Pˆ , see Chapter 8 - Sample Size Determination
and Allocation.
7.3.2 Other Measures of Sampling Error
Before illustrating how to estimate sampling variance, other common measures of sampling error will be
presented, such as the:
- standard error;
- coefficient of variation;
- margin of error;
- confidence interval .
These are all related expressions; it is possible to go from one to the other using simple mathematical
operations.
7.3.2.1 Standard Error and Coefficient of Variation
The standard error of an estimator is the square root of its sampling variance. This measure is easier to
interpret since it provides an indication of sampling error using the same scale as the estimate whereas the
variance is based on squared differences.
However, even standard error might be difficult to interpret in terms of ‘How big a standard error is
acceptable?’ What is large depends on the magnitude of the estimate. For example, a standard error of
100 would be considered large for measuring the average weight of people but would not be considered
large for estimating average annual income.
It is more useful in many situations to assess the size of the standard error relative to the estimate of the
characteristic being measured. The coefficient of variation provides such a measure. It is the ratio of the
standard error of the survey estimate to the average value of the estimate itself, across all possible
samples. The coefficient of variation is usually computed as the estimate of the standard error of the
survey estimate to the estimate itself. This relative measure of sampling error is usually expressed as a
percentage (10% instead of 0.1). It is very useful in comparing the precision of sample estimates, where
their sizes or scale differ from one another. However, it is not as useful for estimators of characteristics
whose true value can be zero or negative, including estimates of changes (e.g., the change in average
income since last year).
7.3.2.2 Margin of Error and Confidence Interval
It is common to see the results of a survey reported in a newspaper as follows:
According to a recent survey, 15% of Ottawa residents attend religious services every week. The
results, based on a sample of 1,345 residents, are considered accurate within plus or minus three
percentage points 19 times out of 20.
154.
SURVEY METHODS ANDPRACTICES
STATISTICS CANADA
142
What does this statement mean? It indicates that the true value, the true percentage of people who attend
religious services every week, is likely to be within three percentage points of the estimate (15%). In the
above example, the margin of error is plus or minus three percentage points or simply three percentage
points while the confidence interval is the range 12% to 18%. Margins of error always include a
confidence statement, the level of comfort that is felt about this interval. In this example, the confidence
statement is 19 times out of 20. This means that, if the survey were repeated many times, then 19 times
out of 20 (or 95% of the time), the confidence interval would cover the true population value.
The theory behind the construction of confidence intervals can be described as follows. Suppose that for a
large sample there is an estimate of the population average, Yˆ , and an estimate of its standard error,
)ˆ(ˆ YES . Then, because of the Central Limit Theorem and the normal distribution, the chances are:
- .10 that the absolute error |ˆ| YY − exceeds )ˆ(ˆ65.1 YES× (this corresponds to a 90% confidence
interval);
- .05 that the absolute error |ˆ| YY − exceeds )ˆ(ˆ96.1 YES× (this corresponds to a 95% confidence
interval);
- .01 that the absolute error |ˆ| YY − exceeds )ˆ(ˆ58.2 YES× (this corresponds to a 99% confidence
interval).
These formulas apply to all normally distributed estimators. It should be noted that standard errors are
useful not just for the calculation of confidence intervals but also for inferential data analysis, such as
hypothesis testing (see Chapter 11 - Analysis of Survey Data).
For more details on the theory behind confidence intervals, refer to any book on sampling theory (e.g.,
Cochran (1977), Lohr (1999), Särndal, Swensson and Wretman (1992), Stuart (1968)).
7.3.2.3 Estimating Sampling Variance and Other Measures of Sampling Error for an SRSWOR
The following example illustrates how to estimate measures of sampling error from a single, realised
sample that was obtained using SRSWOR (assuming a 100% response rate and no adjustment for
auxiliary data).
Example 7.8: Estimating the Sampling Variance, Standard Error, Coefficient of Variation, Margin
of Error and Confidence Interval for Yˆ , SRSWOR
An SRSWOR of n=10 persons (100% response rate) is selected from a population of N=500 persons. The
age of each sampled unit is provided in the table below (sorted by age). What is the estimated sampling
variance of the estimated average age? What are the estimated standard error and coefficient of variation?
What are the margin of error and the confidence interval for a confidence level of 95%?
155.
ESTIMATION
STATISTICS CANADA
143
Table 10:Calculating the Estimated Sampling Variance of Yˆ
Person Age of the
Sample unit, yi
)( yyi − 2
)( yyi −
1 21 -13.4 179.56
2 26 -8.4 70.56
3 27 -7.4 54.76
4 32 -2.4 5.76
5 34 -.4 .16
6 37 2.6 6.76
7 38 3.6 12.96
8 40 5.6 31.36
9 42 7.6 57.76
10 47 12.6 158.76
1. Estimate the population average age:
4.34
10
47424038373432272621
ˆ
=
+++++++++
=
= ∑∈ rSi
i
n
y
Y
Therefore the estimated average age is 34.4 years old. Note that for an SRS (with no weight adjustment
factors for nonresponse or auxiliary data), the estimated population average is the simple sample average.
2. The estimated sampling variance of Yˆ for an SRSWOR is:
n
S
N
n
YraV
2ˆ
)1()ˆ(ˆ −=
where 2ˆS is:
3.64
110
76.15876.5736.31...76.5456.7056.179
1
)(ˆ
2
2
=
−
++++++
=
−
−
= ∑∈ rSi
i
n
yy
S
thus:
3.6
10
3.64
)
500
10
1(
ˆ
)1()ˆ(ˆ
2
=
−=
−=
n
S
N
n
YraV
156.
SURVEY METHODS ANDPRACTICES
STATISTICS CANADA
144
Therefore, the estimated sampling variance is 6.3.
3. Estimate the standard error, )ˆ(ˆ YES , and the coefficient of variation, :)ˆ(ˆ YVC
5.2
3.6
)ˆ(ˆ)ˆ(ˆ
=
=
= YraVYES
%3.7
073.0
4.34
5.2
)ˆ(ˆ
)ˆ(ˆ
=
=
=
=
y
YES
YVC
4. Compute the margin of error and the confidence interval with a confidence level of 95%
)3.39,5.29(
9.44.34
)ˆ(ˆ96.1ˆintervalconfidence
9.4
5.296.1
)ˆ(ˆ96.1errorofmargin
=
±=
×±=
=
×=
×=
YESY
YES
Thus, it can be said with 95% confidence that the true population average age lies between 29.5 and 39.3.
(Note that strictly speaking, the correct interpretation is that in repeated sampling, the confidence interval
would contain the true population value on average 95% of the time.)
7.3.2.4 Estimating Sampling Variance for a Stratified SRSWOR
The following illustrates the impact of ignoring the true sample design and simply calculating the
sampling variance using the equation for a simple random sample. The software market offers a wide
array of personal computer data processing and statistical software products; few, not even some claiming
to specialise in survey processing, correctly account for the survey design. A number of reviews of
statistical software have been done over the last ten years; reading a few of them would be a prudent and
wise choice; a list is maintained at http://www.fas.harvard.edu/~stats/survey-soft/survey-soft.html.
Example 7.6 (continued): Estimation of Sampling Variance
If the sample were the result of a simple random sample of size n=10 (100% response rate) from a
population of size N=100, then the following estimates of the mean income and the sampling variance of
the estimated mean income would be obtained.
600,51
ˆ
=
= ∑∈ rSi
i
n
y
Y
157.
ESTIMATION
STATISTICS CANADA
145
(versus 41,595when the sample design is correctly taken into account).
The estimated sampling variance (in 1,000’s) is:
and the standard error is (in 1,000’s) .6.10)ˆ(ˆ)ˆ(ˆ == YESYraV SRSSRS
In order to correctly estimate the sampling variance of the mean from a stratified sample, the estimated
sampling variance within each stratum h must be computed and then the stratum contributions added up
to give the complete estimate (in 1,000’s):
44
4
6.211
66
4
166
6
1406
34
6
134
100
1
ˆ
1
1
)ˆ(ˆ
22
2
2
2
2
=
−+
−=
−= ∑h h
h
h
h
hSTR
n
S
N
n
N
N
YV
and the standard error is (in 1,000’s) )ˆ(ˆ)ˆ(ˆ YESYraV STRSTR = = 6.6.
If the sample design had not been taken into account in the estimated sampling variance and the estimator
for an SRS had been used instead, the sampling variance would have been overestimated. Note that if the
sample design had been a cluster design, the SRS formula would have probably underestimated the true
sampling variance.
7.3.3 Design Effect
The design effect compares the variance of estimators from one sample design to those from an SRS. It is
the ratio of the sampling variance of an estimator under a given design to the sampling variance of an
estimator under SRS of the same sample size.
As mentioned in Chapter 6 - Sample Designs, this measure is often used to compare the efficiency of
estimators from different designs. If the ratio is less than one this indicates that the sample design is more
efficient than SRS; greater than one indicates that the sample design is less efficient than SRS.
For the example presented earlier,
39.0
200,112
000,44
)ˆ(ˆ
)ˆ(ˆ
===
YraV
YraV
deff
SRS
STR
2.112
10
247,1
)
100
10
1(
ˆ
)1()ˆ(ˆ
2
=
−=
−=
n
S
N
n
YraV SRS
158.
SURVEY METHODS ANDPRACTICES
STATISTICS CANADA
146
indicating that stratification greatly improved the precision of the survey’s estimated mean.
Design effects can also be used to provide rough estimates of variance for complex designs. If an estimate
of the design effect is available from a previous survey that used the same sample design, it can be used to
compute the required sample size of a survey (this will be discussed in Chapter 8 - Sample Size
Determination and Allocation).
For more information on design effects, see Kish (1965).
7.3.4 Estimating the Sampling Variance using Replicated Sampling
The variances of simple statistics such as means and totals can be estimated using the previously stated
procedures for simple designs. However, for more complex sample designs or complex estimators (e.g.,
functions of totals) determining the sampling variance formula can be difficult.
There exist alternative methods (besides applying a design effect) whereby the sampling variance can be
estimated for a selected set of sample designs and estimation procedures. One such method is replicated
sampling. In replicated sampling, instead of selecting one sample of size n, k independent samples of the
size n/k are selected. For each of these k samples, an estimate of the characteristic of interest is produced.
The variability among the k sample estimates is then used to estimate the sampling variance. The
estimate, t, of the characteristic of interest is given by the average of the estimates produced for each
sample:
∑∈
=
Kj
j
k
t
t
where K is the set of samples, k is the number of samples and tj is the estimate for the jth
sample.
The estimated sampling variance of t, )(ˆ traV , is given by the expression:
∑∈ −
−
=
Kj
j
kk
tt
traV
)1(
)(
)(ˆ
2
Example 7.9: Estimating the Sampling Variance of Yˆ Using Replicated Sampling, SRS
In Example 7.8, instead of selecting one sample of size n=10 and using the previous equation to estimate
)ˆ()( YVartVar = , two samples of size n=5 are selected. The results are described in the following table:
Table 11: Calculating the Estimated Sampling Variance of Yˆ Using Replicated Sampling
Sample 1 Age of Sample Units Sample 2 Age of sample Units
1 21 1 26
2 27 2 32
3 34 3 37
4 38 4 40
5 42 5 47
Average Age 32.4 36.4
159.
ESTIMATION
STATISTICS CANADA
147
1. Theestimated average age of the population is:
4.34
2
4.364.32
ˆ
ˆ
=
+
=
= ∑∈Kj
j
k
Y
Y
2. The estimated sampling variance of the average age, given by the replicated sampling method is:
4
2
34.4)-(36.434.4)-(32.4
)1(
)ˆˆ(
)ˆ(ˆ
22
2
=
+
=
−
−
= ∑∈Kj
j
kk
YY
YraV
The estimated standard error, )ˆ(ˆ YES , is 2.
Other replication methods such as the Jackknife and the Bootstrap are also frequently used in surveys
with complex data. For a description of these methods, see Rust and Rao (1996), Wolter (1985) or Efron
(1981). For an example of the Jackknife in a household survey with a complex design and estimator, see
Gambino et al (1998). Other techniques not based on replicates such as Taylor series approximation can
also be used when the sample design is complex; see Hidiroglou and Paton (1987), Binder (1996),
Särndal, Swensson and Wretman (1992) and Wolter (1985).
7.4 Summary
The following list provides an overview of the important points to consider in the estimation of survey
data:
i. Estimation must take into account the sample design. To that end, design weights should be
incorporated in the estimation process.
ii. The initial design weights should be adjusted for nonresponse.
iii. Auxiliary information, if of adequate quality and correlated with the main survey variables,
should be used, whenever possible, to improve the consistency and precision of the estimates.
iv. The sample design and sample allocation should be used to meet the requirements of domains of
interest. If this is not possible at the design stage, special estimation methods should be
considered at the estimation stage.
v. Outliers can lead to large sampling variability in the estimates. Outlier detection and treatment
should be considered at estimation.
vi. Survey estimates should include an estimate of their sampling error, in the form of sampling
160.
SURVEY METHODS ANDPRACTICES
STATISTICS CANADA
148
variance, standard error, coefficient of variation, margin of error or confidence interval.
For a discussion of more analytic uses of the data that go beyond the estimation of summary measures see
Chapter 11 - Analysis of Survey Data.
Bibliography
Arora, H.R. and G.J. Brackstone. 1977. An Investigation of the Properties of Raking Ratio Estimators: I,
With Simple Random Sampling. Survey Methodology, 3(1): 62-83.
Bankier, M.D. 1978. An Estimate of the Efficiency of Raking Ratio Estimators under Simple Random
Sampling. Survey Methodology, 4(1): 115-124.
Barnett, V. and T. Lewis. 1995, Outliers in Statistical Data. John Wiley and Sons, Chichester.
Binder, D.A. 1983. On the Variance of Asymptotically Normal Estimators from Complex Surveys.
International Statistical Review, 51: 279-292.
Binder, D.A. 1996. Linearization Methods for Single Phase and Two-Phase Samples: A Cookbook
Approach. Survey Methodology, 22(1): 17-22.
Binder, D.A. 1998. Estimating the Variance of Raking Ratio Estimators. Canadian Journal of Statistics,
16: 47-55.
Brackstone, G. and J.N.K. Rao. 1979. An Investigation of Raking Ratio Estimators. Sankhyà, Series C,
42: 97-114.
Chambers, R.L. 1986. Outlier Robust Finite Population Estimation. Journal of the American Statistical
Association, 81: 1063-1069.
Cochran, W.G. 1977. Sampling Techniques. John Wiley and Sons, New York.
Cox, B.G., D.A. Binder, B.N. Chinnappa, A. Christianson, M.J. Colledge and P.S. Kott, eds. 1995.
Business Survey Methods. John Wiley and Sons, New York.
Deming, W.E. and F.F. Stephan. 1940. On the least squares adjustment of a sampled frequency table
when the expected marginal totals are known. Annals of Mathematical Statistics, 11: 427-444.
Deville, J.C. and C.E. Särndal. 1992. Calibration estimators in survey sampling. Journal of the American
Statistical Association, 87: 376-382.
Efron, B. 1981. The Jackknife, the Bootstrap and Other Resampling Plans. SIAM. 38. Philadelphia.
Eltinge, J.L. and I.S. Yansaneh. 1997. Diagnostics for Formation of Nonresponse Adjustment Cells, with
an Application to Income Nonresponse in the U.S. Consumer Expenditure Survey. Survey
Methodology, 23(1): 33-40.
Estevao, V., M.A. Hidiroglou and C.E. Särndal. 1995. Methodological Principles for a Generalized
Estimation System at Statistics Canada. Journal of Official Statistics, 11: 181-204.
161.
ESTIMATION
STATISTICS CANADA
149
Fink, A.1995. The Survey Kit. Sage Publications, California.
Fowler, F.J. 1984. Survey Research Methods. 1. Sage Publications, California.
Gambino, J.G., M.P. Singh, J. Dufour, B. Kennedy and J. Lindeyer. 1998. Methodology of the Canadian
Labour Force Survey. Statistics Canada. 71-526.
Ghosh, M. and J.N.K. Rao. 1994. Small Area Estimation: An Appraisal. Statistical Science, 9: 55-93.
Groves, R. and M.P. Couper. 1998. Nonresponse in Household Interview Surveys. John Wiley and Sons,
New York.
Hidiroglou, M.A. and D.G. Paton. 1987. Some Experiences in Computing Estimates and their Variances
Using Data from Complex Survey Designs. In Applied Probability, Stochastic Processes, and
Sampling Theory. I.B. MacNeill and G.J. Umphrey, eds. D. Riedel Publishing.
Hidiroglou, M.A. and C.-E. Särndal. 1998. Use of Auxiliary Information for Two-phase Sampling. Survey
Methodology, 24(1): 11-20.
Hidiroglou, M.A. and K.P. Srinath. 1981. Some Estimators of Population Total Containing Large Units.
Journal of the American Statistical Association, 47: 663-685.
Holt, D. and T.M.F. Smith. 1979. Post-Stratification. Journal of the Royal Statistical Society, A, 142: 33-
46.
Kalton, G. and D. Kasprzyk. 1986. The Treatment of Missing Survey Data. Survey Methodology, 12(1):
1-16.
Kish, L. 1965. Survey Sampling. John Wiley and Sons, New York.
Kovar, J.G., J.N.K. Rao and C.F.J. Wu. 1988. Bootstrap and Other Methods to Measure Error in Survey
Estimates. Canadian Journal of Statistics,16, Supplement: 25-45.
Lehtonen, R. and E.J. Pahkinen. 1995. Practical Methods for Design and Analysis of Complex Surveys.
John Wiley and Sons, New York.
Levy, P. and S. Lemeshow. 1999. Sampling of Populations, John Wiley and Sons, New York.
Lohr, Sharon. 1999. Sampling: Design and Analysis. Duxbury Press, U.S.A.
Madow, W.G., H. Nisselson, I. Olkin and D.B. Rubin, eds. 1983. Incomplete Data in Sample Surveys,
Volume 1. Academic Press, New York.
Madow, W.G., I. Olkin and D.B. Rubin, eds. 1983. Incomplete Data in Sample Surveys, Volume 2.
Academic Press, New York.
Madow, W.G. and I. Olkin, eds. 1983. Incomplete Data in Sample Surveys, Volume 3. Academic Press,
New York.
Moser, C.A. and G. Kalton. 1971. Survey Methods in Social Investigation. Heinemann Educational Books
Limited, London.
162.
SURVEY METHODS ANDPRACTICES
STATISTICS CANADA
150
Platek, R., J.N.K. Rao, C.E. Särndal and M.P. Singh, eds. 1987. Small Area Statistics. John Wiley and
Sons, New York.
Pollock, K.H., S.C. Turner and C.A. Brown. 1994. Use of Capture-Recapture Techniques to Estimate
Population Size and Population Totals When a Complete Frame is Unavailable. Survey
Methodology, 20(2): 117-124.
Rancourt, E., H. Lee and C.E. Särndal. 1993. Variance Estimation Under More than One Imputation
Method. Proceedings of the International Conference on Establishment Surveys. American
Statistical Association. 374-379.
Rao, J.N.K. and C.F.J. Wu. 1988. Resampling Inference with Complex Survey Data. Journal of the
American Staistical Association, 83: 231-241.
Rao, J.N.K. 1996. On the Estimation with Imputed Survey Data. Journal of the American Statistical
Association, 91: 499-506.
Rao, J.N.K, C.F.J. Wu and K. Yue. 1992. Some Recent Work on Resampling Methods for Complex
Surveys. Survey Methodology, 18(2): 209-217.
Rust, K.F. and J.N.K. Rao. 1996. Variance Estimation for Complex Surveys using Replication
Techniques. Statistical Methods in Medical Research, 5: 283-310.
Särndal, C.E., B. Swensson and J. Wretman. 1992. Model Assisted Survey Sampling. Springer-Verlag,
New York.
Satin, A. and W. Shastry. 1993. Survey Sampling: A Non-Mathematical Guide – Second Edition.
Statistics Canada. 12-602E.
Schnell, D., W.J. Kennedy, G. Sullivan, H.J. Park and W.A. Fuller. 1988. Personal Computer Variance
Software for Complex Surveys. Survey Methodology, 14(1): 59-69.
Singh, A.C. 1996. Combining Information in Survey Sampling by Modified Regression. Proceedings of
the Section on Survey Research Methods. American Statistical Association. 120-129.
Singh, M.P., J. Gambino and H.J. Mantel. 1994. Issues and Strategies for Small Area Data. Survey
Methodology, 20(1): 3-22.
Skinner, C.K., D. Holt and T.M.F. Smith. 1989. Analysis of Complex Surveys. John Wiley and Sons,
Chichester.
Stuart, A. 1968. Basic Ideas of Scientific Sampling. Charles Griffin and Company Limited, London.
Thompson, M. 1997. Theory of Sample Surveys. Chapman and Hill, United Kingdom.
Thompson, S.K. 1992. Sampling. John Wiley and Sons, New York
Wolter, K.M. 1985. Introduction to Variance Estimation. Springer-Verlag, New York.
Yung, W. and J.N.K. Rao. 1996. Jackknife Linearization Estimation Variance Estimators under Stratified
Multistage Sampling. Survey Methodology, 22(1): 23-31.
163.
STATISTICS CANADA
151
Chapter 8- Sample Size Determination and Allocation
8.0 Introduction
One of the questions most frequently asked of a statistician is: How big should the sample be? Managers
are anxious to obtain an answer to this fundamental question during the planning phase of the survey
since it impacts directly on operational considerations such as the number of interviewers required.
There is no magical solution and no perfect recipe for determining sample size. It is rather a process of
compromise in which the precision requirements of the estimates are weighed against various operational
constraints such as available budget, resources and time.
Recall that factors affecting precision (presented in Chapter 7 - Estimation) include: the variability of
the population, the size of the population, the sample design and estimator and the response rate. The
formula to calculate the size of the sample needed to satisfy a specific level of precision must take into
account these factors.
In addition to these factors, operational constraints influence the size of the sample. Sometimes, these are
the most influential factors. How large a sample can the client afford? How much time is available to
conduct the entire survey? How many interviewers are available? While these constraints are often
excluded from the sample size formula, they must be taken into consideration.
If a stratified sample design is used, the statistical agency will need to know not just how big the total
sample should be, but how it should be distributed across the strata. This is called sample allocation. Two
strategies are possible. The first is to determine the total sample size and then allocate it across the strata.
The second is to set a precision requirement and determine the sample size required in each stratum.
Many different allocation methods are possible. N-proportional allocation results in the same proportion
of population units being sampled in each stratum. Disproportional allocation results in strata being
sampled at different rates. Disproportional allocation methods include: Y-proportional, N -proportional,
Y -proportional, optimum, Neyman and optimum when variances are equal.
The purpose of this chapter is to illustrate how to calculate the sample size given a target level of
precision, how to allocate a stratified sample and guidance regarding which method of allocation is most
suitable.
8.1 Sample Size Determination
As explained in Chapter 7 - Estimation, the precision of the survey estimates and the sample size are
interrelated: since the sampling variance decreases as the sample size increases, the greater the precision
required of the estimates, the larger the sample size needed. Therefore, the appropriate sample size
depends on the desired precision of the survey estimates. This precision of an estimate, t, may be
expressed in terms of the allowable standard error, SE(t), the margin of error, )(tSEz × , or the
coefficient of variation ttSE /)( . The determination of the sample size for a survey often includes the
specification of desired precision in terms of one or more of these measures.
164.
SURVEY METHODS ANDPRACTICES
STATISTICS CANADA
152
Note that sample size determination attempts to control for sampling errors and for nonresponse that
occurs randomly. It does not attempt to control for other nonsampling errors. To ensure accurate survey
results, bias due to non-sampling errors should be minimised wherever possible (see Chapter 5 -
Questionnaire Design and Chapter 3 - Introduction to Survey Design for more details on non-
sampling errors).
Before presenting the formulas to calculate the sample size for a given level of precision, this chapter will
discuss how to determine what level of precision is appropriate and factors affecting precision.
8.1.1 Precision Requirement Considerations
The statistical agency should consider several pertinent questions before deciding on the appropriate level
of precision for the client’s survey estimates. The agency and client should review what is required of the
survey estimates with respect to data tabulations and analysis and decisions that will be made based on
the survey estimates.
i. How will the survey estimates be used? How much sampling variance is acceptable in the survey
estimates?
How much uncertainty can the client tolerate in the survey estimates? For example, is a margin of error of
±6% with 95% confidence suitable for the client’s purposes, or are more (or less) precise estimates
necessary to satisfy the survey objectives?
If the survey results are to be used to make important decisions that have important implications or
involve significant risk, the client may require more precise survey estimates than if he or she simply
wishes to get a rough estimate of the characteristic of interest.
ii. Are estimates required for subgroups (domains) of the survey population?
The survey results may include estimates for many subgroups or domains. For example, in addition to
producing survey estimates at the national level, provincial or sub-provincial estimates may be required,
or estimates may be needed for other important subgroups in the survey population based on sex, age,
education level, etc. An appropriate precision level should be specified to meet these data requirement
needs. A different level of precision may be specified for different domains. For example, in a national
survey, the survey sponsor may require a ±3% margin of error for all national estimates, but may be
satisfied with a margin of error of ±5% for provincial estimates, and a margin of error of ±10% for sub-
provincial estimates. In this case, strata are usually formed for each domain of interest.
iii. How big is the sampling variance relative to the survey estimate?
Precision requirements should be specified after considering the size of the estimate. For example, say
because of a new policy, Federal government offices are required to provide service in a minority official
language if at least P=.05 (or 5%) of their requests are in that language. Suppose that various government
offices decide to conduct a survey of their clientele in order to estimate the demand for service in a
minority official language. Intuitively, a margin of error of ±.05 seems high in relation to a survey
estimate expected to be around .05. In this case, a smaller margin of error, perhaps no greater than ±.01 or
±.02, should be specified (i.e., the confidence interval should be .05 ± .01 or .05 ± .02).
In fact, the client should consider the size of the smallest required estimate when specifying the precision
requirements. Suppose that the survey is estimating proportions. Some of these proportions might be
165.
SAMPLE SIZE DETERMINATIONAND ALLOCATION
STATISTICS CANADA
153
50.=P or higher, but others might be as low as 05.=P or 10.=P . If the smallest proportion to be
estimated is expected to be 05.=P and this proportion is important to the objectives of the survey, then
the statistical agency (and client) will want the margin of error to be less than .05.
iv. What are the practical implications of the precision requirement? How much precision is to be
gained by increasing the sample size?
Precision improves as the sample size increases. However, the gain in precision is not directly
proportional to the increase in sample size. Consider a qualitative variable that has two possible
categories, A and B (e.g., men and women), and the client is interested in estimating the proportion of the
population that falls under category A.
Table 1 illustrates the resulting margin of error in the estimated proportion for a simple random sample
(SRS) for various sample sizes and a 95% confidence level, where the true proportion of the population
falling into category A is P=.5 (or 50%) and the size of the population is N=100,000. (See section 8.1.3
for the formula for the sampling variance of an estimated proportion.)
Table 1: Sample Size and Margin of Error in Estimate of P, using SRS, when P=.5
Sample Size Margin of Error
50 .139
100 ±.098
500 ±.044
1,000 ±.031
Note that in the above table, when the sample size doubles from 50 to 100, the margin of error of the
estimate of the proportion improves from ±.139 to ±.098. However, the margin of error is not halved to
±.070 as might be expected. Nor does doubling the sample size from 500 to 1,000 reduce the margin of
error by half. Although most people seem to expect one, there is not a linear relationship between the
sample size and the margin of error.
This example points out that the statistical agency and client must decide whether it is worth the effort
and resources required to interview 1,000 people rather than 500 people to improve the precision from a
margin of error of ±.045 to a margin of error of ±.032.
The best solution may not always be to choose the largest possible sample size yielding the smallest
margin of error. Sometimes, suitably accurate results can be obtained by accepting a larger margin of
error and using resources more efficiently. It may be more effective to use the cost savings from a smaller
sample size on other factors that affect the accuracy of the survey results, such as reducing nonsampling
error (e.g., follow-up of nonrespondents, testing the questionnaire, training interviewers, etc.).
8.1.2 Factors Affecting Precision
Chapter 3 - Introduction to Survey Design and Chapter 7 - Estimation presented the various factors
affecting precision. This section illustrates the impact of these factors and considerations when
determining the sample size for a given level of precision.
166.
SURVEY METHODS ANDPRACTICES
STATISTICS CANADA
154
8.1.2.1 Variability in the Population
The characteristic, or variable of interest, typically differs from one person, household, business, farm,
etc. to another in a survey population. Although this variability cannot be controlled, its magnitude affects
the sample size necessary to satisfy a given level of precision for a characteristic of interest.
Consider Table 2 below. Suppose a first-time survey seeks to estimate the proportion of customers who
are satisfied with the services of a certain enterprise and that only two values are possible for the variable
customer satisfaction: satisfied or dissatisfied. Some possible values for the true proportion of satisfied
and dissatisfied customers are listed below:
Table 2: For the True Population, Possible Distribution of Customer Satisfaction
1. 100 % Satisfied 0 % Dissatisfied
2. 90 % Satisfied 10 % Dissatisfied
3. 80 % Satisfied 20 % Dissatisfied
4. 70 % Satisfied 30 % Dissatisfied
5. 60 % Satisfied 40 % Dissatisfied
6. 50 % Satisfied 50 % Dissatisfied
7. 40 % Satisfied 60 % Dissatisfied
8. 30 % Satisfied 70 % Dissatisfied
9. 20 % Satisfied 80 % Dissatisfied
10. 10 % Satisfied 90 % Dissatisfied
11. 0 % Satisfied 100 % Dissatisfied
With respect to the variability of customer satisfaction in the population, numbers 1 and 11 from the
above list of possibilities are the same, that is, there is no variability – all customers have the same
opinion. As well, numbers 2 and 10 from the list reflect very little variability, with 90% of customers
having one opinion and only 10% of customers having the opposite opinion. Similarly, each of the
following sets of numbers – 3 and 9, 4 and 8, and 5 and 7 – has the same variability. Proceeding from
numbers 1 to 6, or similarly, from numbers 11 to 6, the variability of the characteristic customer
satisfaction increases. The situation represented by number 6, that is, a 50-50 split, where 50% of
customers are satisfied and 50% of customers are dissatisfied, is the point of maximum variability in the
population with respect to customer satisfaction. If it were true that all customers were satisfied with the
services provided, then there would be no variability with respect to customer satisfaction, so a sample of
just one customer would provide a reliable estimate of customer satisfaction. However, as the true
variability of a characteristic of interest increases in the survey population, so too must the sample size to
provide an estimate of this characteristic with good precision.
It is difficult to measure accurately characteristics that have high degrees of variability. Increasingly
larger sample sizes are required to provide precise estimates of such variables. Considering the precision
of the estimates, the required sample size is largest when the variability of the characteristic of interest is
at its maximum. For a characteristic with only two values, this occurs when there is a 50-50 split in the
population. Therefore, to determine the sample size required for a survey, an estimate of the variability of
a characteristic in the survey population is first required since the true variability is generally not known
in advance. This can be obtained from a previous study on the same subject, or from a pilot survey.
If, once the survey has been conducted, the statistical agency realises that the characteristic of interest
varies more than expected at the point of sample size determination, the survey estimates will be less
precise than expected. Conversely, if there is less variability in the characteristic of interest than expected,
then the required sample size will be overestimated and the survey estimates will be more precise than
required. To ensure that a survey’s precision requirement is achieved, it is usually recommended that a
167.
SAMPLE SIZE DETERMINATIONAND ALLOCATION
STATISTICS CANADA
155
conservative estimate of the population variability of a characteristic be used when calculating the
required sample size. In other words, in practice, when there is no advance knowledge of the variability of
the characteristic to be measured in the survey, it is often a good idea to assume the greatest variability.
So, for a variable with only two possible values, a 50-50 split in the population should be assumed.
Sample surveys usually measure more than one characteristic, each with differing variability. A sample
that is large enough for one characteristic may not be large enough for another that has greater variability.
To ensure that the sample size is large enough for the key characteristics, the sample size should be
determined for the characteristic that is thought to have the highest variability, or for the one(s) deemed to
be most important.
8.1.2.2 Size of the Population
The role played by the size of the survey population in sample size determination differs with the size of
the population. It plays an important role for small populations, a moderately important role for medium-
size populations and a minor role for large populations.
For example, using the customer satisfaction survey, say the true proportion of satisfied customers is P=.5
(50%). Suppose that the statistical agency intends to sample the population using an SRS and that for the
estimate of P it wants a margin of error of ±.05 with a confidence level of 95% (i.e., a confidence interval
of .50±.05). Table 3 and Chart 1 show the required sample size for different population sizes.
Table 3: Sample Size Required to Estimate P with a Margin of Error of .05 and a 95%
Confidence Level, using SRS, when P=.5
Population Size Required Sample Size
50 44
100 80
500 222
1,000 286
5,000 370
10,000 385
100,000 398
1,000,000 400
10,000,000 400
It can be seen that to satisfy the required level of precision, the sample size increases at a diminishing rate
as the size of the population increases. Although the statistical agency would require a sample size of 44
completed questionnaires for a population of 50, it does not need to double the sample size to 88 for a
survey population of twice the size. The required sample size quickly approaches n=400 for survey
populations of N=5,000 and more. Therefore, for an SRS, 400 completed questionnaires would be enough
to satisfy the given precision requirements for populations larger than 5,000, when the true population
proportion is P=0.5.
For very small populations, often a substantial proportion of the population must be surveyed in order to
achieve the desired precision. This is why, in practice, censuses are often conducted for small
populations.
168.
SURVEY METHODS ANDPRACTICES
STATISTICS CANADA
156
Chart 1: Sample Size Required to Estimate P with a Margin of Error of .05 and a 95% Confidence
Level, using SRS, when P=.5
0
50
100
150
200
250
300
350
400
0 1 000 2 000 3 000 4 000 5 000
Population Size, N
Required
Sample, n
8.1.2.3 Sample Design and Estimator
The sampling strategy – the sample design and estimator used – affect the precision. Techniques for
calculating the sample size for a given level of precision often use the sampling variance formula for a
SRS. As discussed in Chapter 6 - Sample Designs and Chapter 7 - Estimation, more complex sample
designs using the same estimator and equivalent sample size may have more or less precise estimates. So,
if the sample size formula assumes SRS an adjustment is required in order to take into effect the sample
design.
In general, when the formula to calculate sample size assumes SRS, but a more complex sample design is
used, the sample size required to satisfy a given level of precision should be multiplied by a factor called
the design effect (deff). Recall from Chapter 7 - Estimation that the design effect is the ratio of the
sampling variance of an estimator under a given design to the sampling variance of an estimator under
SRS of the same sample size. Therefore, for a simple random sample design, deff = 1, and usually deff ≤
1 for a stratified sample design and deff ≥ 1 for a cluster sample design.
It is usually possible to obtain an estimate of the design effect for the main survey variables from a
previous survey that used the same, or very similar, sample design and similar subject matter. Another
option is to obtain the design effect from a pilot survey. If the statistical agency plans to use a stratified
sample design and there is no suitable advance estimate of the design effect available from a previous
survey, deff = 1 can be used to calculate the sample size (i.e., assume SRS). The resulting precision of the
survey estimates should be no worse than that obtained with a simple random sample, and if stratification
is effective, the precision will be better. It is much more difficult to decide what the design effect should
be when a cluster sample design is planned and there is no prior knowledge of the effect of clustering on
the sampling variance. In this case, a design effect of at least 2 might be used, although the design effect
of a highly clustered design may be as high as 6 or 7.
169.
SAMPLE SIZE DETERMINATIONAND ALLOCATION
STATISTICS CANADA
157
8.1.2.4 Survey Response Rate
To achieve the desired precision for the survey estimates, the statistical agency needs to adjust the sample
size for the anticipated response rate. This is done by selecting a larger sample based on an expected
response rate estimated from similar surveys or a pilot survey on the same population.
For example, if the initial sample size is calculated to be 400 and a response rate of 75% is expected, then
the statistical agency should select a sample of:
533
75.
400
=
=n
Once the statistical agency and client have decided upon a certain expected response rate, the agency
needs to do everything possible to achieve at least this response rate. Failure to achieve the expected
response rate will affect the precision of the survey results. A lower response rate will result in a smaller
sample size than necessary to achieve the precision requirement, on the other hand, a higher response rate
will have the opposite effect.
Note that this adjustment is based on the assumption that the units are missing at random, i.e., that the
nonrespondents have similar characteristics as the respondents. In order to deal appropriately with total
nonresponse, simply increasing the sample size is inadequate. Potential bias could still result if the
nonrespondents differ from the respondents with respect to the characteristics of interest in the survey.
(See Chapter 7 - Estimation and Chapter 10 - Processing for ways to deal with nonresponse bias).
8.1.3 Sample Size Formulas
The following formulas can be used to calculate the sample size required to provide a given level of
precision for an estimated average or proportion.
i. Precision of an Estimated Average, Yˆ , for a Simple Random Sample (100% Response)
The margin of error and the formula for the standard error of the estimate for an SRS is often used to
determine the sample size. The expression for the estimated standard error of an estimated average, Yˆ ,
for an SRS without replacement is:
n
S
N
n
YES
ˆ
)1()ˆ(ˆ −= (1)
where Sˆ is an estimate of the square root of the population variance of yi (see also Chapter 7 -
Estimation).
Setting the required margin of error to e, then:
n
S
N
n
ze
ˆ
)1( −= (2)
where z depends on the level of confidence.
170.
SURVEY METHODS ANDPRACTICES
STATISTICS CANADA
158
Solving for n, yields:
N
Sz
e
Sz
n 22
2
22
ˆ
ˆ
+
= (3)
Therefore, in order to determine n, the following are required:
- a desired margin of error, e;
- a value corresponding to a desired level of confidence, z;
- the size of the population, N;
- an estimate of the population variability, 2ˆS .
The latter is the hardest to obtain and is often approximated using previous studies on a similar
population. (It is also possible to calculate the required sample size based on a given coefficient of
variation. This is discussed in section 8.2.1.2 for an estimated total from a Stratified SRS.)
ii. Precision of an Estimated Proportion, Pˆ , for a Simple Random Sample (100% Response)
In this case, the required precision will be specified in terms of the margin of error and the characteristic
of interest will be the proportion of the population, P, falling in one of two categories. It is known that for
large populations, the estimated proportion, Pˆ , is approximately normally distributed and the population
variability of the binary characteristic, yi, can be estimated as follows:
)ˆ1(ˆˆ2
PPS −=
So equation (3) becomes:
N
PPz
e
PPz
n
)ˆ1(ˆ
)ˆ1(ˆ
2
2
2
−
+
−
=
If, prior to the survey, a good estimate of the proportion, Pˆ , is available, then it should be used in the
above equation. Otherwise, if nothing is known about the population, 5.ˆ =P may be used, which yields
the maximum sample size given the other assumptions.
In the following section, it will be shown that if the sample design is not an SRS, an estimate of the
design effect is also required and if the response rate to the survey is less than 100%, an estimate of the
response rate, r, is required.
iii. Step by Step Approach for Sample Size Determination, Given the Precision of an Estimated
Proportion, Pˆ , for any Sample Design (When the Response Rate is <100%)
In the following examples, a step by step approach to calculating the sample size will be used, where first
an initial sample size is calculated, then it is adjusted for the size of the population, the design effect and
the response rate.
171.
SAMPLE SIZE DETERMINATIONAND ALLOCATION
STATISTICS CANADA
159
1. Initial Sample Size
Note that equation (1) uses the finite population correction factor, (1-n/N), to correct for the size of the
population. If this factor is ignored, a preliminary estimate of the sample size, n1, can be obtained by
simply using:
2
2
1
)ˆ1(ˆ
e
PPz
n
−
=
Note that, the formula for n1 also holds if e and Pˆ are all expressed as percentages instead of proportions.
2. Adjust for the size of the population using the following equation (remember that this only has an
effect for small and moderate sized populations):
1
12
nN
N
nn
+
=
3. If the sample design is not a simple random sample, the following formula can be used to adjust the
sample size for the effect of the sample design:
23 ndeffn ×=
where deff is the design effect and usually:
- deff = 1 for simple random sampling designs;
- deff < 1 for stratified sampling designs;
- deff > 1 for cluster or multi-stage sample designs.
4. Finally, adjust for response to determine the final sample size, n:
r
n
n 3
=
where r is the expected response rate.
8.1.3.1 Examples of Sample Size Determination
The following examples illustrate the step-by-step approach to calculating sample size.
Example 8.1: SRS
A magazine publisher wants to obtain an estimate of the overall satisfaction of the readers of the
magazine. While it would be possible to contact all 2,500 subscribers through a mail-out survey, because
of time restrictions, the publisher has decided to interview a simple random sample by telephone. How
many readers should be interviewed?
Assumptions for this example include:
- the publisher will be satisfied if the true population proportion is within ±.10 of the estimated
population proportion based on the sample results, i.e., the required margin of error, e, is .10;
172.
SURVEY METHODS ANDPRACTICES
STATISTICS CANADA
160
- the publisher wishes to have a level of confidence of 95% in the survey estimates (this means there
would only be a 1 in 20 chance of getting a sample that produces an estimate outside the range
10.ˆ ±P , therefore, z=1.96.);
- SRS will be used;
- a response rate of approximately 65% is expected, so r=.65;
- there is no advance estimate of Pˆ , the level of customer satisfaction, consequently, 5.ˆ =P is
assumed.
The required sample size is calculated as follows:
1. Calculate the initial sample size, n1:
96
)10(.
)50)(.50(.)96.1(
)ˆ1(ˆ
2
2
2
2
1
=
=
−
=
e
PPz
n
2. Adjust the sample size to account for the size of the population:
92
)962500(
2500
96
1
12
=
+
=
+
=
nN
N
nn
3. Adjust the sample size for the effect of the sample design:
92
2
23
=
=
×=
n
ndeffn
For this example, deff = 1 since it is assumed that an SRS will be used.
4. Adjust for response to determine the final sample size, n:
142
65.
92
3
=
=
=
r
n
n
Note that if a response rate of at least 65% is not achieved when the survey is conducted, the final sample
size will be smaller than planned, and therefore, the survey estimates may be less precise than the
planning requirement. If a higher response rate is realised, the resulting sample will be larger than
anticipated, and survey estimates may be more precise.
173.
SAMPLE SIZE DETERMINATIONAND ALLOCATION
STATISTICS CANADA
161
Following these steps, the publisher should draw an SRS of 142 of the 2,500 subscribers in order to
estimate the readership’s level of satisfaction with the magazine with a margin of error of .10 at a 95%
confidence level, given an expected response rate of 65%.
Example 8.2: Stratified SRS
A public opinion survey is to be conducted to determine the proportion of the population in favour of
establishing a new provincial park. The population consists of all adults living in two cities and one rural
area. A simple random sample of adults from each city and another simple random sample from the rural
area will be selected. The required sample size in each stratum must be determined.
The population size is 657,500 with the following breakdown:
Table 4: Population with Three Strata
H Stratum Population (Nh)
1 City 1 400,000
2 City 2 250,000
3 Rural area 7,500
Total 657,500
The required sample size depends on the specific data requirements of the survey. The following two
options can be considered.
Option 1: Margin of Error for Estimates of the Whole Population
Suppose that precise estimates for the individual strata are not required. An estimate with a margin of
error of ± .05 at a 95% confidence level for the area as a whole is sufficient. A preliminary estimate of
the proportion is unavailable, so 5.ˆ =P is assumed. A response rate of 50% is expected.
1. Calculate the initial sample size, n1:
384
)05(.
)50)(.50(.)96.1(
)ˆ1(ˆ
2
2
2
2
1
=
=
−
=
e
PPz
n
2. Calculate the modified sample size, n2:
384
384500,657
500,657
384
1
12
=
+
=
+
=
nN
N
nn
(Note: If n1/N is negligible, then it can be assumed that 12 nn = )
174.
SURVEY METHODS ANDPRACTICES
STATISTICS CANADA
162
3. Adjust for the design effect:
384
2
23
=
=
×=
n
ndeffn
For stratified random sampling, usually deff < 1. Here, no estimate of deff is available, so setting deff = 1
should have the effect of producing a more conservative (i.e., larger) sample size estimate.
4. Adjust for response to determine the final sample size, n:
768
50.
384
3
=
=
=
r
n
n
The required sample size is 768. See section 8.2 to determine how the 768 sampled units can be
distributed across the three strata.
Option 2: Margin of Error for each Stratum Estimate
Suppose that the client requires results with a ±.05 margin of error at a 95% confidence level for each
stratum. Now, individual sample size calculations for each of the strata are required (i.e., each stratum is
treated as a population in its own right).
Note that Cities 1 and 2 have large populations and therefore their population size can be expected to have
no influence on the sample size. Consequently, if the same assumptions as above are made, the sample
size in each of these two strata is 768. However, for the rural area, the smaller population can be expected
to have an impact on the sample size.
Rural area:
732
50.
366
366
366
384500,7
500,7
384
384
)05(.
)50)(.50(.)96.1()ˆ1(ˆ
3
3
1
12
2
2
2
2
1
===
=
=
+
=
+
=
==
−
=
r
n
n
n
nN
N
nn
e
PPz
n
Therefore, the total sample size is 768 (City 1) + 768 (City 2) + 732 (rural) = 2,268.
Comparing Options 1 and 2, the total sample size of 2,268 for Option 2 is almost three times greater than
the sample size of 768 for Option 1. In other words, if only an estimate for the total population across all
strata is required, the sample size requirement is less than if precise estimates by stratum are required,
since then adequate sample sizes in each stratum are required.
175.
SAMPLE SIZE DETERMINATIONAND ALLOCATION
STATISTICS CANADA
163
This example clearly illustrates the importance of examining the precision requirements for each separate
domain. If many domains are required, the impact on the total sample size can be significant, and may
even lead to a sample size that goes beyond the client’s budget and operational resources. In general, the
more domain estimates are required, the bigger is the required sample size. Compromises, therefore, may
have to be made to ensure that acceptable levels of error are obtained. This can be done by increasing the
tolerable levels of error in each stratum or by combining two or more domains. For more on this topic, see
section 8.2.2.2.
8.1.4 Cost, Time and Operational Constraints
Thus far, only one aspect of sample size has been addressed – the sample size needed to obtain a specific
level of precision for the most important survey estimates. In practice, time, cost and other operational
restrictions are also paramount.
In many surveys, funds are allocated and deadlines are set even before the specifics of the survey have
been decided. It may turn out that the sample size required to carry out a survey is larger than existing
funds can accommodate. If more money cannot be found, the sample size may have to be reduced,
thereby lowering the precision of the estimates. Or some domain estimates may be dropped. The same
holds true for time considerations. If the time allowed is not sufficient, the size and scale of the survey
may have to be limited to accommodate the deadlines.
Operational constraints imposed by the method used to collect data, the availability of field staff, the
availability of coding and editing staff, and processing facilities also have an impact on sample size. In
fact, these can be the most important determinants of sample size. For example, as discussed in Chapter
4 - Data Collection Methods, while personal interviews allow more complex information to be collected
and tend to generate high response rates, they are expensive to conduct. Therefore, they are not always
practical for large samples.
8.2 Sample Allocation for Stratified SRS Designs
An important consideration in determining the efficiency of stratified sampling is the way in which the
total sample size, n, is allocated to each stratum. Recall from Chapter 6 - Sample Designs that with a
stratified sample design, the total number of units in the population, denoted by N, is divided into L non-
overlapping strata of size N1, N2, … , NL, respectively. Therefore, the population size is equal to the sum,
over all strata, of the number of units in the population: N = N1 + N2 + … + NL. A sample is
independently drawn from each stratum. The size of the sample in each stratum is denoted by nh (h = 1, 2,
…, L), where n = n1 + n2 + … + nL.
The allocation or distribution of the sample, n, to the L strata can be carried out using one of two criteria.
The total sample size can be determined using the methods described earlier in this chapter and then
distributed across the strata (called fixed sample size), or the sample size required in each stratum to meet
a precision requirement can be determined and summed to determine the total sample size (called fixed
coefficient of variation, if the precision requirement is expressed in terms of the coefficient of variation).
176.
SURVEY METHODS ANDPRACTICES
STATISTICS CANADA
164
8.2.1 Allocation Criteria
This section describes in detail the difference between fixed sample size and fixed coefficient of variation
allocations.
8.2.1.1 Fixed Sample Size
In this case, a fixed sample size n is allocated to the strata in a specified manner. The proportion of the
sample allocated to the hth
stratum is denoted as ah=nh/n, where each ah is between 0 and 1 inclusively
(i.e., 0 ≤ ah ≤ 1) and the sum of the ah’s is equal to 1 (i.e. ∑=
=
L
h
ha
1
1).
Therefore, for each stratum h, the sample size nh is equal to the product of the total sample size n and the
proportion ah of the sample coming from that particular stratum:
hh ann ×= (4)
For example, if a stratum has a proportion ah=½, then half of the entire sample is allocated to that stratum.
Under this allocation criterion, since the overall sample size n is already known, the sample size nh for
each stratum can be calculated as soon as the value of ah is determined for each stratum. There are many
ways to determine ah: one is to find values of ah that minimise the sampling variance of the characteristics
of interest. Determining the value of ah is presented in section 8.2.2.
8.2.1.2 Fixed Coefficient of Variation
The alternative to fixing the sample size, n, is to determine the sample size required in each stratum, nh,
given a certain level of precision for the overall estimate. This implies finding the sample size nh (h = 1,
2, … , L) for each stratum, so that the coefficient of variation of the overall estimate does not exceed the
desired value CV.
For example, consider the estimate of a total, Yˆ , from a stratified simple random sample. The equation
for the coefficient of variation of an estimated total from a stratified sample can be manipulated into the
following expression for the total sample size, n:1
1
See section 7.3.2.4 of Chapter 7 - Estimation for the sampling variance of an estimated total for a Stratified SRS.
The above equation can be derived by setting YYVarYCV /)ˆ()( = where )ˆ()( 2
YVarNYVar = and
∑=
h
hNN .
177.
SAMPLE SIZE DETERMINATIONAND ALLOCATION
STATISTICS CANADA
165
where:
Nh is the stratum size;
2
hS is the population variability of the units, yi, in stratum h;
ah is the proportion of the sample allocated to the stratum;
CV is the required coefficient of variation of Y;
Y is the total.
Note that the above formula assumes that hhh Nann <×= , i.e., the allocated stratum sample size is less
than the stratum population size. This is further discussed in section 8.2.3. The population variance,
2
hS ,
can be estimated by
2ˆ
hS as follows:
where hy , the sample stratum average, is:
h
n
i
hi
h
n
y
y
h
∑=
= 1
(Note that, if yhi is a binary variable, then the stratum average is a proportion, i.e., hh Py ˆ= , and
)ˆ1(ˆˆ 2
hhh PPS −= ).
Substituting hh ann ×= ,
2ˆ
hS and Yˆ into the earlier equation for n results in the following equation for nh:
)5(
ˆˆ
ˆ
1
222
1
22
∑
∑
=
=
+
= L
h
hh
L
h
hhh
hh
SNYCV
aSN
an
Therefore, after determining the value of ah for each stratum, calculate each sample size nh. Notice that, as
with the sample size determination presented earlier in this chapter, in order to determine nh, one needs to
specify a precision requirement (here in the form of a coefficient of variation), the estimated variability of
the population,
2ˆ
hS , and the population size, Nh. An adjustment for nonresponse should be made to the
final nh.
∑
∑
=
=
+
= L
h
hh
L
h
hhh
SNYCV
aSN
n
1
222
1
22
( )
1
ˆ 1
2
2
−
−
=
∑=
h
n
i
hhi
h
n
yy
S
h
178.
SURVEY METHODS ANDPRACTICES
STATISTICS CANADA
166
Note that the fixed coefficient of variation approach to sample allocation is more complicated than the
fixed sample size approach and only the latter will be used to illustrate sample allocation.
8.2.2 Sample Allocation Methods
Equations (4) and (5) are the basic tools for allocating a stratified sample. Either equation can be used as
soon as values have been determined for each ah. The choice of ah for each stratum may be classified into
two types of methods: proportional allocation or disproportional allocation. These methods are based on
some quantities: the size of the population in the stratum, some other measure of the size of the stratum,
the population variability of the stratum or the cost of surveying in the stratum.
8.2.2.1 Proportional Allocation
With Proportional allocation, or N-proportional allocation, the sample size, nh, in each stratum is
proportional to the population size, Nh, of the stratum. Therefore, larger strata receive more of the sample
and smaller strata receive less of the sample. This results in the sampling fraction, fh=nh/Nh, being the
same in each stratum and equal to the overall sampling fraction f=n/N. Therefore, the following
expression is obtained:
n
N
N
n h
h =
Thus, for N-proportional allocation, ah=nh/n=Nh/N. In other words, the allocation factor ah for each
stratum is equal to the ratio of the population size in the stratum to the entire population size. This type of
allocation was illustrated in Chapter 7 - Estimation.
N-proportional allocation is often used when information on population stratum variances is unavailable.
Hence, it is not used when calculating sample sizes for a fixed coefficient of variation since that approach
requires knowledge about the variance of each stratum. N-proportional allocation is also used to make the
sample design self-weighting (i.e., all units have the same inclusion probability,π , and hence the same
design weight, π/1 ).
Stratified sampling using N-proportional allocation is considerably more efficient than simple random
sampling of the whole population if the stratum averages, hY , differ considerably from each other.
However, if the strata are formed such that their averages, hY , are about the same, stratification with N-
proportional allocation affords only a slight reduction in the sampling variance. N-proportional allocation
is never worse than simple random sampling and thus never has a design effect, deff, greater than 1.
The following example illustrates N-proportional allocation, using a fixed sample size, n.
Example 8.2 (continued):
In Example 8.2, option 1, the sample size n was calculated to be 768 persons. N-proportional allocation
for a fixed sample size is used to determine how the 768 persons should be allocated to each of the three
strata.
1. Using N-proportional allocation, calculate the value of the allocation factor ah for each stratum.
179.
SAMPLE SIZE DETERMINATIONAND ALLOCATION
STATISTICS CANADA
167
City 1: City 2: Rural area:
6084.0
500,657
000,400
1
1
=
=
=
N
N
a
3802.0
500,657
000,250
2
2
=
=
=
N
N
a
0114.0
500,657
500,7
3
3
=
=
=
N
N
a
2. Calculate the sample size nh for each stratum.
City 1: City 2: Rural area:
467
6084.768
11
=
×=
= nan
292
3802.768
22
=
×=
= nan
9
0114.768
33
=
×=
= nan
As can be seen, the majority of the sample is allocated to the larger strata, City 1 and City 2, where 467
and 292 persons are sampled respectively. The smaller stratum, the rural area, receives a small portion of
the entire sample with a sample of only 9 persons. The results are summarised in the following table.
Table 5: N-proportional Allocation
H Stratum Population (Nh) ah nh fh =nh/Nh
1 City 1 400,000 .6084 467 .0012
2 City 2 250,000 .3802 292 .0012
3 Rural area 7,500 .0114 9 .0012
Total 657,500 1 768 .0012
The table above shows that N-proportional allocation produces a self-weighting design because the
sampling fraction, fh, is equal to .0012 in all three strata.
Note that the difference between the above allocation and the sample size determination in Example 8.2,
option 2, is that the above allocation satisfies a precision requirement for an estimate for the overall
population, while Example 8.2, option 2 satisfies precision requirements for each stratum.
8.2.2.2 Disproportional Allocation
With disproportional allocation, the sampling fractions differ across strata. The following disproportional
allocation methods will be presented and explained: Y-proportional, N -proportional, Y -proportional,
optimum allocation, Neyman allocation and optimum allocation when variances are equal. Terminology
can lead to confusion as some of the disproportional allocation methods are referred to as proportional
allocation methods (e.g., Y-proportional allocation). The important thing to remember is that as soon as
the sampling fraction is different between at least two strata, the allocation method is considered
disproportional.
8.2.2.2.1 Y-Proportional Allocation
Given a survey variable, yhi, that is a measure of size for the ith
unit in the hth
stratum, the sample sizes, nh,
can be calculated as proportions of Yh an aggregate measure of the size of stratum h. This type of
180.
SURVEY METHODS ANDPRACTICES
STATISTICS CANADA
168
allocation is called Y-proportional. Here, ah=Yh/Y. This means that the allocation factor ah for each
stratum is equal to the ratio of the stratum measure of size to the entire population measure of size.
Y-proportional allocation is a very popular allocation method for business surveys where the distribution
of yhi is skewed (i.e., has extreme values in one tail of the distribution). Typical examples are employment
in manufacturing industries, and sales for retailing industries. In such cases, a small number of businesses
can account for a large percentage of total employment or total sales. On the other hand, the remaining
large number of businesses can represent only a small fraction of total employment or total sales.
In business surveys, strata are usually built based on an available measure of size (e.g., number of
employees, gross business income, net sales). For example, the size measure might be used to create three
strata for small, medium and large businesses. The stratum containing the largest units is often more
variable than the other strata. In one extreme form, Y-proportional allocation implies that the largest units
of a skewed population are sampled with certainty.
Y-proportional allocation will result in better precision than N-proportional allocation for survey
estimates that are more strongly correlated to Yh than to the size of the stratum, Nh.
8.2.2.2.2 N -Proportional Allocation
So far, all of the allocation methods presented have only considered the precision of the overall estimate,
Yˆ . But often the client is interested in having good precision for stratum estimates, hYˆ , as well. For
example, if strata are provinces, provincial as well as national estimates are probably important.
Allocation to strata using N -proportional allocation can improve the precision of the stratum estimates.
In this case, the allocation parameter ah is calculated as:
In other words, the allocation parameter ah is equal to the ratio of the square-root of the population size in
the stratum to the sum of the square-root of the population size of all strata.
N -proportional allocation is not as efficient as other allocation methods in terms of maximal overall
precision. However, it can provide better estimates at the stratum level. It is often used as a compromise
between optimum allocation (see 8.2.2.2.4) and allocating to satisfy all domain constraints (where the
domains are defined as strata). For example, optimum allocation for national estimates can result in large
sampling variances for smaller domains of interest (e.g., provinces), while allocating the total sample to
satisfy all domain constraints (as in Example 8.2, option 2) can result in inefficient allocation of the total
sample. Square root N-proportional allocation provides a compromise between overall and domain level
allocation.
The following example illustrates the use of N -proportional allocation, for a fixed sample size, n.
∑=
= L
h
h
h
h
N
N
a
1
181.
SAMPLE SIZE DETERMINATIONAND ALLOCATION
STATISTICS CANADA
169
Example 8.2 (continued):
In the previous example, a fixed sample of 768 persons was allocated to the three strata using N-
proportional allocation. Here, the allocation to the strata is done using the N -proportional allocation
method.
1. Using N -proportional allocation, calculate the value of the allocation factor ah for each stratum.
City 1: City 2: Rural area:
5188.0
06.219,1
46.632
3
1
1
1
=
=
=
∑=h
hN
N
a
4102.0
06.219,1
500
3
1
2
2
=
=
=
∑=h
hN
N
a
0710.0
06.219,1
60.86
3
1
3
3
=
=
=
∑=h
hN
N
a
2. Calculate the sample size nh for each stratum.
City 1: City 2: Rural area:
398
5188.768
11
=
×=
= nan
315
4102.768
22
=
×=
= nan
55
0710.768
33
=
×=
= nan
The following table summarises the results and compares N-proportional allocation to N -proportional
allocation.
Table 6: Comparison of N-proportional Allocation and N -proportional allocation
N-proportional allocation N -proportional allocation
H Stratum Population (Nh) Ah nh fh
hN ah nh fh
1 City 1 400,000 .6084 467 .0012 632.46 .5188 398 .0010
2 City 2 250,000 .3802 292 .0012 500 .4102 315 .0013
3 Rural area 7,500 .0114 9 .0012 86.60 .0710 55 .0073
Total 657,500 1 768 .0012 1,219.06 1 768 .0012
N -proportional allocation gives a smaller sample size in City 1 than N-proportional allocation.
Conversely, it gives a larger sample in City 2 and in the Rural area. Therefore, the precision of the
estimate in City 2 and in the Rural area is better with the N -proportional allocation than with N-
proportional since the sample size is larger. (It would be difficult to get a good estimate of the rural area
based on only 9 units.) The decrease in sample size in City 1 will have a small impact on the precision of
the estimate. The increase in sample size in City 2 will only have a slightly positive impact on the
precision of its results. However, the increased sampled size in the Rural area provides large gains in the
precision of these estimates. The gain in precision in the Rural area more than compensates for the loss of
precision in City 1.
182.
SURVEY METHODS ANDPRACTICES
STATISTICS CANADA
170
8.2.2.2.3 Y -Proportional Allocation
Another way of ensuring good reliability for stratum estimates as well as the overall estimate is to use
Y -allocation, where yhi is a measure of size. It is an alternative to N -proportional allocation and is
more precise than N -allocation for survey estimates that are correlated to the size variable, Yh , more
strongly than to the size of the stratum, Nh. The allocation parameter ah is:
This means that the allocation parameter ah is equal to the ratio of the square-root of the measure of size
of the stratum to the sum of the square-root of the measure of size of all strata.
As was the case for N -proportional allocation, using the Y -proportional allocation to calculate the
values of ah (and subsequently the values of nh) is not as efficient as other allocation methods in terms of
overall precision. However, it can provide more precise estimates at the stratum level.
N -Proportional and Y -Proportional allocations are sometimes referred to as power allocations,
where a power allocation with respect to Y, for example, is defined in more general terms as:
where p is usually some fraction (e.g., ½). For more details on power allocations, see Bankier (1988).
8.2.2.2.4 Optimum Allocation
When the cost of interviewing per unit differs between strata and the population variances, Sh
2
, vary
greatly, a disproportionate allocation method known as optimum allocation may be considered. This is the
only allocation method presented here that takes cost into account.
In order to use optimum allocation, the statistical agency needs a function to model the cost. The simplest
total cost function is of the form
∑=
+==
L
h
hho nccCstoC
1
ˆ
where ch is the cost per unit of surveying in stratum h (h = 1, 2, … , L) and c0 is a fixed overhead cost.
This cost function is best when the major item of cost is that of interviewing, or taking the measurements
on each unit.
The allocation parameter ah used for optimal allocation is calculated as follows:
∑=
= L
h
p
h
p
h
h
Y
Y
a
1
∑=
= L
h
h
h
h
Y
Y
a
1
183.
SAMPLE SIZE DETERMINATIONAND ALLOCATION
STATISTICS CANADA
171
∑=
= L
h
hhh
hhh
h
cSN
cSN
a
1
Optimum allocation minimises the variance of the estimate for a given cost or, equivalently, minimises
the cost of the total sample for a given overall variance. To achieve this goal, sampling is increased in
those strata with large variances or population sizes and decreased in those strata in which interviewing is
expensive. As a general rule of thumb for optimum allocation, a larger sample is selected in a given
stratum if:
- the stratum is larger;
- the stratum is more variable internally;
- conducting the survey is cheaper in the stratum.
In order to use optimum allocation, accurate information on stratum variances and unit costs is required.
In practice, the variances and the costs may not be known. One way to overcome this limitation is to
estimate the variances and costs from a preliminary sample or previous survey. One difficulty with
optimum allocation is that the stratum estimated variances and costs may not be precise. Therefore, in
practice, the design may not be optimal.
When costs and variances are equal for all strata, optimal allocation reduces to N-proportional allocation.
In such a case, N-proportional allocation is the allocation for which the variance of the estimate is
minimised. When only the costs are equal for all strata, optimum allocation reduces to what is generally
called Neyman allocation, presented next.
8.2.2.2.5 Neyman Allocation
This special case of optimum allocation, called Neyman allocation, occurs when the cost of an interview
is identical in each stratum. It provides an allocation of the total sample size to strata that minimises the
overall variance of the estimate. Neyman allocation assigns more sample units to larger strata, and/or
strata with the highest variances. Again, as was the case for optimum allocation, the variances may not be
known, so estimates are typically used.
The allocation parameter ah is defined as:
∑=
= L
h
hh
hh
h
SN
SN
a
1
This means that the allocation parameter ah is equal to the ratio of the product of the stratum size and the
square root of the variance to the sum of the product of the stratum size and the square root of the
variance for all strata.
When it is not possible to get an accurate value for the variances, the ratio of the stratum variance to the
stratum average ( hh YS ) can be considered constant across strata. This assumption reduces Neyman
allocation to Y-proportional allocation. One difficulty with Neyman allocation, as with optimum
allocation, is that the stratum estimate of the variances may not be precise and hence the design may not
be optimal.
184.
SURVEY METHODS ANDPRACTICES
STATISTICS CANADA
172
8.2.2.2.6 Optimum Allocation when Variances are Equal
Another special case of optimum allocation occurs when the variances are equal in all strata – which is
unusual, hence this allocation is rarely used. It is used when nothing is known about the population
variances, or when these variances can be assumed roughly equal, and the predominant allocation factor
is cost, in which case, this type of allocation puts more sample units in strata that are larger and/or have
the smallest costs. The allocation parameter ah is defined as:
∑=
= L
h
hh
hh
h
cN
cN
a
1
8.2.3 Special Considerations During Allocation
The following concerns should be kept in mind during allocation:
i. Using auxiliary data for Y-proportional and Y -proportional allocation
When implementing a stratified sample design and allocating proportional to Y or the square root of Y, in
practice, the value of Y is not known for all of the units in the population – if it were, there would be no
need to conduct a survey for this variable. So, for these allocation methods, auxiliary data that are highly
correlated with Y are used, usually from previous surveys or administrative data. There is no guarantee
that the specified coefficient of variation for the survey variable will be attained since the statistical
agency is using an auxiliary size measure. The efficiency of size-stratification and the accuracy of the
allocation then depend on the strength of the correlation between the survey variable and the auxiliary
variable used.
ii. Over-allocation
In a stratified design using optimum allocation, Neyman allocation, Y-proportional allocation or Y -
proportional allocation, it is possible for the allocated nh to be larger than the population size Nh. This is
called over-allocation. When it occurs, a census should be conducted in the over-allocated strata. The
overall sample size resulting from such over-allocation will then be smaller than the original sample size,
so the overall precision requirements might not be met. The solution is to increase the sample in the
remaining strata where nh is smaller than Nh using the surplus in the sample sizes obtained from the over-
allocated strata.
iii. Minimum stratum sample size
In each stratum, it is usually advisable to have at least two units allocated. Two units is in fact the
minimum to be able to produce an unbiased estimate of the variance of the estimates. Note that
considering total nonresponse, the minimum stratum sample size should in fact be more than two.
Unfortunately, all sample allocation methods seen in Section 8.2.2 might produce sample sizes that are
less than two, or even less than one. In that case, the most usual solution is to increase the sample size to
two in those strata where such a problem occurred. Note that this will increase the total sample size
allocated. Another solution is to allocate a sample of size of two to all strata, and then allocate the
185.
SAMPLE SIZE DETERMINATIONAND ALLOCATION
STATISTICS CANADA
173
remaining sample size to all strata using one of the allocation methods presented earlier. This solution has
the desirable property not to increase the total sample size.
iv. Allocating according to several variables
Allocation that is suitable for one variable may not be suitable for another survey variable. To allocate the
sample based on more than one variable, a compromise allocation is needed. Multivariate allocation
schemes (some of them using linear programming) have been developed to provide a solution to such
problems (see Bethel, 1989).
It is important to remember that the statistical agency wants to allocate the sample in order to meet the
precision requirements for the major variables of interest of the survey. This usually means that estimates
for the less important variables in the survey will not be as precise as the major variables.
8.3 Summary
Sample size determination is a process of making practical choices and trade-offs amongst the often
conflicting requirements of precision and such operational constraints as the overall budget, the cost of
surveying in each stratum, the available time and the number of interviewers that are required and
available. Decisions on sample size may require a re-examination and a possible modification of original
objectives, data requirements, levels of precision and elements of the survey plan, field operations, etc.
Often, the statistical agency and client look for cost efficiencies so that the client can afford the required
sample size, for example, by shortening the interviews, using an alternative data collection method,
dropping some domains of interest or considering an alternative sample design.
When stratified sampling is used, the sample must be distributed across the strata. This can be done one of
two ways: by determining the total sample size and distributing it across the strata to minimise the
variability or, given a precision requirement, by determining the sample size required in each stratum.
Both of these methods require a formula for the allocation, ah, within each stratum. There are a variety of
different allocation methods. N-proportional allocation is the only proportional allocation method,
resulting in equal sampling fractions in all strata. Disproportional allocation methods distribute the
sample across strata according to: the size of the population in the stratum or some other measure of the
size of the stratum, the population variability of the stratum or the cost of surveying in the stratum.
Bibliography
Bankier, M. 1988. Power Allocations: Determining Sample Sizes for Subnational Areas. The American
Statistician, 42: 174-177.
Bethel, J. 1989. Sample Allocation in Multivariate Surveys. Survey Methodology, 15(1): 47-57.
Cochran, W.G. 1977. Sampling Techniques. John Wiley and Sons, New York.
Fink, A. 1995. The Survey Kit. Sage Publications, California.
Fowler, Floyd, J. 1984. Survey Research Methods. 1. Sage Publications, California.
186.
SURVEY METHODS ANDPRACTICES
STATISTICS CANADA
174
Hidiroglou, M. 1986. The Construction of a Self-Representing Stratum of Large Units in Survey Design.
The American Statistician, 40: 27-31.
Hidiroglou, M. 1993. Some Sample Size Determination and Allocation Procedures for Business Surveys.
Statistics Canada.
Glasser, G.J. 1962. On the Complete Coverage of Large Units in a Statistical Study. Review of the
International Statistical Institute, 30: 28-32.
Gower, A. and K. Kelly. 1993. How Big Should the Sample Be? Statistics Canada.
Kish, L. 1965. Survey Sampling. John Wiley and Sons, New York.
Latouche, M. 1988. Sample Size Determination and Allocation. Statistics Canada. BSMD 88-021E/F.
Lavallée, P. and M.A. Hidiroglou. 1988. On the Stratification of Skewed Populations. Survey
Methodology, 14(1): 33-43.
Lehtonen, R. and E.J. Pahkinen. 1995. Practical Methods for the Design and Analysis of Complex
Surveys, Statistics in Practice. John Wiley and Sons, New York.
Levy, P. and S. Lemeshow. 1999. Sampling of Populations. John Wiley and Sons, New York.
Lohr, S. 1999. Sampling: Design and Analysis. Duxbury Press, U.S.A.
Moser C.A. and G. Kalton. 1971. Survey Methods in Social Investigation. Heinemann Educational Books
Limited, London.
Särndal, C.E., B. Swensson and J. Wretman. 1992. Model Assisted Survey Sampling. Springer-Verlag,
New York.
Satin, A. and W. Shastry. 1993. Survey Sampling: A Non-Mathematical Guide – Second Edition.
Statistics Canada. 12-602E.
Sethi, Y.K. 1963. A Note on Optimum Stratification of Populations for Estimating the Population Means.
Australian Journal of Statistics, 5: 20-33.
Thompson, M. 1997. Theory of Sample Surveys. Chapman and Hill, United Kingdom.
Thompson, S.K. 1992. Sampling. John Wiley and Sons, New York.
187.
STATISTICS CANADA
175
Chapter 9- Data Collection Operations
9.0 Introduction
Data collection is typically the greatest single expense in a survey. Because of this and because problems
arising during collection can be very expensive to fix – and could result in overall failure of the project –
careful thought and planning must be given to this survey step. Chapter 4 - Data Collection Methods
discussed different methods of data collection. This chapter presents the various activities that occur
during data collection and how they should be organised and conducted, with an emphasis on interviewer-
assisted surveys since these have the most comprehensive operational requirements.
Data collection should be organised as efficiently as possible while maintaining consistent interviewing
practices across all interviewers. One method of organisation, employed at Statistics Canada and
presented here, uses regional offices which report to a central head office.
Public relations are important to gain respondent co-operation. Part of this entails maintaining a good
reputation as a statistical agency. It also involves publicity campaigns and various tools such as
introductory letters, survey brochures and survey material provided in a form that can be used by
newspapers, radio and television to elicit interest in a survey and encourage respondent participation.
Hiring good interviewers and other personnel is crucial to successful data collection. The quality of data
collection and the survey results depends on the consistency and quality of these workers. Training and
manuals are therefore also important.
Before the interview can be conducted or the self-enumeration questionnaire distributed, listing and tracing
are sometimes performed. Listing is required when area frames are used. The purpose of listing is to create a
list of units to be sampled (e.g., dwellings or businesses) within a specific geographic area. Tracing is
performed when the sample unit cannot be located using information on the survey frame. For example, the
survey frame’s telephone numbers might be out-of-date.
Once the respondent has been traced and contacted, the interviews or self-enumeration can begin. This
involves more than simply asking questions, it includes: scheduling interviews, eliciting respondent co-
operation, minimising response errors, following up edit failures, coding responses, controlling
documents and monitoring the quality of data collection. Only after all these activities are finished is data
collection considered complete.
9.1 Organisation of Data Collection
While data collection operations can be organised in many possible fashions, one of the most common is
to divide the country into regions and assign each region a regional office that reports to a central head
office. Using this structure, the regional offices are able to take full advantage of local knowledge to
improve respondent relations and improve efficiency by reducing the cost of follow-up of incomplete
questionnaires, refusals, other nonrespondents, etc. Regional offices are responsible for managing data
collection and data capture activities in their areas (data capture is the transformation of responses into a
machine-readable form, see also Chapter 4 - Data Collection Methods and Chapter 10 - Processing).
Head office ensures that consistent and standard concepts and procedures are used across the regions.
Head office is responsible for the overall management of the survey as well as the design of data
collection procedures.
188.
SURVEY METHODS ANDPRACTICES
STATISTICS CANADA
176
There are a number of things to consider when structuring regional offices. For a very large survey or
census, district offices may be required that report to a regional office. When considering the number of
regions and/or offices, the following factors should be considered:
- size of the survey;
- sample size and location of sample units;
- remoteness of the location;
- difficulty contacting respondents;
- difficulty eliciting respondent co-operation;
- language of the respondents;
- structure of provincial, regional or local governments;
- labour markets (e.g., staff availability, educational levels, language profiles);
- transportation routes (e.g., highways, ports, shipping hubs).
9.1.1 Head Office
Head office is generally responsible for planning and designing the following activities and tools:
i. Data collection procedures
Head office typically designs and develops manuals for interviewers, supervisors and other data collection
personnel. These procedures include: interviewing, listing sampled units and updating the survey frame,
tracing respondents, following-up nonrespondents, and editing and coding to be performed in the field.
Some of these tasks are detailed in Chapter 10 - Processing.
ii. Data processing
Processing transforms survey responses obtained during collection into a form that is suitable for
tabulation and data analysis. Processing activities include data coding, data capture, editing and
imputation. Head office is responsible for the development of the processing procedures and programs
along with quality control and quality assurance procedures to be used in the regional offices. Processing
activities are discussed in Chapter 10 - Processing. Quality Control and Quality Assurance are discussed
in Appendix B - Quality Control and Quality Assurance.
iii. Training procedures
This includes the development of exercises, mock interview scripts, and audio-visual materials as well as
training guides.
iv. Data collection schedule
A timetable for data collection is established, detailing survey milestones and reporting periods so that the
target date can be achieved. The schedule includes target resolved rates for each reporting period as well
as target response rates (see section 9.5.3 for details).
v. Reporting and control systems
In order to ensure that all data collection operations are under control, control forms for the whole sample
and by interviewer (called the interviewer’s assignment) are developed and regular reporting procedures
to update the status of each sampled unit are established. This is generally called the ‘Management
189.
DATA COLLECTION OPERATIONS
STATISTICSCANADA
177
Information System’ (MIS). With computer-assisted interviewing, tracking a unit’s status and creating
appropriate monitoring reports is programmed into the computer software.
The MIS should have the ability to track quality measures as well as expenditure and other performance
measures during data collection. All data collection costs such as the cost of postage, telephone calls,
travel, computing, and person-day consumption should be tracked. Important quality measures, including
response rates, follow-up rates and counts of total nonresponse by reason, should be measured and
monitored throughout the collection process. Measures of quality and productivity can be used together to
determine logical end points for data collection (e.g., when the response rate has reached a predetermined
target, or when improving the response rate by a further set amount would cost too much money) and if
the target end date for collection cannot be met, what adjustments should be made. These quality
measures also serve to assess methods that might be applied to other surveys and provide information for
the data quality evaluation.
vi. Public relations campaign
This includes the development and production of brochures, posters, etc. For large surveys, some
elements of the public relations campaign is conducted directly from head office. However, since public
sentiment can vary considerably from region to region in a large country, much of this work is done from
the regional offices.
9.1.2 Regional Office
The main responsibilities of regional offices are data collection, data capture and public relations. Data
capture is often done by the regional offices since it is easier to control, manage and transmit to head
office electronic files rather than paper questionnaires. It is also easier for the regional office to capture
their smaller batches of questionnaires than for the head office to capture the data for all regions.
Using a regional office infrastructure ensures that the day-to-day management of data collection activities
is conducted as closely as possible to the scene of operations, facilitating the identification and resolution
of problems as they arise.
For most surveys conducted from regional offices, the following hierarchy of collection employees is
used:
i. Regional Project Manager
The regional project manager is given overall responsibility for ensuring that data collection is completed
on time and meets the predetermined quality standard. The regional manager is also responsible for the
regional budget. Typically, the manager takes the overall survey schedule and adds the detailed regional
milestones and control points necessary to keep the survey on track. The regional manager acts as the
liaison person with head office and the contact point for all shipments to and from head office. The
manager, in turn, is responsible for distributing materials and providing information to the supervisor(s).
For very large surveys such as the Canadian Census of Population, there are assistant regional managers
and district managers.
ii. Supervisor
Depending on the size of the survey, there may be more than one supervisor, each responsible for a team
of interviewers. The ratio of supervisors to interviewers varies depending on the:
190.
SURVEY METHODS ANDPRACTICES
STATISTICS CANADA
178
- complexity of the survey;
- experience of the supervisors and interviewing staff;
- location of the sample;
- travel difficulties;
- ease of use of the Management Information System.
In conjunction with the regional manager, the supervisor hires and trains interviewers and acquires and
distributes equipment and supplies. The supervisor is responsible for the day-to-day management of data
collection, including the supervision of interviewers and the close monitoring of progress and quality.
Another important supervisor task is the follow-up of refusals (see section 9.4.6).
iii. Interviewer
The interviewer conducts the actual data collection and reports problems and progress regularly to the
supervisor. The role of the interviewer is discussed in Section 9.4.
9.2.1 Public Relations
The purpose of a public relations campaign is to sensitise the population to the existence of the survey, so
that people are not suspicious of strangers in their neighbourhood knocking on doors, and to motivate
interest, thereby increasing the response rate and the accuracy of responses.
For any statistical agency, the best public relations strategy is to establish and maintain a credible and
professional reputation by ensuring that the data that it collects are reliable, widely available, used and
appreciated and that the confidentiality of respondents’ answers is respected.
In addition to the agency’s good reputation, in order to obtain a good response rate it is important that
interviewers be provided with the tools to respond to questions and complaints. Various other tools are
also helpful such as an introductory letter, a survey brochure and a general agency brochure. For larger
surveys, publicity campaigns are often conducted.
This section on public relations only covers contact with the general public. There are however other
forms of communication with people outside the survey team that should occur throughout the survey
process. For example, early on in the planning phase, the survey planners should identify possible issues
that could arise with the proposed survey, how to deal with them and whether to proceed with the survey
or not. For example, a survey’s proposed topic may be too sensitive for a portion of the respondents. Also
during the planning process it is important to consult with stakeholders, respondents, local governments
and other interested parties to ensure proper content development of the questionnaire. And at the end of
the survey process, these interested parties should be consulted or debriefed on the results.
For more on confidentiality and survey planning, see Chapter 12 - Data Dissemination and Chapter 13
- Survey Planning and Management, respectively.
9.2.2 Publicity Campaigns
Publicity campaigns can include any or all of the following, depending on the survey topic, budget and
target population:
191.
DATA COLLECTION OPERATIONS
STATISTICSCANADA
179
- active media relations (supplying public announcements, stories and spokespersons for newspapers,
radio and television stations) and media relations during data collection to deal with any problems
that crop up during the process;
- contacting groups who will promote the survey during data collection as well as those who may come
out against it;
- letters to important public officials (or representatives of associations or institutions that are related to
the target population of the survey) to solicit their support and to supply these officials with
information that could be included in a speech or newsletter, etc. (These officials will often speak
actively in support of the survey.);
- letters to law enforcement officials to advise them of the survey in the event that respondents,
suspicious of survey personnel, contact them;
- posters in public areas such as post offices and libraries or in locations where the target population is
likely to see them.
9.2.3 Respondent Relations
Most of the public relations campaign focuses on the respondents in order to increase their awareness and
co-operation. The materials most often used are:
i. The introductory letter
This letter provides the purpose and an explanation of the importance of the survey, as well as the
collection method and dates. Introductory letters are generally signed by the most senior regional official
(Regional Director). For mail surveys, the introductory letters (and brochures, if appropriate) are sent with
the questionnaires. For interviewer-administered surveys, letters (and brochures, if appropriate) are
usually sent out one week in advance. This way, respondents are not surprised and are more likely to co-
operate when an interviewer appears at their home.
ii. The survey brochure
This is a simple fact sheet describing the importance of the survey to the public good. It should contain
examples of the uses of the data as well as a source where the data can be obtained. Brochures can be sent
to all respondents, or used only in cases where respondents are reluctant.
iii. The general agency brochure
A general-purpose handout, illustrating the variety of data the agency collects and disseminates, adds to
the credibility of the agency and is often used for respondent relations as well.
iv. Support during collection to deal with any unexpected respondent problems.
v. The interviewer’s manual
A well-developed interviewer’s manual should provide answers to expected questions and objections.
192.
SURVEY METHODS ANDPRACTICES
STATISTICS CANADA
180
vi. Specialists trained to convert refusals
Typically, interviewers refer refusals to their supervisors who are trained in methods to convert refusals.
The following is an example of an introductory letter used by Statistics Canada for the British Columbia
Farm Resource Management Survey conducted in 1998. The letter establishes the authority under which
the survey is conducted, provides reassurances about confidentiality and stresses the importance of the
participation of the respondent. The letter closes with the name and telephone number of a person the
respondent can contact in case of questions, and the appropriate signature, in this case, that of the
Regional Director.
Dear respondent:
Your operation has been randomly selected to participate in the British Columbia Farm Resource
Management Survey, an important study on farm management practices relating to three principal
resources: soil, water and manure/fertilizer. This voluntary survey, focusing specifically on livestock
operations, is the first of a comprehensive series that will ultimately provide consistent data for all
commodity groups in the province. This study is being conducted in conjunction with the British
Columbia Ministry of Agriculture and Food, to ensure that agriculture programs reflect the changing
way resources are being managed on farms today.
Between October 5 and October 24 a Statistics Canada interviewer will call you to conduct a five to ten
minute interview over the telephone. No detailed financial questions will be asked and you will not need
to refer to your records. We will, however, ask for the number and type of livestock on your operation in
order to provide perspective on the management practices used.
All information collected by Statistics Canada is kept strictly confidential and is protected by law. It will
only be used to produce statistical tables in which individual respondents and their information cannot be
identified.
Statistics Canada recognises the tremendous contribution that respondents in the agriculture industry
make in completing surveys. This contribution means that up to date and relevant data are available on
this rapidly changing sector. I would like to express my sincere appreciation for your co-operation in past
surveys, and to thank you in advance for your participation in this important study.
If you would like more information about this survey, please call Jane Doe, Manager of Agriculture
Surveys, in our Pacific Region office in Vancouver, toll-free at 1-800-555-5555.
John Smith
Director
Pacific Region
9.3 Preparation of Data Collection Procedures
Before data collection can begin many tasks must be performed, for example:
- writing manuals;
- hiring and training staff;
- designing listing procedures;
- designing tracing procedures.
193.
DATA COLLECTION OPERATIONS
STATISTICSCANADA
181
This section discusses these tasks.
9.3.1 Manuals
The key to successful data collection is quality interviewers and other personnel. Good interviewers and
survey personnel must have the abilities and personal qualities to be effective. The consistency and
quality of their work determines the quality of the survey results. Manuals delineate standard procedures
as well as instructions for dealing with foreseeable problems. Generally, the survey team produces an
interviewer’s manual, a supervisor’s manual, and, where necessary, listing instructions for area frames.
9.3.1.1 The Interviewers’ Manual
The interviewers’ manual is the principal and sometimes only source of information that the interviewer
relies on for information about his or her work. It is divided into sections or chapters dealing with the
following topics:
i. General information
This section states the survey’s purpose and importance, intended uses of the data and agency rules for
data collection (confidentiality, language of the interviewer, mandate of the agency, etc.). A copy of the
introductory letter sent to respondents is usually included. Basic information about how the sample was
selected is provided.
ii. The introduction
This section explains how to establish the first contact with a respondent, how to make sure that the right
respondent has been contacted, how to verify or correct the frame information (phone number, etc.) and
guidelines for proxy interviewing (Section 9.4.7).
iii. Questionnaire content
This section provides a copy of the questionnaire(s) and includes definitions of survey concepts and
terminology. It is important that the interviewer understand the meaning and purpose of each question.
This section also deals with likely problems and respondent questions and how these can be addressed.
iv. Field edits/grooming of questionnaires
Edits are rules that are applied to identify missing, invalid or inconsistent entries that point to data that are
potentially in error. Interviewers are required to perform edits while in the field (i.e., edits performed
during or shortly after the interview). Edit rules must be clearly described along with how the interviewer
is expected to apply them.
v. Individual sample unit management
This section deals with edit failure and nonresponse follow-up and the number of times an interviewer
should attempt to obtain a response. This section states how to assign a final status code to each
questionnaire (e.g., completed questionnaire, refusal, etc.). For more details, see section 9.5.2.
194.
SURVEY METHODS ANDPRACTICES
STATISTICS CANADA
182
vi. Assignment management
This section covers administrative details such as: how interviewers report progress for their assignment
of questionnaires, how they return questionnaires to the regional office, how they submit field expense
documents (e.g., transportation expenses, hotels, etc.), how they are paid and how supplies and equipment
are distributed and returned.
vii. Safety and security while in the field
This section explains occupational health and safety as well as effective control systems to ensure the
security of questionnaires and the transmission of data from regional to head offices.
viii. Questions and answers
This last section includes a list of common questions posed by the respondent (for example: How was I
selected for the survey?) and appropriate answers.
General interviewing skills and techniques can also be included in the interviewers’ manual, with
examples specific to the particular survey.
9.3.1.2 Supervisors’ Manual
Supervisors must be thoroughly familiar with the contents of the interviewers’ manual. A special
supervisor’s manual is also produced to provide instructions for the management of the survey.
The following topics are usually included in the supervisors’ manual:
- hiring and training interviewers;
- creating interviewer assignments;
- occupational health and safety;
- quality and performance controls (i.e., observing interviews, monitoring survey progress against
predetermined quality, expenditure and timing measures);
- logistics (e.g., the distribution and return of supplies, payment of interviewers, return and submission
of questionnaires to data capture, etc.);
- security and privacy protection;
- alternative collection methods to deal with disabled persons, language problems, ambiguity about
inclusion to the target population (e.g., foreigners, visitors), etc.;
- conversion of refusals to respondents.
9.3.2 Hiring and Training Interviewers
Interviewers are critical to the success of an interviewer-administered survey. It is important to ensure that
those who are hired have the required abilities and personal qualities and that they have the appropriate
training and tools.
The statistical agency should maintain a list of trained interviewers so that hiring can be done using this
list. If the survey needs are great, it may be necessary to seek additional staff. Announcements can be
made or advertisements placed in local newspapers or on the radio inviting potential applicants, or
suitable personnel may be recruited (for example, mail delivery personnel).
195.
DATA COLLECTION OPERATIONS
STATISTICSCANADA
183
The qualifications required for the survey must be specified and criteria for hiring established. Education,
interpersonal skills, fluency in local languages, organisation skills and trustworthiness are important
factors to consider when hiring interviewers (typically a security check is performed). In the case of
personal interviews, location and knowledge of the area may also be important. Usually a team, consisting
of the supervisor and senior regional manager, interview potential candidates.
Interviewer training must be carefully planned to guarantee uniform performance and comprehension of
survey concepts across all interviewers. Supervisors are usually trained first. Then, the supervisors train
the interviewers. Often, representatives from head office observe training and provide guidance. Several
days of intensive training are generally carried out using the techniques listed below:
i. Home study
Interviewers thoroughly review manuals and (possibly) complete written exercises.
ii. Classroom training
In class, the supervisors and interviewers study what can be done to foster good respondent relations and
thereby elicit responses. Good interviewing practices, skills and techniques are presented. The supervisors
review and correct errors in exercises from home study. The interviewers then review the entire
questionnaire content to become familiar with the questions and concepts (screen by screen for computer-
assisted interviewing). Special and problem cases are reviewed, allowing plenty of time for questions and
clarification.
iii. Mock interviews
Mock interviews provide interviewers with the opportunity to practice their skills before going out into
the field. They also allow interviewers to observe and comment on the skills and techniques shown by
their peers. Here the supervisor or another interviewer acts as the respondent. Various scenarios are
tested, including both typical and problem cases.
iv. Live interviews
If possible, interviews should also be performed on real respondents before the survey is taken out into
the field. The respondents here are sometimes agency staff unfamiliar with the survey or sometimes they
are respondents sampled from the target population (but not part of the sample to be used for the real
survey). Live interviews could also be performed as part of a pilot test (see Chapter 5 - Questionnaire
Design).
v. Review first few interviews
It is useful for the supervisor to meet with each interviewer to review the first few completed interviews.
If an interviewer is experiencing problems they can be identified early on and corrected.
Administrative procedures (e.g., weekly reporting, control forms, etc.) for managing the assignment is
usually the last topic covered in training. Once training is complete, each interviewer is provided with his
or her assignment.
196.
SURVEY METHODS ANDPRACTICES
STATISTICS CANADA
184
9.3.3 Listing
Listing is required when sampling from an area frame. Recall from Chapter 6 - Sample Designs that a
common sample design for an area frame is a two-stage cluster design where the first stage samples
geographic areas from an area frame (these are the primary sampling units or PSU’s). Within these
PSU’s, a systematic sample of dwellings (the secondary stage units or SSU’s) may then be drawn. In
order to sample the dwellings, a list must first be created of all in-scope dwellings in the PSU (i.e.,
dwellings that are eligible for sampling must be listed, where eligibility is defined with respect to the
survey’s target population).
Since familiarity with the geographic area (PSU) is an advantage for conducting the interview, the same
set of interviewers are often responsible for both listing and interviewing with the PSU. In order for
listing to be accurate, it should be done a short time before interviewing.
Before listing, each interviewer (or whoever is performing listing) should be given the following items
and trained in their use:
i. A PSU map with boundaries clearly marked
The boundaries of each PSU must be clearly defined, so that there are no overlapping PSU’s or missing
segments. The map should be the most detailed and up-to-date available with reference points (rail lines,
bridges, waterways, street names, etc) delineated as well. These sometimes come from municipal or land
survey sources.
ii. Listing instructions
This includes instructions on how to plot a route through the PSU, covering the entire area without
backtracking (which risks duplication) or missing areas. It also includes instructions on how to identify an
in-scope sample unit. For example, if the sample unit is a dwelling, there should be instructions on how to
find and identify hidden and multi-unit dwellings, the definition of an unoccupied dwelling, etc.
iii. A listing form with the information to be collected for each in-scope sample unit
The definition of an in-scope unit and the amount of information collected depend on the survey.
Typically, data collected during listing are limited to the information required to locate the unit (address
or location on the street, name, phone number, etc.) and any data required for the next stage of sampling.
Once listing has been completed, data on the listing forms are generally captured electronically and sent
back to head office so that the next stage of sampling can be performed.
To illustrate listing, the following is a cluster map from Statistics Canada’s Labour Force Survey, with the
boundary of the PSU marked in a solid line, the starting point for listing marked with an ‘X’, and the
route with dashes (---). The interviewer is instructed to begin at the Northwest corner and proceed in a
clockwise direction around each block, listing all habitable dwellings on his or her right. The same
general listing method (beginning at a predetermined starting point, proceeding clockwise, listing units on
the right) is used in rural areas as well. If the dwelling is a farm listing is more complicated since farms
can straddle PSU boundaries; in this instance, a solution is to list a farm in a PSU if its main gate or
principal entrance is in the PSU.
197.
DATA COLLECTION OPERATIONS
STATISTICSCANADA
185
Sometimes, if the method of sampling is very simple, the interviewer may draw the sample and conduct
the interviews at the same time as listing. For example, for the Canadian Census of Population, four out of
five households in an Enumeration Area (EA) receive a short questionnaire while every fifth household
receives a longer, more detailed questionnaire. Using systematic sampling with a random start within each
EA, the enumerator lists households and gives every fifth the long questionnaire.
See Chapter 3 - Introduction to Survey Design and Chapter 6 - Sample Designs for details on area
frames.
9.3.4 Tracing
Tracing is used when more information than is available on the survey frame is needed to locate the
respondent. For example, for telephone surveys, some of the telephone numbers on the frame might be
out of date. In mail surveys, some questionnaires mailed out are returned by the post office because of
incomplete or incorrect addresses, or because the establishment has ceased to exist or the respondent has
moved. Some tracing may be done before the survey is conducted if it is suspected that the survey frame
information may be out-of-date.
The objective of tracing is therefore to:
- locate the sampled unit;
- update the basic identification information on the sampling frame (e.g., name, address, phone number,
contact name, or for an area frame, pinpointing the geographic location of a farm on a map, etc.);
- determine whether the unit is still in-scope for the survey (e.g., Has the establishment ceased to exist?
Has the respondent moved out of the geographic scope of the survey?).
The most common tools used for tracing include:
- up-to-date telephone directories, business directories, and directory assistance;
- information from other more up-to-date frames;
- files from other government agencies (for example, lists of business licenses in a particular
municipality, lists of licensed drivers in a province, etc.);
198.
SURVEY METHODS ANDPRACTICES
STATISTICS CANADA
186
- for repeated surveys, tracing information provided by the sampled unit on a previous occasion (for
example, addresses or telephone number of relatives who can be used to trace the respondent).
Some tracing can be done by interviewers, but it is often more efficient for the regional office to have a
team of employees devoted to tracing with access to all the necessary files and directories. Once traced,
contact information on the survey frame information can be updated, or if tracing is done after collection
has begun, the traced units can be sent back to the original interviewers, or they can be assigned to a
special ‘clean up’ interviewer.
Along with the talent and initiative of the tracer, the success of tracing depends on the quality of the
auxiliary information on the survey frame. For example, Statistics Canada conducts a survey of university
graduates two years after they graduate. The frame comes from the universities, and has each student’s
last known address and phone number. Since recent graduates are highly mobile, many are no longer at
their last address. If auxiliary data also include the name and address of the parents, the interviewer can
trace the student by contacting them. A key consideration during tracing is ensuring that interviewers do
not give out confidential information.
9.4 Conducting Interviews
Once all data collection activities have been planned, manuals prepared, staff hired and trained, listing
and any preliminary tracing performed, the interviews must be conducted. This step involves more than
simply contacting respondents and asking questions. The interviewer is responsible for:
- preparing and scheduling interviews;
- ensuring that information is collected from the correct sample unit;
- eliciting the respondent’s co-operation to minimise nonresponse;
- asking the questions and recording answers accurately to avoid errors;
- editing responses;
- adhering to all security procedures to ensure data confidentiality.
In addition to these tasks, the interviewer or other data collection personnel are responsible for:
- following-up edit failures and nonresponse;
- coding the data (if questionnaires are not fully pre-coded);
- controlling documents (tracking forms as they go through the process, for example, the number of
questionnaires mailed out, returned, outstanding, etc.);
- monitoring the quality of data collection.
The following sections 9.4.1 - 9.4.8 discuss how to prepare and schedule interviews and interviewing
techniques including: introductory techniques, how to use the questionnaire, how to probe for answers, how
to end the interview, deal with refusals and other delicate situations, and proxy interviewing. Monitoring the
quality of data collection is discussed in section 9.5.
Editing and coding data are discussed in Chapter 10 - Processing.
9.4.1 Preparing and Scheduling Interviews
The interviewer is more efficient and effective when he or she has planned the working day, scheduled calls
or visits and is thoroughly familiar with the survey’s questionnaire, control forms and materials. The
following are some guidelines for an interviewer to organise his or her assignment:
199.
DATA COLLECTION OPERATIONS
STATISTICSCANADA
187
i. Organising time
The interviewer who organises work daily knows exactly how many calls he or she intends to make. The
interviewer should allow enough time between calls to complete the necessary notes made during the
interview and to complete editing required for paper questionnaires.
ii. Entering comments
The interviewer should enter any comments on the appropriate computer screen or questionnaire space.
He or she should include information such as: the best time to call the respondent, what type of follow-up
action has been agreed upon and when it is to be completed, and the name of the best or most
knowledgeable person to talk to.
iii. Making appointments
The interviewer should always have a calendar or diary on hand to book interviews and should enter the
appointment on the appropriate computer screen or questionnaire. The interviewer should not write the dates
and times of scheduled appointments on scraps of paper where they are likely to get lost.
When scheduling interviews, the interviewer should keep the following in mind:
a. When contacting a household, avoid very early or very late calls. Many people do not like to be
telephoned late in the evening or answer the door after dark (some respondents are frightened by
knocking on the door in the evening). For personal interviews, the interviewer may leave the
introductory letter in the mailbox, along with a personal note saying when the interviewer plans to
return or a phone number where the respondent can call the interviewer to confirm or re-schedule the
interview. If the interviewer happens to disturb someone’s mealtime, an apology goes a long way to
encourage a positive reaction by the respondent.
b. Business respondents are often busy when the interviewer first calls, so it may be necessary to
schedule a convenient time, or leave a phone number where the respondent can call the interviewer
back to schedule a time. The respondent should not have any difficulty reaching the interviewer; the
interviewer should provide a phone number where he or she can always be reached or state times
when the interviewer is unavailable.
c. If the respondent is unavailable when the interviewer first calls, then the interviewer should establish
friendly relations with the person who answers the call, and determine the best time to contact the
respondent.
d. If unable to contact a respondent, the interviewer should call on a different day and at a different
hour. For personal interviews, after the interviewer has called twice and still cannot locate the
respondent, he or she may try asking a neighbour about the best time to find someone at the selected
dwelling. Most personal interview surveys at Statistics Canada require that at least three attempts be
made; telephone surveys can require up to ten attempts.
9.4.2 Introductory Techniques
At the start of the interview, it is important that the interviewer establish a good relationship with the
respondent. The first impression the interviewer makes greatly influences the interview's outcome. To
200.
SURVEY METHODS ANDPRACTICES
STATISTICS CANADA
188
create the best impression, it is vital to project a professional yet friendly image. This will help establish a
rapport that will encourage the respondent to provide complete and accurate answers.
The foundation of a good interviewer-respondent relationship begins with the introduction. The
introduction should be brief (especially on the phone) and sincere. The introduction should include:
- the interviewer’s name and the name of the organisation;
- the name and purpose of the survey;
- how the data are to be used (to establish the importance of the survey);
- the authority under which the data are collected;
- an assurance of confidentiality.
For personal interviews, an introductory letter and/or a brochure about the survey delivered before the
interview is conducted is a good way to introduce and establish the legitimacy of the survey. At the time
of the interview, respondents then remember having received something about the survey. When visiting
a respondent, the interviewer should carry and present his or her interviewer’s identification card.
Establishing a good rapport at the outset is critical to the success of the interview. The interviewer must
listen to and be prepared to answer the respondent’s questions (The interviewer’s manual should contain
answers to the most common questions.). If the respondent is reluctant to continue, the interviewer should
try to determine the respondent’s main concerns and deal with them. Concerns expressed may be one of
the following:
i. Why did you pick me?
Providing a simple explanation about random selection will assure respondents that they have been
selected by chance and that their responses are important because they actually represent others in the
population.
ii. Who is going to see my data? How will you use my answers?
The main concern here is confidentiality regarding the information that the respondent may provide. The
interviewer should tell the respondents that their answers will be aggregated with others and only be used
to produce statistical tables or aggregate (summary) results. The statistical tables may help policy and
decision makers to consider whether the situation addressed by the survey is satisfactory or whether some
action is required.
iii. I do not have the time right now.
The interviewer must be honest about the length of the interview. The interviewer should approach each
interview as if it will take place immediately. The interviewer should never assume the respondent is too
busy. If, however, the respondent cannot do the interview immediately, the interviewer should suggest an
alternative time and make a firm arrangement to reschedule the interview. Some respondents will refuse
to participate if they do not clearly understand the importance of the survey and the uses of the data. The
interviewer should be sure that these are clearly explained in the introduction.
9.4.3 Using the Questionnaire
The data collected from all interviews must be collected in a uniform manner. This means that all
respondents must be asked the same questions in the same way. The following guidelines demonstrate
how to use the questionnaire to collect consistent data:
201.
DATA COLLECTION OPERATIONS
STATISTICSCANADA
189
i. Questions should be asked exactly as worded
Research has shown that even inadvertent or very slight word changes can change the response obtained.
ii. Questions should be asked in the order presented
Question sequence is planned for continuity. The sequence is also arranged so that early questions do not
adversely affect the respondent's answers to later questions.
iii. Every applicable question should be asked
Sometimes the respondent, in answering one question, also answers another question that appears later in
the interview. Still, it is important that the interviewer ask the later question when it comes up. In this
situation, he or she might say, You have already told me something about this, but . . . This indicates that
the interviewer is aware of the earlier response and is asking for the respondent's co-operation to answer
the question again.
iv. Questions should be asked in a positive manner
Some interviewers feel uncomfortable when asking certain types of questions and adopt an apologetic
attitude, for example: You might not want to answer this question, but . . .or This question probably will
not make much sense to you . . .Such statements negatively affect the flow of the interview and have a
tendency to change the respondent's answers. By asking the question using a positive or neutral tone, the
message relays to the respondent that this is just another question, and it can be answered without fear of
judgement from the interviewer.
v. Delays between questions should be explained, especially during telephone interviews
Some answers take longer to record than others. The interviewer can explain this to the respondent by
saying: Please excuse the delay, I am writing down/entering the information you gave me.
vi. Questions that are misunderstood or misinterpreted should be repeated
Questions should be designed to be understood by all respondents, and most of the respondents will
understand them (if the questionnaire is well designed). Occasionally, however, a respondent may
misunderstand or misinterpret the question. When this happens, the interviewer should repeat the question
as it is written. If the response is still not appropriate, the interviewer may have to probe (see section
9.4.4).
vii. Skip patterns deserve special attention
A filter or skip question determines whether subsequent questions are applicable and directs the flow
through the questionnaire. The interviewer must pay particular attention to filter questions and watch for
‘instructions to interviewer’ on the questionnaire. Skip patterns are programmed for computer-assisted
interviewing (CAI); however, the interviewer should still become familiar with the flow patterns.
viii. A neutral attitude towards information received should be maintained
Respondents may provide what they consider to be socially acceptable answers if they perceive that the
interviewer is judging them. The respondent must not feel that some answers are more acceptable than
others. Nothing in the interviewer’s words or manner should imply criticism, surprise, approval or
202.
SURVEY METHODS ANDPRACTICES
STATISTICS CANADA
190
disapproval, agreement or disagreement with the respondent’s answers. The interviewer has to accept the
respondent’s answer if it falls within the range of acceptable answers.
For more on questionnaire design and response errors, see Chapter 5 - Questionnaire Design.
9.4.4 Probing
Probing is a technique used when the interviewer recognises that the answer fails to meet the objective of
the question. The respondent may not know the answer, or may misunderstand or misinterpret the
question, resulting in an answer that is incomplete, unclear or inconsistent with other information. When
this happens, interviewers must formulate a neutral type of probe to elicit the needed information.
Before probing, the first step is to repeat the question as worded in case the respondent simply did not
hear the question. When the interviewer needs to clarify the question, the definitions provided should be
used. If this fails to generate a satisfactory response, then a neutral statement can be used to ask for more
information, such as:
I am not sure what you mean by that…
or
Could you tell me a little more?
or
Anything else?
The interviewer may also be able to help the respondent by focussing on the correct response category:
Which figure would you say comes closest?
or
Is it greater than, or less than…? (for numerical responses)
or
Was it spring, summer, fall, or winter?
It is possible to rephrase the question, but this must be done very carefully. The questions should not be
rephrased to suggest an answer. For example, if the question is How many weeks did you work last year?
it should not be rephrased as Did you work all year?. It could be rephrased as Did you work last year?
and if so For how many weeks?.
9.4.5 Ending the Interview
The final step of the interview process is to ensure that all the necessary information has been received
and is legibly recorded. At the end of each interview, the interviewer checks over the questionnaire
thoroughly and performs any necessary edits. He or she may not have enough time to do this in the
respondent's presence. Therefore, it is important to thank the respondent courteously for all the
information, but leave an opening for a future follow-up call if any clarification is required. The
interviewer should offer to answer any questions the respondent may still have about the survey. It is
important that the respondent feel that his or her time was well spent and that, by participating in the
survey, he or she made an important and worthwhile contribution.
203.
DATA COLLECTION OPERATIONS
STATISTICSCANADA
191
9.4.6 Refusals and Other Delicate Situations
When a respondent refuses to participate it is usually due to a lack of information about the survey or the
statistical agency, or due to bad timing. The following guidelines can be used to help interviewers prevent
or deal with refusals or other delicate situations:
i. For information obtained from businesses and institutions, the survey manager should ensure that
the appropriate person within the organisation is contacted at the appropriate time and that the
information is easily available. Whenever feasible, such respondents should be allowed to provide
the data using a method and format that are convenient for them.
ii. If the timing of the interview is bad, the interviewer should apologise (rather than risk a refusal)
and suggest a call-back time.
iii. It may be possible to negotiate with a reluctant respondent. The interviewer may suggest that the
respondent try a few questions; once the interview gets started, the respondent may decide to
continue. As a matter of courtesy, a respondent who might otherwise become a complete refusal
should be made aware that he or she can refuse to answer individual questions.
iv. When faced with an adamant and vocal refusal, the interviewer should withdraw politely and
report the incident to his or her supervisor for follow-up. Persisting with the interview may
jeopardise the supervisor's success of converting a refusal.
v. Avoid asking the respondent to supply answers in front of others. If the respondent would prefer,
the interviewer should arrange to call back at a better time, or arrange for a private spot for the
interview.
vi. If there is a language difficulty and the respondent does not mind using an interpreter, a family
members can sometimes be used to interpret each question and response.
vii. If a respondent is suffering personal hardship such as a serious illness or bereavement, the
interviewer must assess the situation and decide whether to proceed with the interview, arrange
for a convenient call-back time or terminate the interview if there is no chance of success or if it
would be insensitive to continue.
viii. Contacting a respondent who lives in high-rise apartments is sometimes a problem, because the
intercom is a poor way to request an interview. The interviewer may try to establish contact with
the superintendent, landlord or owner of the building to explain the purpose of the visit and
request permission to enter the building, thereby allowing a face-to-face introduction.
ix. The interviewer must never argue with or threaten a respondent, either directly or by implication.
Reliable and complete information requires willing co-operation. The interviewer must never
embark on controversial topics of conversation, such as politics.
x. The interviewer must never resort to unethical practices to conduct an interview. If the respondent
is not at home, the interviewer (having identified him or herself) may ask a neighbour when a
good time might be to call back. But the interviewer should be careful to avoid raising any
suspicion and should limit their questions to when to contact the respondent.
204.
SURVEY METHODS ANDPRACTICES
STATISTICS CANADA
192
xi. Last but not least, the interviewer should remember his or her personal rights. If threatened with
abuse, verbal threats, physical harassment or violence, the interviewer should withdraw
immediately and report the incident to his or her supervisor.
9.4.7 Proxy Interviewing
For some surveys, information for an absent respondent can be obtained from another knowledgeable
person – this is known as a proxy response. Proxy response is only suitable for surveys collecting facts
generally known to persons other than the intended respondent and therefore is not usually appropriate for
sensitive, personal or opinion questions.
During training, the interviewer should be told if proxy interviewing is allowed, and if so, who are
acceptable proxy respondents. Unless told otherwise, the interviewers should assume that interviewing is
to be non-proxy. In non-proxy situations with language difficulties, with the permission of the respondent,
other household members can still be used as translators.
Non-proxy interviewing generally requires more effort than proxy interviewing and achieves a lower
response rate. The interviewers should remember that the number of call-backs and appointments needed
to secure non-proxy interviews should be carefully planned to avoid response burden and to control
survey costs.
9.4.8 Keys to Effective Interviewing
The following are keys to effective interviewing:
i. Confidence
The interviewer must have confidence in his or her abilities. This is only possible with a good
understanding of the survey and the interviewer’s role.
ii. Listening skills
The interviewer should wait for the respondent to finish speaking before he or she stops listening. The
interviewer can indicate that he or she is listening with an occasional Yes, I see. However, the interviewer
should not make assumptions about what a respondent is going to say, or try to finish a sentence. It is
better to ask questions if the interviewer feels that the respondent or the interviewer missed a point.
iii. Empathy
The interviewer should be sensitive to a respondent’s situation at the time of the call or visit. If the
respondent describes a personal incident, the interviewer should show interest (but never pass judgement),
then try to refocus the respondent back to the interview.
iv. Speech
Vocal expression is important, and particularly so in telephone interviewing. The interviewer should
speak very clearly, and try to speak at a moderate speed. If the interviewer speaks too quickly,
respondents could miss parts of a question. Speaking too slowly causes respondents to begin answering
before the interviewer has finished the question. Lowering the head lowers the pitch of the voice. A lower
205.
DATA COLLECTION OPERATIONS
STATISTICSCANADA
193
pitch voice is clearer and carries better, particularly on the telephone. The proper speed and pitch should
be demonstrated during training.
v. Know the questionnaire
The interviewer must know the questionnaire, concepts and terminology used by the survey. There will
not be time during an interview to look up definitions or answers to questions in the manual. Nothing
breaks the rapport more quickly than long pauses, especially in telephone interviews.
9.5 Monitoring Quality and Performance
For computer-assisted interviewing (CAI) surveys, the interviewer assignment management as well as the
overall monitoring of progress and many quality and performance indicators are automated by computer
software. The quality and performance measurements are part of the CAI programming, however the
principles are the same as those for paper based surveys. This section uses the requirements for paper-
based surveys to illustrate the necessary controls to be used for any survey. For more detail, see
Appendix B - Quality Control and Quality Assurance and Chapter 10 - Processing.
9.5.1 Monitoring the Quality of Data Collection
The quality of data collection should be monitored by the supervisor in the following ways:
i. Close supervision of interviewers
The supervisor listens to live interviews, particularly for new interviewers and in the early stages of
collection, to ensure that the questionnaire is being used properly and that the interviewing techniques are
effective and consistent across interviewers. Since interviewers can provide valuable feedback regarding
data collection procedures and questionnaire design, they should be encouraged to suggest improvements
to the survey.
ii. Checking (or spot-checking) completed questionnaires
This ensures that interviewer field edits are applied correctly and that missing information can be
obtained from respondents, in a timely way, while the survey is still in the field. The supervisor’s edit
checks can also provide survey management with an advance warning of the types of edit failures to
expect during the computer edit stage after collection.
iii. Monitoring quality and performance measures
This is discussed in detail in 9.5.3. These measures provide an indication of quality as data collection
progresses. By spotting and addressing problems early on, the supervisor can manage data collection so
that target response rates and other quality indicators are achieved or exceeded.
iv. Strict document control
Every questionnaire must be accounted for at each stage of data collection with such entries as ‘date
received from interviewer’, ‘date sent to tracing’, ‘date sent to keying’, etc. The supervisor’s sample
control form (with its link to individual interviewer identifiers) is the key to effective sample and
document control. While interviewers can report their assignment’s progress on paper, automation of the
206.
SURVEY METHODS ANDPRACTICES
STATISTICS CANADA
194
overall sample control is recommended in order to simplify the supervisor’s job. At the end of collection,
every questionnaire must receive a final status code (e.g., completed, refusal, etc.).
v. Debriefing interviewers
Debriefing survey staff at the end of data collection can uncover problems with the data collection
process. Such problems can be important inputs for post-collection processing (i.e., identifying post-
collection edits that need to be performed). Improvements can also be made to the Management
Information System, public relations campaigns, etc. in the case of repeated surveys.
vi. Tracking changes made to the data
The survey manager may want to track changes made to the data during subsequent survey processes. The
frequency of post-collection edit failures and the number and type of corrections applied to the data may
provide useful information regarding quality, that can serve as signals that collection procedures or tools
should be changed in future survey cycles.
9.5.2 Interviewer Assignment Management
Periodically throughout collection (usually once a week), the interviewer is required to report on the
status of the whole assignment on an assignment control sheet. Sample units that have yet to be contacted
or are still in progress are assigned a status of ‘pending’ (further broken down into ‘not attempted yet’ and
‘attempted’). Sample units that have been dealt with to the best of the interviewer’s ability, are assigned a
‘resolved’ status code of:
i. Complete: A fully completed interview has been obtained.
ii. Partially complete: The respondent did not complete the whole questionnaire but did answer the
key questions. Before going out onto the field, key questions are identified as the minimal set of
responses constituting a usable questionnaire.
iii. Incomplete/Total nonresponse by reason of:
- refusal;
- absent for the duration of survey period;
- unable to trace;
- out-of-scope (e.g., deceased, out-of-business, dwelling demolished);
- temporarily out-of-scope (e.g., vacant dwelling);
- no contact (e.g., no one home).
Refusals and ‘unable to trace’ may be referred to follow-up. Assignment summary reports monitor the
total number of sample units in each category. In addition to providing weekly summary reports,
interviewers forward to the regional office on a weekly basis all resolved questionnaires, to allow timely
follow-up of refusals and timely data capture.
9.5.3 Monitoring by Supervisors
Performance and quality targets are established at the outset of data collection. Supervisors should
monitor and manage their operations, both on an interviewer assignment basis and overall, to ensure the
targets are met.
207.
DATA COLLECTION OPERATIONS
STATISTICSCANADA
195
The performance target is based on the proportion of resolved records:
pending)resolved(i.e.,sampletotal
unitsresolvedofnumber
rateresolved
+
=
This rate provides an indication of the amount of an interviewer’s scheduled work that has been
completed. The weekly resolved rate is compared to the target rate to ensure that the survey can be
completed on time. Expenditures are usually incorporated into this assessment to determine whether the
survey can remain within its budget. Two common cost-performance measures are cost per resolved unit
and budget left per unresolved unit.
Another performance indicator is the response rate. The effects of non-response are covered in Chapter 3
- Introduction to Survey Design and Chapter 7 - Estimation. For most surveys, non-response is a
significant contributor to nonsampling error (in the form of bias) and sampling error (which results in a
loss in precision in the estimates). The quality target is based primarily on the response rate, which at
collection can be calculated as follows:
unitsunresolvedunitsscope-inresolved
partial)complete(i.e.,unitsrespondingofnumber
rateresponse
+
+
= 1
For example, suppose a sample of 1000 units is selected and 800 are resolved (complete, partial, refusal,
out-of-scope, etc.) after one week of data collection. Of the resolved units, 700 are in-scope for the
survey. Of the in-scope units, 550 respond to the survey (either complete or partial response). Then, the
response rate after the first week of the survey is 550/(700+200)= 61.1%.
Sometimes an adjustment factor is applied to the unresolved units to take account of the fact that some
would be out-of-scope if they were resolved. In the above example, this would mean that of the 200
unresolved units, approximately 175 would likely be in-scope (assuming the same proportion as for the
resolved units). Therefore, the adjusted response rate would be 550/(700+175) = 62.9%.
Besides response rates and the proportion of resolved records, supervisors should also monitor other
indicators for signs of potential quality problems. High refusal or no-contact rates on an assignment basis
could indicate problems with a particular interviewer. If certain codes (particularly ‘vacant’) occur more
frequently for some interviewers, this could also indicate a problem (e.g., were the dwellings truly vacant,
or were the residents temporarily absent? The interviewer may not know how to distinguish between the
two). Across the whole sample, high refusal rates indicate public resistance that could make it difficult to
achieve the desired data quality in the time and budget allowed. A higher than expected number of ‘out-
of-scopes’ could indicate frame problems. In the case of business surveys, large businesses may be
monitored separately since these can influence the final survey estimates.
For information on Statistics Canada’s Standards and Guidelines for measuring nonresponse, see
Standards and Guidelines for Reporting of Nonresponse rates (2001).
9.5.4 Advanced Techniques for Measuring Quality
For many surveys, response rates in combination with some of the other measures discussed above are the
only indicators of the quality of data collection. For very large repeated surveys it is possible to design
1
This is equivalent to the total number of units in the sample minus the number of out-of-scope units.
208.
SURVEY METHODS ANDPRACTICES
STATISTICS CANADA
196
experiments to attempt to measure the extent of the bias introduced by data collection activities. The most
common of these studies are:
Listing checks: Were all in-scope units in the PSU listed? Were all in-scope members of a household
listed? Was there any duplication? What are the characteristics of missing or duplicated units? This is an
attempt at measuring coverage errors.
i. Vacancy checks
Were units listed as vacant (or out-of-scope) really vacant or were they misclassified? What are the
characteristics of the misclassified units? This attempts to measure frame undercoverage.
ii. Reinterview to measure response errors
A subsample of respondents are reinterviewed, by a different interviewer (sometimes a supervisor) to
determine whether the original responses to key questions are correct. Reinterview responses are
compared to original responses. Some or all cases, where responses are different, are reconciled to
determine which were correct.
iii. Nonresponse follow-up study
A special study on nonresponse may be performed to evaluate bias caused by total nonreponse through
special follow-up interviews done with survey nonrespondents (i.e., try to obtain responses from a subset
of nonrespondents).
Since their objective is to measure bias due to nonsampling error, these studies are complex – and
potentially costly – surveys in their own right, which must be designed according to principles discussed
in earlier chapters.
See Chapter 3 - Introduction to Survey Design for more information on nonsampling error.
9.6 Summary
This chapter showed how data collection operations can be organised, with various levels of
responsibilities, organisation, and control. Special attention was paid to the respective roles of the
supervisor and the interviewer. Public relations issues were addressed, including survey publicity
campaigns, respondent relations and general public relations. Data collection preparations, such as
relevant manuals, interviewing hiring and training, listing, tracing and frame updates, as well as
interviewing techniques were covered. Finally, methods of monitoring quality and performance were
examined.
To ensure that the survey data collected are as complete and accurate as possible, the following guidelines
should be observed:
i. Interviewers are critical to the success of interviewer-assisted surveys. Those hired should have
the required abilities and personal qualities and the appropriate training and tools.
209.
DATA COLLECTION OPERATIONS
STATISTICSCANADA
197
ii. Data collection procedures should be applied consistently across all sampled units and these
procedures should be as error-free as possible: all interviewers should receive the same training
and manuals, all coders should receive the same instructions, etc.
iii. Appropriate sample control procedures for all data collection operations should be put into place.
Such procedures track the status of questionnaires from the beginning through to the completion
of data collection and data entry.
iv. To optimise response rates and the quality of the information obtained from businesses and
institutions, the survey manager should ensure that the appropriate person within the organisation
is contacted at the appropriate time for the information to be easily available. Whenever feasible,
such respondents should be allowed to provide the data using a method and format that are
convenient for them.
v. Effective control systems should be established to ensure the security of questionnaires and the
transmission of data from regional to head offices.
vi. A Management Information System to track quality measures as well as expenditure and other
performance measures during data collection should be implemented.
vii. The survey manager may want to track changes made to the data during subsequent survey
processes. The frequency of post-collection edit failures and the number and type of corrections
applied to the data may provide useful information regarding quality that can serve as signals that
collection procedures or tools should be changed in future survey cycles.
Bibliography
Cialdini, R., M. Couper and R.M. Groves. 1992. Understanding the Decision to Participate in a Survey.
Public Opinion Quarterly, 56: 475-495.
Couper, M.P. and R.M. Groves. 1992. The Role of the Interviewer in Survey Participation. Survey
Methodology, 18(2): 263-277.
Statistics Canada. 2001. Standards and Guidelines for Reporting of Nonresponse Rates.
Statistics Canada. 1995. Survey Interviewing Skills: A Guide to Successful Interviewing. 12F0047XPE.
Statistics Canada. 1996a. Policy on Informing Survey Respondents. Policy Manual. 1.1.
Statistics Canada. 1998. Statistics Canada Quality Guidelines. 12-539-XIE
210.
E L EC T R O N I C P U B L I C A T I O N S
A V A I L A B L E A T
www.statcan.gc.ca
211.
STATISTICS CANADA
199
Chapter 10- Processing
10.0 Introduction
Processing transforms survey responses obtained during collection into a form that is suitable for
tabulation and data analysis. It includes all data handling activities – automated and manual – after
collection and prior to estimation. It is time-consuming, resource-intensive and has an impact on the
quality and cost of the final data. It is therefore important that it be well planned, the quality of its
implementation monitored and corrective actions taken when required.
The extent and order of the processing activities depend, among others, on the nature of the data that are
collected, the collection method, the survey budget and objectives in terms of data quality. Coding, for
instance, can occur before or after data capture while editing typically occurs throughout the survey. The
following is an example of processing activities for a paper questionnaire:
i. After collection, check the data on the questionnaire. This step ensures that all necessary
information has been received and legibly recorded, that interviewer notes have been reviewed
and some preliminary edits performed to check for gross errors and inconsistencies.
ii. Code any data on the questionnaire that requires coding (e.g., written answers to open questions).
iii. Capture the data electronically into a computer. Data capture may be followed by more coding.
iv. Perform detailed editing, then imputation. Questionnaires that fail one or more checks are put
aside for further examination, either for follow-up with the respondent, or for imputation.
v. Perform outlier detection to identify suspicious or extreme values.
vi. Store the data on a database to facilitate data manipulation during the post-processing activities.
In order to streamline processing, several of the above activities – namely, capture, editing and coding –
may be combined through automation using computer-assisted collection methods.
Since errors are likely to occur at each stage of processing – particularly for those manual and repetitive
activities such as coding, capture and editing – processing should be monitored and corrective actions
taken when necessary in order to maintain or improve quality. This is done by implementing quality
control and quality assurance procedures.
The purpose of this chapter is to cover the main processing activities: coding, data capture, editing,
imputation, outlier detection and treatment and creating a database. For details on quality assurance and
quality control, see Appendix B - Quality Assurance and Quality Control.
10.1 Coding
Coding is the process of assigning a numerical value to responses to facilitate data capture and
processing in general. As stated in Chapter 3 - Introduction to Survey Design, coding entails either
assigning a code to a given response or comparing the response to a set of codes and selecting the one that
best describes the response.
212.
SURVEY METHODS ANDPRACTICES
STATISTICS CANADA
200
Difficulties in determining a set of response categories to a question was discussed in Chapter 5 -
Questionnaire Design. In the case of closed questions, the response categories are determined before
collection, with the numerical code usually appearing on the questionnaire beside each response category.
For open questions, coding occurs after collection and may be either manual or automated. Manual
coding requires interpretation and judgement on the part of the coder, and may vary between coders.
When determining the coding scheme, the goal should be to classify responses into a meaningful set of
exhaustive and mutually exclusive categories that bring out the essential pattern of responses. For some
questions, coding may be straightforward (e.g., marital status). In other cases, such as geography, industry
and occupation, a standard coding system may exist. But for many questions no standard coding system
exists and determining a good coding scheme is a nontrivial task. The coding scheme should be consistent
and logical and take into account how detailed the codes should be in light of the purpose of the survey
and tabulations or data analysis to be performed. It is best to start with a broad list, since too few
categories can be misleading and a large other category can be uninformative. Categories can always be
collapsed but it is difficult to split categories after the fact.
As mentioned in Chapter 5 - Questionnaire Design, the type of interview should be considered when
determining the response categories for a closed question. For a self-enumeration survey, supplying a list
of 50 categories on paper to respondents is feasible (though not ideal); for a telephone interview, listing
50 response categories over the telephone is impractical. To simplify coding, ideally all questions on a
questionnaire would be closed with a short list of response categories. In practice, this is not always
possible and sometimes open questions are necessary.
10.1.1 Pre-coding Closed Questions
The response categories for closed questions can be pre-coded on the questionnaire. For paper
questionnaires, boxes for codes can be placed either next to the item to be coded or down the margin of
the questionnaire. This greatly improves the efficiency of data capture after collection: instead of typing
in the selected response category, a numeric code is captured (numerical codes are also easier to analyse
than strings of words). With computer-assisted collection methods, the codes are automatically captured
when the interviewer or respondent selects an answer.
For example, the following coding system was used for the 2002 Public Service Employee Survey:
In the past three years how many promotions have you had?
none
one
more than one
The benefits of closed questions were discussed in Chapter 5 - Questionnaire Design. The main benefits
are that they are less burdensome to respondents, and data collection, capture and analysis are cheaper,
faster and easier than for open questions. One disadvantage of closed questions is that the respondent’s
natural wording is unknown. This can make it difficult to verify the quality of the coding. For example, if
an open question were used to determine a person’s occupation, the respondent’s description of his or her
work could lead to a different occupation code than if the respondent or interviewer were to select from
amongst a choice of occupational codes provided by a closed question.
213.
PROCESSING
STATISTICS CANADA
201
10.1.2 ManualCoding of Open Questions
When manually coding open questions, the coder (typically after collection) must read, interpret and
manually convert a written response to an open question into a numeric code. This numeric code is then
either recorded on the questionnaire or entered into a computer. In order to assign a code, the coder may
simply be required to note whether the answer contains a key word or reference to a particular item.
Sometimes, coding is based on the answer to only one question, sometimes it is based on the answer to
several related questions. In this case, the quality of the coding depends very much on the clarity and
completeness of the written response and how well the initial editing was done, the soundness of the
coding scheme and the skill of the coder.
Coders must be trained carefully since applying the coding scheme requires taking into consideration the
following:
- the number of possible answers;
- complexity (judgement);
- possible ambiguity in the response (i.e., the quality of the response).
Variability between individual coders is inevitable. A detailed check of a coder’s first batch of
questionnaires should be performed to detect mistakes and identify whether or not further training is
required. After that, periodic checks should be done on the quality of the coding and corrective action
taken if required. This is often done using quality control methods (see Appendix B - Quality Assurance
and Quality Control).
10.1.3 Automated Coding of Open Questions
Traditionally, coding open questions has been a manual operation. However, due to advances in
technology, resource constraints and, most importantly, concerns about timeliness and quality, coding is
becoming more and more an automated process.
In general, two files are input to an automated coding system. One file contains the survey responses that
are to be coded, referred to as the write-in file. The second file is called the reference file and contains
typical written responses (or phrases) and their corresponding numeric codes.
Most often, the first step of automated coding is parsing. Parsing is the process of standardising a phrase
in order to allow the computer to recognise equivalent phrases. Parsing usually consists of the removal of
extraneous characters, such as punctuation, and the removal of double words, trivial words, certain
suffixes and prefixes, etc. Both the survey write-in files and the reference file are parsed before
continuing.
The next step involves, for every write-in in the survey file, a search of the reference file for an exact
match. If found, the code in the reference file is copied to the survey file and the record1
is considered
coded. However, if an exact match cannot be found, an attempt can be made to find the closest match
possible among the reference file records. Every record on the reference file is assigned a score, which is
a measure of how similar the reference file phrase is to the survey response. Scores are evaluated based
on predetermined parameters (which are specified to reduce the risk of making an error) and if a close-
enough match is found, the code is transferred to the survey response and the record is considered coded.
1
In this chapter, questionnaire generally refers to the hard-copy document whereas record refers to the electronic
version of the completed questionnaire.
214.
SURVEY METHODS ANDPRACTICES
STATISTICS CANADA
202
Sometimes several reference file records are found with similar scores and sometimes no reference file
record is found to be close to the survey response. In these situations, the records are generally sent to a
small manual coding operation staffed with expert coders who are responsible for coding any records left
uncoded at the end of the automated phase and for quality control of the output of the automated system
(see Appendix B - Quality Assurance and Quality Control).
10.2 Data Capture
Data capture is the transformation of responses into a machine-readable format. With paper-based
collection methods, capture occurs after collection (usually after the questionnaire has been groomed and
some preliminary edits have been performed). For example, data capture might consist of a clerk (referred
to as a keyer) manually typing into a computer the reported values on the questionnaire. With computer-
based collection methods, capture occurs at the time of collection.
There are several ways to improve the efficiency of data capture. One is to use computer-assisted data
collection methods. The main benefit of computer-assisted methods is that collection and capture are
combined, resulting in an integrated, faster and more efficient data collection and capture process than
paper-based methods. One disadvantage of computer-assisted methods is that the software programs
require extensive development and testing. (For more on the advantages and disadvantages of computer-
assisted data collection, see Chapter 4 - Data Collection Methods.)
For paper-based collection methods, pre-coding closed questions can greatly improve the efficiency of
manual data capture. Another option is to optically scan completed questionnaires. Optical scanning
works best for closed questions and is less reliable at capturing answers to open questions. Scanning can
reduce data capture errors compared to manual capture, but scanning errors do occur and should be
evaluated and minimised. In the case of long questionnaires, the logistics of optical scanning are more
cumbersome: staples have to be removed, questionnaire identifiers added to every page, scanners reset to
read in different pages, etc. Another option is to have all answers coded on a single sheet of paper. This
simplifies scanning but it can be burdensome for the interviewer to read a question from one sheet of
paper and record it on another. It also limits questions to closed questions and on a large sheet full of
answer boxes, it is easy for the interviewer to code the wrong answer or to code the answer in the wrong
answer box. Finally, it is difficult for the interviewer to refer back to an answer given by the respondent
since the questions and answers are in different places.
With paper-based collection methods it is particularly important that quality assurance and quality control
procedures be implemented to minimise and correct errors introduced during data capture (see Appendix
B - Quality Assurance and Quality Control).
10.3 Editing
In an ideal world, every questionnaire would be completed without any errors. Unfortunately, responses
to some questions may be missing, incomplete or incorrect. Editing is the application of checks to
identify missing, invalid or inconsistent entries that point to data records that are potentially in error.
Editing usually identifies nonsampling errors arising from measurement (response) errors, nonresponse or
processing. The purpose of editing is to:
- better understand the survey processes and the survey data;
- detect erroneous or missing data;
- follow-up with the respondent;
215.
PROCESSING
STATISTICS CANADA
203
- senda record to imputation;
- delete a record.
In order to identify erroneous records, edit rules are applied. Some examples of edit rules are:
- each question must have one and only one response;
- the valid responses for Question X are 1 or 2;
- the sum of the parts for Question X cannot be less than the response to Question Y.
Editing can occur at several points throughout the survey process and ranges from simple preliminary
checks performed by interviewers in the field to more complex automated verifications performed by a
computer program after the data have been captured. In general, edit rules are based upon what is
logically or validly possible, based upon:
- expert knowledge of the subject matter;
- other related surveys or data;
- the structure of the questionnaire and its questions;
- statistical theory.
Subject matter experts should be knowledgeable of how variables relate to one another and what answers
are reasonable. Such individuals are instrumental in specifying what types of rules are appropriate.
Typically, they are analysts who have experience with the types of data being edited. For example, a
transportation analyst may be aware of the acceptable range of values for fuel consumption rates for
various makes and models of vehicles. Analysis of other surveys or datasets relating to the same sorts of
variables as the ones being edited can be useful in establishing some of the edit rules.
Equally important, the layout and structure of the questionnaire have an impact on the edit rules. Edits
should verify that responses respect the logical flow of the questionnaire. This is often manifested through
the use of go to or skip instructions which imply that certain questionnaire items do not apply to certain
categories of respondents and therefore the respondent is to skip to another question.
There are three main categories of edits: validity, consistency and distribution edits. Validity and
consistency edits are applied one questionnaire at a time. Validity edits verify the syntax of responses and
include such things as checking for non-numeric characters reported in numeric fields and checking for
missing values. The first two examples of edit rules above are validity edits. Validity edits can also check
that the coded data lie within an allowed range of values. For example, a range edit might be put on the
reported age of a respondent to ensure that it lies between 0 and 125 years.
Consistency edits verify that relationships between questions are respected. The third example of an edit
rule above is a consistency edit. Consistency edits can be based on logical, legal, accounting or structural
relationships between questions or parts of a question. The relationship between date of birth and marital
status is one example where an edit might be: ‘a person less than 15 years of age cannot have any marital
status other than never married.’ Consistency edits may also be based on the logical flow of the
questionnaire, for example: ‘if Question X is answered no then Question Y cannot be answered’.
Consistency edits may also involve the use of historical data (e.g., year-to-year ratios). In the case of
household surveys, there may be edits between household members.
Distribution edits are performed by looking at data across questionnaires. These attempt to identify
records that are outliers with respect to the distribution of the data. Distribution edits are sometimes
referred to as statistical edits (Hidiroglou and Berthelot, 1986) or outlier detection. For more information,
see Section 10.5. For a discussion of nonsampling errors, see Chapter 3 - Introduction to Survey
Design.
216.
SURVEY METHODS ANDPRACTICES
STATISTICS CANADA
204
10.3.1 Edits During Data Collection
Edits during data collection are often referred to as field edits and generally consist of validity edits and
some simple consistency edits. The purpose of editing during data collection is to:
- identify the need for improvement to the collection vehicle;
- identify the need for more training;
- detect obvious errors and perform immediate follow-up with the respondent;
- clean-up entries.
Editing during data collection may be performed by:
- the respondent (in the case of self-enumeration);
- the interviewer during the interview;
- the interviewer immediately after the interview;
- the interviewer’s supervisor;
- clerical staff.
Field edits are used to identify problems with data collection procedures and the design of the
questionnaire as well as the need for more interviewer training. They are also used to detect mistakes
made during the interview by the respondent or the interviewer and to identify missing information during
collection in order to reduce the need for follow-up later on. Editing during collection is considerably
easier to implement when it is automated through a computer-assisted collection method.
For self-enumeration questionnaires, respondents may edit their own answers. In almost all interviewer-
assisted surveys, some editing is performing during the interview and interviewers are instructed and
trained to review the answers they record on a questionnaire immediately after the interview is concluded
– either after leaving the dwelling or after hanging up the telephone. This way they still have an
opportunity to detect and treat records that failed edit rules, either because the correct information may
still be fresh in their mind or because they can easily and inexpensively follow-up with the respondent to
ascertain the correct values. Any edit failures left unresolved are usually dealt with later by imputation.
Another purpose of field edits is to clean-up responses. Often during an interview, the interviewer writes
short notes in the margin of the questionnaire or in the notes section of the CATI application. This may be
because the interviewer does not know the coding scheme for an open question, or he or she may want to
refer to the interviewer’s manual for the interpretation of an answer. In these cases, interviewers edit their
questionnaires after the interview in order to clean-up these notes.
One of the tasks assigned to supervisors is to check the work of their interviewers to detect errors and
then feed this information back to the interviewer. Usually the kinds of failures detected are similar to
those that could be detected by the interviewer immediately after the interview and usually there is still
some opportunity to follow-up with the respondent to determine the correct values. The supervisors
should also be looking for patterns of errors that occur. Lessons learned from one interviewer should be
passed on to the whole team.
In many surveys, completed questionnaires are transmitted by respondents or by interviewers to a
Regional Office for log-in and clerical grooming. This grooming often consists of the same or additional
edits to those carried out by the interviewers or supervisors. Grooming includes deciphering handwritten
answers, interpreting interviewer remarks, standardising measurement scales (e.g., changing a value
reported in feet to metres), etc. It may also involve making sure interviewers have completed all
administrative fields on the questionnaire such as response status codes (e.g., indicating a fully or partially
completed questionnaire). This process provides for a systematic, independent review or edit of the
questionnaire data before they are sent on to data capture. Checking the questionnaire identification codes
217.
PROCESSING
STATISTICS CANADA
205
can bean important element of this exercise since, without complete identification, questionnaires cannot
be logged in or data captured. The degree of editing depends upon the available budget and the extent to
which the clerical staff doing the editing can be expected to identify and resolve difficulties encountered.
Where possible, this kind of editing is combined with any coding, tallying or batching of questionnaire
items that might be required before data capture is started. In some cases, Regional Office staff may
follow-up with the respondent to resolve important edit failures.
10.3.2 Edits After Data Collection
The most comprehensive and complicated edits are generally carried out as a separate edit and imputation
stage after data collection. During data capture, edits can be carried out by keyers or automatically by
computer programs, or by the computer application in the case of computer-assisted collection methods.
For paper questionnaires with manual data capture, it is economical to use data capture as an opportunity
to apply rules to clean the data sufficiently to make the subsequent processing stages more efficient.
Generally, editing during data capture is minimised since responding to an edit failure slows down data
capture. Edits during this stage of processing are mainly validity edits and simple consistency edits.
More complex edit rules are generally reserved for the separate edit stage after data capture – along with
validity edits, more complex consistency edits are often performed along with selective editing and outlier
detection (see section 10.5).
For edit failures after data collection, the usual procedure is to flag the field that failed an edit and then
either impute the field or exclude the record from further processing.
Most edit failures at this stage are flagged for imputation. Values that fail an edit should be flagged with a
special code to indicate that an unacceptable value or invalid blank was reported. These flags are
particularly useful when assessing the quality of the survey data. In some cases, the record or
questionnaire may fail so many edit rules – or a small number of critical edits – that it is rendered useless
for further processing. In such cases, the record is usually treated as a nonrespondent, removed from the
processing stream and a nonresponse weight adjustment performed (see Chapter 7 - Estimation for
details of weight adjustments).
10.3.3 Selective Editing
In editing, there is a trade-off between getting every record perfect and spending a reasonable amount of
resources (i.e., time and money) tidying up the data. Historically, much time and effort has been spent
trying to ensure that any and all survey errors are identified. Not only is over-editing the data a poor use
of resources, but it can lead to biased results. Typically, the data are expected to follow a pre-defined
model and when the data do not follow the model, they are said to fail an edit. If the data are changed
every time an edit fails, this can severely bias the data towards the model and away from the real life
situation. Also, excessive editing and follow-ups with respondents can result in high response burden and
lower the respondent’s co-operation on future occasions.
To avoid spending excessive time and resources editing data that have little impact on the final estimates,
selective editing practices are recommended, particularly for business surveys (i.e., where the population
is skewed and a few businesses dominate the estimates). The selective editing approach is based upon the
idea that only critical edit failures need be treated. Selective editing generally applies to quantitative data.
An example of an application of selective editing is a procedure that modifies individual records
according to their potential impact on the survey estimates or through the analysis of aggregate data.
218.
SURVEY METHODS ANDPRACTICES
STATISTICS CANADA
206
Selective edit failures may result in following-up with the respondent, excluding the record from further
processing or specifying records that require imputation.
The advantages of selective editing include:
- cost savings;
- data quality can be improved by redirecting resources to high impact records or to other activities;
- timeliness can be improved by reducing processing time;
- response burden can be reduced as a result of fewer follow-ups.
The disadvantages of selective editing include:
- less attention is given to the data quality at the level of the individual unit;
- inconsistencies may be left in the data, which may give users the impression of poor data quality;
- the nonsampling error for small domains can be greater than if all questionnaires are individually
edited;
- there may be resistance from data processing clerks, subject matter experts, management or data users
who may have less confidence in the data.
Some selective editing approaches include:
i. Top-Down Approach
With this method, the most influential weighted data values are listed from top to bottom for a given
domain of estimation and examined one by one. Data examination and verification stops when the next
most influential data value does not affect the domain estimate significantly. For example, consider a
sample of five businesses from a population of 100 businesses for a survey that wants to estimate the total
number of employees in the population. The survey’s estimate of the total number of employees is 737.
The analyst feels that this estimate is too high (since he expects the average number of employees per
business to be 3). In order to examine this value, the contribution of each record is examined as a
proportion of the estimate. As can be seen from Table 1, the first record contributes 81.4% to the estimate
of the total. Because of its influence on the estimate, this record is examined more closely. It quickly
becomes evident that the number of employees reported by this company is higher than expected and the
weight is much higher than for other records (perhaps due to a nonresponse adjustment). This record is
consequently treated as an influential observation (see Section 10.5). Since all the other weighted values
contribute only a small proportion to the overall total, they are not examined more closely.
Table 1: Example of Top-Down Editing
Record Number of employees Weight Contribution to Total
1 12 50 81.4%
2 7 8 7.6%
3 3 12 4.9%
4 2 15 3.3%
5 1 15 2.0%
ii. Aggregate Method
With the aggregate method, suspicious domain estimates are identified. The weighted data of all records
belonging to the domain are then examined. For example, for a survey estimating average household size,
if the average household size in a given village is found to be 23, all of the weighted individual records
for that village would be examined to see if there are any values that seem to be substantially higher than
the others.
219.
PROCESSING
STATISTICS CANADA
207
iii. GraphicalMethod
Here, the data are graphed to identify suspicious values. For example, the distribution of the data can be
graphed to identify unlikely tails of the distribution.
iv. Questionnaire Score Method
Berthelot and Latouche (1992) propose the use of a score function, where each respondent is assigned a
score based on some measure of size, the number of suspicious data items on the questionnaire and the
relative importance of the variables. Only records with a high score are examined.
10.3.4 Manual versus Automated Edits
Editing can be automated by means of a computer program. Depending on the volume of editing to be
done (in terms of the number of data items or number of questionnaires), the nature and complexity of the
edit rules involved, the impact of the unit, the importance of the variables and the stage of survey
processing to which the edit rules apply, manual or automated processing may be appropriate. The more
complex the edit rules, the more difficult and error-prone is a manual process. Conversely, for some
surveys (e.g., paper based ones) it is difficult – if not impossible – to incorporate automated edits during
the data collection. Other factors that affect whether or not editing should be manual or automated include
the need to monitor interviews and the need for an audit trail. Editing performed after data capture is,
however, usually automated. A generally accepted principle for this editing phase – and its related
imputation phase – is that it should not require reference back to the individual hard-copy questionnaire
unless absolutely necessary. In other words, the electronic records resulting from data capture should
contain all the necessary information required for the subsequent editing and imputation to be carried out.
10.3.5 Constraints to Editing
Some constraints to editing are:
- available resources (time, budget and people);
- available software;
- respondent burden;
- intended use of the data;
- co-ordination with imputation.
i. Resources (time, budget and people)
In a manual editing environment, the process of editing can be quite labour intensive. It is necessary to:
- develop and document the edit rules to be followed and the actions to be followed when there is an
edit failure;
- train those who are going to do the editing;
- establish a mechanism for supervising and checking the work of those doing the editing (i.e.,
implement Quality Assurance and Quality Control procedures);
- establish a method of evaluating the impact of editing on the original data.
In an automated environment, the implication for time, cost and resources for front-end development can
be enormous. Tasks include:
- developing and documenting the edit rules;
- writing a computer program or adapt a software to identify edit failures;
220.
SURVEY METHODS ANDPRACTICES
STATISTICS CANADA
208
- testing the computer program;
- editing the survey data by running the program.
In either case, it is important to be sure that the investment in editing is worthwhile. It is a waste of
resources to institute an expensive and time-consuming editing strategy to catch a handful of records
whose impact on survey results is negligible. On the other hand, it is risky to have only a rudimentary
editing strategy only to find there are major errors and inconsistencies in the survey responses. How many
records are likely to fail the edit rules? What will be the impact of these failures on the resulting data
quality? Are all the records equally important? These kinds of questions are important but not always easy
to answer. The responses to these questions depend on, amongst other things, how well designed is the
questionnaire, how survey-literate are the respondents and how well-trained are the interviewers.
Often, especially in the case of repeated surveys, it is desirable to analyse the raw (i.e., unedited) survey
data before embarking upon an editing strategy. This allows the statistical agency to assess in advance the
likely volume of edit failures and the kinds of relationships that exist between questions. Editing should,
in fact, be viewed as a continuous process that does not necessarily have a start and a finish. It is a
learning process aimed at constant improvement of the entire survey process over time.
ii. Software
Some specialised software packages exist for editing and imputing survey data (e.g., Statistics Canada’s
Generalized Edit and Imputation System, GEIS, or the Canadian Census Edit and Imputation System,
CANCEIS). Such packages can allow for the use of comprehensive edit rules for a relatively small front-
end investment in systems design. Alternatively, statistical agencies can program their own editing
strategy.
iii. Respondent burden
One of the implications of editing questionnaires is the possibility of follow-up with the respondent to
treat missing or erroneous data. In the vast majority of situations, the respondent is the most accurate
source of information for questionnaire items. However, follow-up is burdensome for the respondent and
costly for the statistical agency. Moreover, there may be a significant time interval between the original
interview and the time of follow-up so that the respondent no longer remembers the correct answer. These
considerations mean that follow-up (as a way of treating edit failures) is generally limited to edits failures
identified during collection or arising from selective editing. Since follow-up after collection is generally
impractical and undesirable, imputation is required.
iv. Intended use of the data
The amount of editing that is performed should depend, to a large extent, on the uses of the resulting data.
Datasets or data items that will be used primarily for qualitative assessments – where decisions will not be
based on precise measurements – may not need to be as rigorously edited as those which will have a
strategic importance in decision making. Moreover, within a given dataset, some items may be much
more important than others and it may therefore be desirable to devote more time and resources to
ensuring that they are clean.
Alternatively, some records in a dataset may carry more importance than others and may contribute
significantly to survey estimates. This is especially true in business surveys where 5% of the companies
may contribute 95% of the total earnings in a given industry. Focussing on the most influential fields or
records is one of the purposes of selective editing (section 10.3.3) and outlier detection (section 10.5).
221.
PROCESSING
STATISTICS CANADA
209
v. Co-ordinationwith imputation
Editing alone is of minimal value if some action is not taken to treat items that fail the edit rules. When
the respondent is not followed up, this corrective action is generally referred to as imputation. The dual
actions of editing and imputation are closely related. It is therefore important to consider how the latter
will be done when developing specifications for the former. In many cases, imputation is done when the
edit failure is detected (before proceeding with the examination of subsequent rules). This approach is
desirable in situations where it is obvious what action should be performed given the nature of the
question or given the answers to related questions. Frequently, however, imputation is performed as a
separate step after all the data have been processed through all the edit rules.
10.3.6 Guidelines for Editing
The following are some guidelines for editing:
i. Edits should be developed by staff who have expertise in the subject matter, questionnaire design,
data analysis and with other similar surveys.
ii. Editing should be performed at several stages of the survey.
iii. Edits applied at each stage should not contradict edits at some other stage (edits applied
throughout collection and processing should be consistent with each other).
iv. Editing should be used to provide information about the survey process, either in the form of
quality measures for the current survey or to suggest improvements for future surveys.
v. When starting a survey, some assumptions are made about the data. During editing, it is possible
to test the validity of these assumptions. For example, it may become obvious that some range
edits were too strict or that some sequencing edits failed too frequently, indicating inappropriate
edit rules (or some problems with the questionnaire). This information should be used to adjust
the edits in the future (or to improve the design of the questionnaire).
vi. Information on the types of edits performed and the impact of editing on the survey data should
be communicated to users.
vii. Quality assurance and quality control procedures should be applied to minimise and correct errors
introduced during editing (see Appendix B - Quality Assurance and Quality Control).
10.4 Imputation
Imputation is a process used to determine and assign replacement values to resolve problems of
missing, invalid or inconsistent data. This is done by changing some of the responses and all of the
missing values on the record being edited to ensure that a plausible, internally consistent record is created.
Some problems are rectified earlier by contact with the respondent or through manual study of the
questionnaire but, as mentioned previously, it is usually impossible to resolve all problems this way so
imputation is used to handle the remaining edit failures.
222.
SURVEY METHODS ANDPRACTICES
STATISTICS CANADA
210
One alternative to imputation is to let the user treat the missing, invalid or inconsistent data. This
approach is not recommended. If the user decides to ignore or delete all records with edit failures, this
could result in the loss of a great deal of data since many records may be affected. If the user attempts to
replace the missing data, this can lead to inconsistent estimates by different users and can undermine the
reputation of the statistical agency that conducted the survey. Since the user has access to fewer variables
for imputation than the statistical agency it is likely that the user cannot treat the edit failures as well.
Note that in the case of total nonresponse – when very little or no data have been collected – a common
approach is to perform a nonresponse weight adjustment (see Chapter 7 - Estimation).
10.4.1 Methods of Imputation
The methods of imputation can be grouped into two categories – stochastic or deterministic. Deterministic
imputation means that, given the respondent data, there is only one possible imputed value. Stochastic
imputation has an element of randomness: if imputation were repeated on the same dataset, deterministic
methods would impute the same value each time while stochastic methods might impute a different value
each time.
Methods of deterministic imputation include:
- deductive;
- mean value;
- ratio/regression;
- sequential hot-deck;
- sequential cold-deck;
- nearest-neighbour.
With the exception of deductive imputation, each deterministic method has a stochastic counterpart.
When imputing quantitative data, this can be achieved by adding a random residual from an appropriate
distribution or model to the imputed value. The stochastic counterpart of sequential hot-deck is random
hot-deck imputation. Stochastic imputation may better preserve the frequency structure of the dataset and
may restore more realistic variability in the imputed values than deterministic methods.
With the exception of donor imputation methods where one donor can be used to impute all the missing
or inconsistent data for a recipient record, the following methods consider the imputation of one item at a
time.
10.4.1.1 Deductive Imputation
Deductive imputation is a method whereby a missing or inconsistent value can be deduced with certainty.
Often this is based upon the pattern of responses given to other items on the questionnaire. Usually
deductive imputation is performed before any other method. For example, in a sum of four items, if the
total is reported to be 100 with two items reported to be 60 and 40 and the other two left blank, then it can
be deduced that the 2 missing values are zero.
More commonly, imputation must substitute a value that is not known for certain to be true. The
following provides brief descriptions of some common imputation methods. For all of these methods, it is
best to group together similar records, as is done for nonresponse weight adjustments (see Chapter 7 -
Estimation). These groupings are referred to as imputation classes.
223.
PROCESSING
STATISTICS CANADA
211
10.4.1.2 MeanValue Imputation
With mean value imputation, the missing or inconsistent value is replaced with the mean value for the
imputation class. For example, suppose that a questionnaire for a housing survey is missing the value for
the monthly rent payment for an apartment. The missing value can be imputed by the average monthly
rent payment for respondents who correctly reported their monthly rent (the imputation class could
consist of respondents in the same geographic area as the questionnaire requiring imputation).
For the missing data, imputing the mean value is equivalent to applying the same nonresponse weight
adjustment to all respondents in the same imputation class. It assumes that nonresponse is uniform and
that nonrespondents have similar characteristics to respondents.
While mean value imputation may produce reasonable point estimates (i.e., estimates of totals, means,
etc.), it destroys distributions and multivariate relationships by creating an artificial spike at the class
mean. This artificially lowers the estimated sampling variance of the final estimates if conventional
formulas for the sampling variance are used.
To avoid disrupting the distribution of the data, mean value imputation is often used as a last resort, when
no auxiliary information is available or when there are very few records to impute.
10.4.1.3 Ratio/Regression Imputation
Ratio/regression imputation uses auxiliary information or valid responses from other records to create a
ratio or regression model that makes use of the relationship that exists between two or more variables. For
example, ratio imputation uses the following model:
iii Rxy ε+=
where
yi is the value of the y variable for the ith
unit,
xi is the value of a related x variable for the ith
unit,
R is the slope of the line (i.e., the change in yi for one unit increase in xi),
εi is assumed to be a random error variable with mean 0 and variance equal to σ2
.
In other words, the model assumes that yi is approximately linearly related to xi and that observed values of yi
deviate above and below this line by a random amount, εi.
Values of yi could then be imputed by:
ii x
x
y
y =~
where:
iy~ is the imputed value for variable y for record i,
x is the average reported x-value for the imputation class,
y is the average reported y-value for the imputation class.
For example, suppose a questionnaire on employment, payrolls and hours contains an invalid entry for the
payroll, yi, for a two-week period, but the number of paid employees, xi, is properly reported and the
industry of the firm is known. Using other questionnaires on the current file within this industry (i.e.,
imputation class) where both the payroll and the number of paid employees are correctly reported, it is
224.
SURVEY METHODS ANDPRACTICES
STATISTICS CANADA
212
possible to determine the ratio between the payroll and the number of employees. This ratio (payroll to
number of employees) can then be applied to the number of employees on the questionnaire requiring
imputation to determine a value for the payroll.
The assumption made here is that the ratio or regression model fit to the questionnaires with valid data
(i.e., which passed all edits) in the imputation class applies equally well to the questionnaires that failed
edits in the imputation class. If this is not true, serious bias can be introduced.
The accuracy of the imputed values depends to a large extent on the existence of variables closely related
to the variable being imputed, the degree of sophistication used in the mathematical calculations and
whether or not the calculation is restricted to an imputation class or the whole dataset. One advantage of
this method is that it may preserve relationships between variables. Also, ratio and regression estimators
are likely to generate more stable imputed values than simple averages. However, this method of
imputation can artificially induce relationships at the data analysis stage. And, like most other imputation
methods (with the exception of deductive imputation), it lowers the estimated sampling variance of the
final estimates if conventional variance formulas are used.
Previous value imputation, also called carry-over or carry-forward imputation, is a special case of
ratio/regression imputation where the value for the current occasion is imputed by adjusting the previous
occasion’s value for growth. It is frequently used for quantitative variables in business survey
applications.
Ratio and regression estimation are explained in more detail in Chapter 11 - Data Analysis.
10.4.1.4 Hot-Deck Imputation
Hot-deck imputation uses information from a donor record that has usually passed all edits to replace
missing or inconsistent values for a recipient record. In order to find a donor record that is similar to the
recipient record, variables that are related to those requiring imputation are identified to create imputation
classes. The set of records in the imputation class which have passed all the edits is the donor pool for
records in the imputation class requiring imputation. Hot-deck imputation can be used to impute
quantitative or qualitative data, but generally uses qualitative variables to create the imputation classes.
The two main types of hot-deck imputation are sequential and random hot-deck imputation.
With sequential hot-deck, the data are processed sequentially within the imputation class, one record at a
time (i.e., sorted in some order). Imputation is performed by replacing the missing item on a questionnaire
with the corresponding value from the previous clean responding donor in the imputation class on the data
file. Sequential hot-deck is a deterministic imputation method if the same method of sorting is used each
time. With random hot-deck imputation, donors are selected at random within the imputation class.
Random hot-deck is a stochastic method of imputation.
To illustrate hot-deck imputation, consider the example of imputing the smoking status of a respondent.
Suppose that there are two possible responses: smoker and non-smoker. To find a donor record,
imputation classes are created based on age group and sex since these variables are related to a person’s
smoking status. Suppose that the record requiring imputation is for a female in the 15-24 age category.
The set of donors is all respondent females aged 15-24 who reported their smoking status. A donor could
be selected either randomly (i.e., random hot-deck) or sequentially, by sorting the list of donors and
selecting one (i.e., sequential hot-deck).
The advantage of donor imputation methods (hot deck imputation and nearest neighbour, see section
225.
PROCESSING
STATISTICS CANADA
213
10.4.1.6) isthat since similar donors (i.e., companies, households, etc.) should have similar
characteristics, the imputed value should be fairly close to the actual value. And with donor imputation,
the multivariate distribution of the data can usually be preserved.
There are, however, some disadvantages. One disadvantage of sequential hot-deck is that it often leads to
multiple use of the same donor. If one donor is used repeatedly, this can distort the distribution of the data
and artificially lower the estimated sampling variance. Another disadvantage is that good auxiliary
information and at least a partial response (for example, household income, age, sex, etc.) is needed to
create the imputation classes, and these are not always available for the records requiring imputation.
Also, care must be taken if the imputation class is small or the nonresponse rate in the imputation class is
high as this may lead to no donor being found. (This is true for all methods of imputation that use
imputation classes.)
In order to ensure that it is always possible to find a donor record, hierarchical hot-deck imputation can
be used. Hierarchical imputation uses more than one level of imputation class. When a donor cannot be
found for the initial most detailed imputation class, imputation classes are collapsed in a hierarchical
fashion until a level is reached where a donor can be found.
For more details on donor imputation, see section 10.4.3.
10.4.1.5 Cold-Deck Imputation
Cold-deck imputation is similar to hot-deck imputation, the difference is that hot-deck imputation uses
donors from the current survey, while cold-deck imputation uses donors from another source. Often cold-
deck imputation uses historical data from an earlier occasion of the same survey or from a census. If the
donors are selected in a random manner, then imputation is stochastic, otherwise it is deterministic.
10.4.1.6 Nearest-Neighbour Imputation
For surveys with largely quantitative data (e.g., business surveys with reported sales and inventory), it
may be necessary or preferable to find a donor record by matching on quantitative data. Nearest-
neighbour imputation selects a donor record based on matching variables. With this method of
imputation, the goal is not necessarily to find a donor record that matches the recipient exactly on the
matching variables. Instead, the goal is to find the donor that is closest to the recipient in terms of the
matching variables within the imputation class – i.e., to find the nearest neighbour. This closeness is
defined by a distance measure between two observations calculated using matching variables (e.g., to
impute missing inventory, find the nearest-neighbour with respect to reported sales in the imputation
class).
Caution must be exercised when implementing nearest neighbour methods in cases where the scale of the
matching variables is quite different (e.g., currency and land areas). In most instances some form of
transformation of the variables should be done in order to standardise the scale.
10.4.1.7 Deterministic Imputation with Random Residuals
Deterministic methods for quantitative data can be made stochastic by adding random residuals, for
example, by imputing the mean value and adding a random residual:
226.
SURVEY METHODS ANDPRACTICES
STATISTICS CANADA
214
ii eyy +=~ *
where
iy~ is the imputed value for variable y for record i,
y is the mean for the imputation class,
ei * is a random model residual selected from the respondents or drawn from a distribution.
One way to select ei * is as follows. For the set of respondents in an imputation class, calculate residuals
as follows:
rriri yye −= )()(
where
yi(r) is the reported y-value for the ith
respondent,
ry is the average reported y-value for the imputation class.
Then, one can set ei * by randomly selecting from all values of ei(r) in the imputation class.
See Kalton and Kasprzyk (1986) for a discussion of approaches to stochastic imputation.
10.4.2 Determining which Values to Impute
Fields that fail an edit rule due to nonresponse or invalid data that are not resolved through respondent
follow-up should be imputed. For all other edit failures, since it is best to preserve as much of the
respondent data as possible, imputing all edit failures is not recommended. Instead, it is best to impute a
minimum set of fields for a record. The Fellegi/Holt framework (Fellegi and Holt, 1976) is one such
method of identifying the fields that require imputation. Three criteria are used to determine which fields
should be imputed:
- the data in each record should be made to satisfy all edits by changing the fewest possible items of
data (fields);
- as much as possible, the frequency structure of the data file should be maintained;
- imputation rules should be derived from the corresponding edit rules without explicit specification.
A key feature of the Fellegi/Holt editing approach is that the edit rules are not specific to a particular
imputation method. For each failed edit record, it first proceeds through a step of error localisation in
which it determines the minimal set of variables (fields) to impute, as well as the acceptable ranges(s) of
values to impute. In most implementations, a single donor is selected from passed edit records by
matching on the basis of other variables involved in the edits but not requiring imputation. The method
searches for a single exact match and can be extended to take account of other variables not explicitly
involved in the edits. Occasionally, no suitable donor can be found and a default imputation method must
be available.
For example, consider that a survey has an age/marital status edit to identify people who are married and
under the age of 16; and an age/level of education edit to identify people who have a university education
and are under the age of 18. Suppose that the survey data have a record that fails both of these edits: there
is a ten-year old married woman with a university education. In order for this record to pass both edits,
both the individual’s marital status and level of education could be changed, or simply the age could be
changed. The Fellegi/Holt framework recommends the latter.
227.
PROCESSING
STATISTICS CANADA
215
10.4.3 DonorImputation Issues
The following issues require consideration when developing a donor imputation system (i.e., hot-deck,
cold-deck or nearest neighbour imputation):
i. How will a donor record be found for the recipient?
The goal is to find a donor record for each recipient that is similar to the recipient. Serious thought needs
to be given to the imputation classes or matching variables used – it is important that there be a strong
relationship between the variables requiring imputation and those used to select donors. For methods that
require the formation of imputation classes, it is important that imputation classes be large enough that a
sufficient number of potential donors are available, but not so large that the records within a donor pool
are dissimilar.
ii. Should all fields on a recipient record be imputed from a single donor?
This is desirable because taking all fields from one record preserves joint distributions between variables.
For example, in a labour force survey, if both occupation and personal income are flagged for imputation,
there is an obvious advantage to imputing both of these variables using the same donor record, since this
will preserve the interrelationship between income and occupation. Another advantage of single donor
imputation is that since the donor must have passed all edits, it can be used to impute all missing values
(i.e., facilitating imputation).
One problem with donor imputation is that if too many matching variables are used (i.e., variables used to
create imputation classes in the case of hot-deck and cold-deck), there is the risk that no suitable donor
may be found. Another problem is that the matching variables used to impute one field may not be
suitable for another, particularly if the variables requiring imputation are not related. Consider a multi-
purpose health survey in which a person’s height and the number of cigarettes smoked daily are flagged
for imputation. In this case, a different set of matching fields might be appropriate for each field requiring
imputation.
Often with donor procedures, the imputation is broken down into several stages with certain sets of fields
being imputed at each stage. As a result, several donors may be involved in completing a single deficient
record. If this is of concern, certain key imputed fields can be used to create imputation classes in
succeeding stages to preserve internal integrity.
iii. Can a donor record be used to impute more than one recipient?
If several recipient records are imputed by the same donor, the impact on the final survey estimates can be
significant. Limiting the number of times a record is used as a donor has the effect of spreading the donor
usage around and avoiding over-use of a particular donor. If the response rate in a particular imputation
class is very low, limiting the number of times a donor is used may result in some matches not being very
good (i.e., the donor may not be very similar to the recipient record) and may result in some recipients not
finding a donor. At the same time, over-use of a donor (especially if the donor has unique characteristics
making it quite different from others in the population) can have a substantial effect on survey estimates.
If there is no limit placed on the number of times that a record can be used as a donor, there should be a
method of identifying records which are used often as donors. If any of these records have suspicious or
outlying fields, some investigation may be warranted to see if the final survey results were distorted by
the imputation process.
228.
SURVEY METHODS ANDPRACTICES
STATISTICS CANADA
216
iv. What is done for recipients for whom a suitable donor cannot be found?
There are some recipients for whom a donor record cannot be found. Usually a back-up procedure is used
for such recipients (e.g., hierarchical hot-deck or cold-deck imputation or mean value imputation).
v. Does the survey deal with quantitative or qualitative data?
Some imputation methods are more appropriate for qualitative variables while others are more
appropriate for quantitative variables. Hot-deck methods were developed in order to treat qualitative data
while nearest neighbour imputation was developed for quantitative data. Nowadays, both methods have
found their use in both situations, including mixed problems.
10.4.4 Variance Estimation for Imputed Data
All of the imputation methods presented produce a single imputed value for each missing or inconsistent
value. All distort, to some extent, the original distribution of values for a variable and can lead to
inappropriate variance estimates when standard variance estimators are used. This can lead to confidence
intervals that are too narrow and spurious declarations of significance. The extent of the distortion varies
considerably depending on the amount of imputation done and the method used.
When imputation is carried out – assuming there are no other nonsampling errors – the variance of an
estimate has two components: one due to sampling (the sampling variance) and one due to imputation (the
imputation variance). The sampling variance component is usually underestimated in the presence of
imputed data since traditional formulas assume a 100% response rate. One benefit of stochastic
imputation methods is that they add some noise to the completed dataset. As a result, when stochastic
imputation is used, the sampling variance of an estimate can be, most of the time, correctly estimated
using traditional methods. However, to determine the total variance of the estimate, the imputation
variance must still be estimated.
It is important to estimate both the sampling and the imputation components of the total variance not only
to draw correct inferences, but also to know the relative importance of the sampling variance and
imputation variance. This can help inform users of data quality and help allocate survey resources
between sample size and edit/imputation processes.
Multiple imputation is a method, proposed by Rubin (1987), which addresses this problem by properly
imputing several, say m, times, each value requiring imputation (for a definition of proper imputation, see
Rubin, 1987 or Binder and Weiman, 1996). From the completed dataset, m estimates can be produced for
the item. From these, a single combined estimate is produced along with a pooled variance estimate that
expresses the uncertainty about which value to impute. However, multiple imputation requires more work
for data processing, storage and computation of estimates.
In the case of single imputation, the important variance estimation methods have been extended to the
case of data files containing imputed data. The approaches are described in Särndal (1992), Rao and Shao
(1992), Rao and Sitter (1995) and Gagnon et al. (1996). A comparison of the methods is presented in Lee,
Rancourt and Särndal (1994, 2001).
229.
PROCESSING
STATISTICS CANADA
217
10.4.5 Guidelinesfor Imputation
Although imputation can improve the quality of the final data, care should be taken when choosing an
appropriate imputation methodology. One risk with imputation is that it can destroy reported data to
create records that fit preconceived models that may later turn out to be incorrect. The suitability of the
imputation method depends upon the survey, its objectives, available auxiliary information and the nature
of the error.
The following are some guidelines for imputation:
i. Imputed records should closely resemble the failed edit record. This is usually achieved by
imputing the minimum number of variables, thereby preserving as much respondent data as
possible. The underlying assumption (which is not always true in practice) is that a respondent is
more likely to make only one or two errors than several.
ii. Good imputation has an audit trail for evaluation purposes. Imputed values should be flagged and
the methods and sources of imputation clearly identified. The unimputed and imputed values of
the record’s fields should be retained so that the degree and effects of imputation can be
evaluated.
iii. Imputed records should satisfy all edits.
iv. The imputation methods should be chosen carefully, considering the type of data to be imputed.
v. The imputation method should aim to reduce the nonresponse bias and preserve relationships
between items as much as possible (i.e., the fit of the model underlying the imputation method
should be assessed).
vi. The imputation system should be thought out, specified, programmed and tested in advance.
vii. The process should be automated, objective, reproducible and efficient.
viii. The imputation system should be able to handle any pattern of missing or inconsistent fields.
ix. For donor imputation methods, the imputed record should closely resemble the donors selected.
This will tend to ensure that the combination of imputed and unimputed responses for the
imputed record not only satisfy the edits but are also plausible.
10.4.6 Evaluation of Imputation Procedures
The size of the survey and its budget influence how much work can be carried out to measure imputation
effects. However, users of survey data should always have at least some basic information about the
degree to which survey data were modelled or estimated by imputation. In evaluating the imputation
procedure, the most relevant concerns are bias and the imputation variance of the survey estimates.
If the survey budget is large, one option is to do a complete study of the effect of imputation, looking at
the survey estimates with and without imputation. Cases in which discrepancies are large can be
investigated and an attempt can be made to discover any bias that may exist due to imputation.
If this is not possible, at the very least, imputation should be monitored so users can be told how much
230.
SURVEY METHODS ANDPRACTICES
STATISTICS CANADA
218
imputation was done and where. At the end of imputation, it may be useful to produce the following
(some are specific to a particular method):
- the number of records which were imputed (i.e., the number of recipient records);
- the number of times each field was imputed and by what method;
- the number of records eligible to be used as donors;
- the number of records actually used as donors and the number of recipients each of these donor
records imputed;
- a list (or file) indicating which donors were used for each recipient (to trace the sources of unusual
imputed records);
- a list of all records for which imputation failed (e.g., because no donor was found).
It should be noted that the above information is useful for the redesign of a survey or the implementation
of a similar survey. This information could be instrumental in improving the edit and imputation system,
the survey questionnaire and the collection procedures. For example, if the answer to a question has a
high imputation rate, this could indicate a poorly worded question (and poor data quality).
10.5 Identification and Treatment of Outliers
The identification of outliers can be viewed as a type of editing whereby suspicious records are identified.
In Chapter 7 - Estimation, an outlier was defined as an observation or subset of observations that
appears to be inconsistent with the remainder of the dataset. The distinction should also be made
between extreme and influential observations. An observation is influential if the combination of the
reported value and the final survey weight have a large influence on the estimate. However, an extreme
value need not be influential, and vice versa.
It is possible to make the distinction between univariate outliers and multivariate outliers. An observation
is a univariate outlier if it is an outlier with respect to one variable. An observation is a multivariate
outlier if it is an outlier with respect to two or more variables. For example, it might not be unusual to find
a person with a height of 2 metres or a person weighing 45 kg. But someone who is both 2 metres high
and only weighs 45 kg is an example of a multivariate outlier.
Outliers are found in every survey for almost every variable of interest. There are many reasons why
outliers exist:
i. There are errors in the data (e.g., data capture errors).
ii. The outliers can be thought of as arising from another model or distribution. For example, most of
the data might be considered to arise from a normal distribution, but the outliers might be thought
of as arising from an exponential distribution.
iii. The outlier may be due to inherent variability of the data. What appears to be a suspicious value
may simply arise from the inherent variability of the dataset – in other words, it may be a
legitimate but extreme observation from the distribution. This can occur when the population is
skewed, which is common for business surveys. For example, the distribution of the sales by the
size of the company is typically skewed – a few very large companies often contribute to a large
portion of the overall sales.
231.
PROCESSING
STATISTICS CANADA
219
10.5.1 Identificationof Outliers
The most popular outlier detection methods are univariate methods because they are simpler than
multivariate methods. Traditionally, outliers are detected by measuring their relative distances from the
centre of the data. For example, if y1, y2, …, yn are the observed sample data and m and s are measures of
the central tendency and spread of the data, respectively, then the relative distance, di, of yi from the
centre of the data can be defined by:
s
my
d i
i
|| −
=
If di exceeds a predetermined cut-off value, then the observation is considered to be an outlier.
Alternatively, a tolerance interval can be given by:
),( scmscm UL +−
where cL and cU are predetermined lower and upper bound values. If the population is skewed, unequal
values of cL and cU are used. Observations falling outside of this interval are declared to be outliers.
The sample mean and variance are the statistics most frequently used to estimate the centre of the data
and the spread of the data. However, since they are sensitive to outliers, they are a poor choice for the
purpose of outlier detection. For example, the sample mean is shifted towards outliers if they are clustered
on one side and the sample variance is greatly inflated by outliers. Therefore, the relative distance values
of some outliers may appear rather small and the procedure may fail to detect them. This problem is
referred to as the masking effect.
For this reason, one of the most popular methods of outlier detection is the quartile method which uses
the median to estimate the centre and quartile ranges to estimate the spread of the weighted data, since
these statistics are more robust (i.e., insensitive) to outliers. Quartiles divide the data into four parts: 25%
of the data points are less than the first quartile, q.25, 50% of the data points are less than the second
quartile (or the median), q.5, and 75% of the data points are less than the third quartile, q.75. (The median
and quartile ranges are discussed further in Chapter 11 - Data Analysis).
The lower and upper quartile ranges, hL and hU , are defined as:
5.75.
25.5.
qqh
qqh
U
L
−=
−=
The tolerance interval then becomes:
),( 5.5. UULL hcqhcq +−
with some predetermined values for cL and cU which can be chosen by examining past data or based on
past experience. Any observation falling outside of this interval is considered to be an outlier.
For more information on outlier detection methods, see Barnett and Lewis (1995).
232.
SURVEY METHODS ANDPRACTICES
STATISTICS CANADA
220
10.5.2 Treatment of Outliers
Outliers detected at the editing stage of the survey process can be treated in various ways. In a manual
editing system, the potential outliers are examined or followed-up and changed if they are in fact errors.
In an automated editing system, outliers are often imputed. In some cases, no special treatment of outliers
is performed if it is believed that they are not influential.
Outliers that are not treated in editing can be dealt with at estimation. Simply ignoring untreated outliers
can result in poor estimates and an increase in the sampling variance of the estimates. Assigning the
outlier a weight of one (to reduce its effect on estimates) can bias the results. The goal of outlier treatment
is to decrease the impact that the outlier has on the sampling variance of the estimate without introducing
too much bias.
The following approaches can be used to treat outliers during estimation:
- change the value;
- change the weight;
- use robust estimation.
i. Change the value
One example of treatment of an extreme value is Winsorization. Winsorization consists of recoding the
top k values.
Recall that in simple random sampling (assuming a 100% response), the usual unbiased estimator of the
population total Y is given by:
∑=
=
n
i
iy
n
N
Y
1
ˆ
where i is the ith
unit in a sample of size n.
Assuming that yi , i=1,2, …, n are ordered values of yi in a sample of size n from a population of size N
and the k largest values are considered to be outliers, the one-sided k-times-Winsorized estimator is
defined by replacing these outlier values by the n-kth
largest value, yn-k. That is:
)(ˆ
1
kn
kn
i
iW kyy
n
N
Y −
−
=
+= ∑
Note that Winsorization tends to be used for one-variable situations, so it is rarely used in the multivariate
sample survey situation.
ii. Change the weight
Another option is to reduce the weights of outliers so that they have a smaller impact. An example is to
set the weight of the outlier to one or zero. This is seldom done because of its dramatic effect on
estimates, especially for skewed populations. It can lead to serious bias – usually underestimation. For
example, if two large companies contribute to the majority of retail sales, and one is identified as an
outlier, eliminating this company from the estimates will seriously underestimate the total retail sales.
Several estimators with reduced weights for outliers have been proposed, see Rao (1970), Hidiroglou and
Srinath (1981).
233.
PROCESSING
STATISTICS CANADA
221
iii. RobustEstimators
In classical estimation theory, the estimator of a population parameter is based on an assumption of some
distribution. Typically, it is assumed that the estimator has a normal sampling distribution (see Chapter 7
- Estimation for the definition of a sampling distribution). The usual sample mean and variance
estimators are optimal under normality. However, these estimators are extremely sensitive to outliers.
Robust estimators are estimators that are less sensitive to distributional assumptions. For example, the
median is more robust than the mean; interquartile ranges are more robust than the usual variance
estimator. Many complex robust estimators have been proposed over the years, including Huber’s M-
estimators, Huber (1964).
For more information on robust estimators and outlier detection in general, see Kish (1965), Barnett and
Lewis (1995), Rousseeuw and Leroy (1987), Lee et al. (1992), or Lee (1995). For more information on
the mean versus the median, see Chapter 11 - Data Analysis.
10.6 Generating Results/ Creating a Database
After coding, data capture, edit and imputation and the detection of outliers, the data are almost ready for
estimation, analysis, and publication. Before proceeding however, the format for storing the data must be
established. The two main choices are a database or a flat file. A flat file is a computerised 2-dimensional
arrangement of records and their corresponding values. It is easily transferable between platforms and can
be read using spreadsheet software or statistical software. The main drawback to a flat file is that most
statistical software must have data stored in a special format to facilitate speedy processing. When using a
flat file, this special format is continually being recreated, an unnecessary inefficiency. If the data are
stored in an appropriate database format, it is possible to use certain statistical and database software
without needing to recreate the file. Queries can be run directly on the database. However the choice of
database format may restrict the choice of statistical and database software that can be used for tabulation
and analysis. It may be best to create a flat file as well as several different database files with the survey
results.
Once the format for storing the data has been selected, the final (estimation) weights are calculated and
the planned tabulations are produced (see Chapter 7 - Estimation for a description of how to calculate
final weights). Usually, computer programs are written to calculate the weights and produce the
tabulations. More sophisticated data analysis may also be performed. Before releasing the data, they must
be examined to ensure that the confidentiality of respondents is not violated. This process, called
disclosure control, may result in the suppression of some survey data. For more information on data
analysis and disclosure control, see Chapter 12 - Data Dissemination.
10.7 Automated versus Manual Processing
In the past, almost all aspects of survey processing were done manually. However, computers now make
it possible to process the data in an automated manner.
The benefits of automating coding and data capture, optical scanners, computer-assisted data collection
methods and pre-coding the questionnaire have already been discussed. The arguments for using
computers at collection apply to using computers for processing. Experience has shown that, in general,
computers are much better at processing large volumes of information than are people. Automation can
improve all aspects of data quality, in particular timeliness – it can produce results faster with fewer
234.
SURVEY METHODS ANDPRACTICES
STATISTICS CANADA
222
resources. It also ensures that procedures (for example, editing and imputation) are implemented in a
consistent manner, thereby reducing nonsampling errors. Also, it is possible to use more complex
methods (for example for editing, imputation, coding, quality control, etc.) and it is possible to track
processing – produce reports on each processing step (e.g., number of edits and imputations performed).
Automation also makes it easier to monitor and control the quality of the processing.
However, there are some drawbacks to automation, including:
- specifications must be written for each system that is to be automated. Developing a computer
program for each procedure (e.g., imputation) can be time-consuming;
- operators must be trained on the software;
- automated coding, editing and imputation does not take into account any additional knowledge held
by the operator.
Despite these drawbacks, it is wise to automate procedures as much as possible. The additional time
required at the outset is more than offset by the time saved later in the survey process (particularly if the
survey is to be repeated). As a minimum data should always be captured and then weighted and
estimation performed by computer. The consistency that results from automation is important to attaining
accurate and measurable results. It is also wise to take advantage of existing systems and processes,
automated systems for coding, etc.
10.8 Summary
Processing is an important survey activity that converts questionnaire responses into a format suitable for
tabulation and data analysis. Processing is costly, time-consuming, resource-intensive and has an impact
on the final quality of the data. Automation can make it more efficient and improve the final quality of the
data.
Processing usually begins with a preliminary clean-up of the questionnaire, followed by coding and data
capture. This is usually followed by more detailed editing to identify missing or inconsistent data, and
imputation to provide plausible substitutes for these values. Outlier detection may also be performed to
identify suspicious values. Once the data are complete, consistent and valid, they are typically stored in a
database.
Bibliography
Bankier, M., M. Lachance, and P. Poirier. 1999. A Generic Implementation of the Nearest neighbour
imputation method. Proceedings of the Survey Research Methods Section. American Statistical
Association. 548-553.
Barnett, V., and T. Lewis. 1995. Outliers in Statistical Data. John Wiley and Sons, Chichester.
Latouche, M. and J.-M. Berthelot. 1992. Use of a Score Function to Prioritize and Limit Recontacts in
Editing Business Surveys. Journal of Official Statistics, 8(3): 389-400.
Binder, D., and S. Weimin. 1996. Frequency Valid Multiple Imputation for Surveys with a Complex
Design. Proceedings for the Section on Survey Research Methods of the American Statistical
Association, 1: 281-286.
235.
PROCESSING
STATISTICS CANADA
223
Brick, J.M.and G. Kalton. 1996. Handling Missing Data in Survey Research. Statistical Mathematics in
Medical Research, 5: 215-238.
Boucher, L, J.-P. S. Simard and J.-F. Gosselin. 1993. Macro-Editing, a Case Study: Selective Editing for
the Annual Survey of Manufacturers Conducted by Statistics Canada, Proceedings of the
International Conference on Establishment Surveys. American Statistical Association. Virginia.
Chambers, R.L. 1986. Outlier Robust Finite Population Estimation. Journal of the American Statistical
Association, 81: 1063-1069.
Cox, B.G., D.A. Binder, B.N. Chinnappa, A. Christianson, M.J. Colledge and P.S. Kott, eds. 1995.
Business Survey Methods. John Wiley and Sons, New York.
Dielman, L. and M.P. Couper. 1995. Data Quality in a CAPI Survey: Keying Errors. Journal of Official
Statistics, 11(2): 141-146.
Dolson, D. 1999. Imputation Methods. Statistics Canada.
Fay, R.E. 1996. Alternative Paradigms for the Analysis of Imputed Survey Data. Journal of the American
Statistical Association, 91: 490-498.
Fellegi, I.P. and D. Holt. 1976. A Systematic Approach to Automatic Edit and Imputation. Journal of the
American Statistical Association, 71: 17-35.
Gagnon, F., H. Lee, E. Rancourt and C.E. Särndal. 1996. Estimating the Variance of the Generalized
Regression Estimation in the Presence of Imputation for the Generalized Estimation System.
Proceedings of the Survey Methods Section. Statistical Society of Canada. 151-156.
Granquist, L. 1984. On the Role of Editing. Statistisk tidskrift, 2: 105-118.
Granquist, L. and J. Kovar. 1997. Editing of Survey Data: How Much is Enough? In Lyberg, L., P.
Biemer, M. Collins, E. de Leeuw, C. Dippo, N. Schwarz and D. Trewin, eds. 1997. Survey
Measurement and Process Quality. John Wiley and Sons, New York.
Hidiroglou, M.A. 1999. Course notes for Methods for Designing Business Survey. Sponsored by the
IASS: 52nd
session of the ISI. University of Jyvaskylä, Finland.
Hidiroglou, M.A. and J.-M. Berthelot. 1986. Statistical Edit and Imputation for Periodic Surveys. Survey
Methodology, 12(1): 73-84.
Hidiroglou, M.A. and K.P. Srinath. 1981. Some Estimators of a Population Total Containing Large Units.
Journal of the American Statistical Association, 78: 690-695.
Huber, P.J. 1964. Robust Estimation of a Location Parameter. Annals of Mathematical Statistics, 35: 73-
101.
Kalton, G. and D. Kasprzyk. 1982. Imputation for Missing Survey Responses. Proceedings of the Section
on Survey Research Methods. American Statistical Association. 23-31.
Kalton, G. and D. Kasprzyk, D. 1986. The Treatment of Missing Survey Data. Survey Methodology,
12(1): 1-16.
236.
SURVEY METHODS ANDPRACTICES
STATISTICS CANADA
224
Kish, L. 1965. Survey Sampling. John Wiley and Sons, New York.
Kovar, J.G., J. MacMillan and P. Whitridge. 1988. Overview and Strategy for the Generalized Edit and
Imputation System. (Updated February 1991). Statistics Canada. BSMD-88-007E/F.
Latouche, M. et J.-M. Berthelot. 1992. Use of a Score Function to Prioritize and Limit Recontacts in
Editing Business Surveys. Journal of Official Statistics, 8(3): 389-400.
Lee, H., E. Rancourt and C.E. Särndal. 1994. Experiments with Variance Estimation from Survey Data
with Imputed Values. Journal of Official Statistics, 10(3): 231-243.
Lee, H., E. Rancourt and C.E. Särndal. 2001. Variance Estimation from Survey Data under Single Value
Imputation. Survey Nonresponse. John Wiley and Sons, New York.
Lee, H. 1995. Outliers in Business Surveys. In Business Survey Methods. Cox, B.G., D. A. Binder, B.N.
Chinnappa, A. Christianson, M.J. Colledge and P.S. Kott, eds. John Wiley and Sons. New York.
503-526.
Lyberg, L. and P. Dean. 1992. Automated Coding of Survey Responses: An International Review.
Presented at the Conference of European Statisticians. Washington, D.C.
Moser, C.A. and G. Kalton. 1971. Survey Methods in Social Investigation. Heinemann Educational Books
Limited, London.
Raj, D. 1972. The Design of Sample Surveys. McGraw-Hill Series in Probability and Statistics, New
York.
Rancourt, E., H. Lee and C.E. Särndal. 1993. Variance Estimation Under More than One Imputation
Method. Proceedings of the International Conference on Establishment Surveys, American
Statistical Association, 374-379.
Rao, C.R. 1970. Estimation of Heteroscedastic Variances in Linear Models. Journal of the American
Statistical Association, 65: 161-172.
Rao, J.N.K. and J. Shao. 1992. Jackknife Variance Estimation with Survey Data under Hot-deck
Imputation. Biometrika, 79: 811-822.
Rao, J.N.K. and R.R. Sitter. 1995. Variance Estimation under Two-Phase Sampling with Application to
Imputation for Missing Data. Biometrika, 82: 453-460.
Rao, J.N.K. 1996. On Variance Estimation with Imputed Survey Data. Journal of the American Statistical
Association, 91: 499-506.
Rousseeuw, P.J. and A.M. Leroy. 1987. Robust Regression and Outlier Detection. John Wiley and Sons,
New York.
Rubin, D.B. 1987. Multiple Imputation for Nonresponse in Surveys. John Wiley and Sons, New York.
Rubin, D.B. 1996. Multiple Imputation after 18+ Years. Journal of the American Statistical Association,
91: 473-489.
237.
PROCESSING
STATISTICS CANADA
225
Sande, I.G.1979. A Personal View of Hot-deck Imputation Procedures. Survey Methodology, 5(2): 238-
258.
Sande, I.G. 1982. Imputation in Surveys: Coping with Reality. The American Statistician, 36(3). Part 1:
145-152.
Särndal, C.E. 1992. Methods for Estimating the Precision of Survey Estimates when Imputation has Been
Used. Survey Methodology, 18(2): 242-253.
Särndal, C.E., B. Swensson and J. Wretman. 1992. Model Assisted Survey Sampling. Springer Verlag,
New York.
Shao, J. and R.R. Sitter. 1996. Bootstrap for Imputed Survey Data. Journal of the American Statistical
Association, 94: 254-265.
Statistics Canada. 1987. Quality Guidelines. Second Edition.
Statistics Canada. 1990. Course notes for Survey Skills Development Course.
Statistics Canada. 1998. Statistics Canada Quality Guidelines. Third Edition.12-539-X1E.
Statistics Canada. 1998. Course notes for Surveys from Start to Finish. Course code 416.
Wenzowski, M.J. 1988. Advances in Automated Coding and Computer-Assisted Coding Software at
Statistics Canada. Proceedings of the 1996 Annual Research of the U.S. Census Bureau.
Yung, W. and J.N.K. Rao. 2000. Jackknife Variance Estimation under Imputation for Estimators using
Poststratification Information. Journal of the American Statistical Association, 95: 903-915.
238.
E L EC T R O N I C P U B L I C A T I O N S
A V A I L A B L E A T
www.statcan.gc.ca
239.
STATISTICS CANADA
227
Chapter 11- Analysis of Survey Data
11.0 Introduction
Data analysis involves summarising the data and interpreting their meaning in a way that provides
clear answers to questions that initiated the survey. Often, it consists of interpreting tables and various
summary measures, such as frequency distributions, means and ranges, or more sophisticated analyses
may be performed. The analyst may just want to describe the observed units, in which case all tools from
elementary and intermediate statistics are available (tables, diagrams and charts, elementary measures of
location and spread, basic modelling, classification models, etc.). Or – more commonly – the analyst
wants to describe the population and test hypotheses about it, in which the sample design must be
properly accounted for during analysis.
The purpose of this chapter is to discuss the analysis of summary statistics (frequency distributions,
measures of central tendency and measures of spread) and introduce more analytic methods involving
inferential analysis for probability samples and how these apply to simple and complex sample designs.
This chapter begins with the analysis of simple survey data – no stratification, clustering, weight
adjustments, etc. Data analysis for more complex survey data rapidly gets complicated and a specialist
should be consulted. The more advanced material in this chapter requires undergraduate courses in
statistics to thoroughly understand and begins with section 11.3.2.2.1 Confidence Intervals in the
Presence of Bias.
11.1 Parameters, Estimates, Sampling Error
Before proceeding, recall some definitions presented in Chapter 6 - Sample Designs. A parameter is a
population characteristic that the client or data user is interested in estimating, for example the
population average or mean, Y . An estimator is a formula by which an estimate of the parameter is
calculated from the sample and an estimate is the value of the estimator using the data from the
realised sample. Estimates calculated from different samples differ from one another. The sampling
distribution of an estimator is the distribution of all the different values that the estimator can have for
all possible samples from the same design from the population. This distribution depends on the
estimator and the sample design. One desirable property of an estimator is that it be unbiased or
approximately unbiased, another is that the sampling distribution be concentrated as closely as possible
about the mean (i.e., that the sampling error be small). For probability samples, this error can be
measured, usually by estimating the sampling variance, standard error, coefficient of variation or margin
of error.
11.2 Types of Data
A range of characteristics, or variables, are collected by a survey. Recall from Chapter 7 - Estimation,
that a single survey may have both qualitative and quantitative variables. Qualitative variables are
categorical in nature while quantitative variables indicate an amount. Further decompositions can be
made: qualitative variables may be nominal or ordinal and quantitative variables may be discrete or
continuous.
240.
SURVEY METHODS ANDPRACTICES
STATISTICS CANADA
228
i. Nominal variables
A nominal variable consists of categories that are simply labels or names with no mathematical
relationships between the names. It cannot be said that a particular category is greater than, equal to, or
less than another; for example, if type of sport is the nominal variable, cricket < soccer has no meaning.
ii. Ordinal variables
An ordinal variable consists of categories that are ordered or ranked according to some scale or
continuum; a particular category can be said to come before or after another. The differences between
categories are not necessarily equal. Numbers may be assigned to ordinal variables but only the order
matters, adding them together or performing other arithmetic operations is inappropriate. An example of
ordinal data is: strongly agree, agree, neutral, disagree, strongly disagree. Other examples are: age
collected using a closed question, as in less than 15 years old, 15 to 34 years old, …, 75 years or older; or
blood pressure reported as low, normal, high.
iii. Discrete variables
A discrete variable is a quantitative variable with countable values. An example of such a variable is one
where possible values are integers and there can be no intermediate value between any two integers. For
example, household size can be 1, 2, 3; values such as 1.5 or 4.75 are impossible. Discrete variables need
not be integers, however: another example of a discrete variable is shoe size, where size 6, 6.5, 7, 7.5, etc.
are possible, but 6.75 is impossible.
iv. Continuous variables
A continuous variable is a quantitative variable where any value in a certain range is possible (as opposed
to discrete where only particular values are possible). Thus height and weight are continuous variables
whereas the number of goals scored by a hockey team is a discrete variable. It is possible for a person to
have any height – within a reasonable range – such as 1.68 metres, but a hockey team cannot score 2.3
goals since the number of goals must be a discrete and integer value. Note that continuous variables can
be made categorical, for example, blood pressure measurements can be categorised as low, normal or
high.
The types of analytical procedures that can be used depend on the type of data, as explained in the
following sections.
11.3 Summary Measures
In the Analysis of Complex Surveys (1989), Skinner, Holt and Smith state that data from a sample survey
can be used for descriptive or analytic purposes. Descriptive uses are directed at the estimation of
summary measures of the population, such as means and frequencies, while analytic uses go beyond the
summary measures and into the explanation of the processes that underlie the descriptive measures.
This section presents the following summary measures:
- frequency distributions (in table or chart form);
- measures of location (i.e., the mean, median or mode);
- measures of the spread of the distribution (e.g., variance, range).
241.
ANALYSIS OF SURVEYDATA
STATISTICS CANADA
229
When analysing the population, it is important to properly account for the sample design. This chapter
first presents the case of simple data in section 11.3.1, along with guidelines to display survey results in
chart form. Then measures of location and spread for more complex data are presented in section 11.3.2.
11.3.1 Simple Survey Data
Summary statistics for simple survey data (e.g., a census, Simple Random Sample, SRS, or Systematic
Sample, SYS, with no weight adjustments) are covered in undergraduate statistics classes and briefly
presented here. There are many textbooks that the interested reader can turn to for more information (e.g.,
Lohr, 1999, Cochran, 1977).
11.3.1.1 Estimation and Presentation of Frequency Distributions
The simplest display of a variable is a frequency distribution. Frequency distributions of a qualitative
variable show the frequency of each category – the number of observations falling into each category –
and can be presented in table or chart form (e.g., a bar chart). Frequency distributions for quantitative
variables are usually presented in charts since a table with the frequency of each value of the variable can
be unwieldy.
Chapter 7 - Estimation presented estimators using sampling weights which apply to both simple and
complex data. To estimate frequencies, domain estimators are used, where the domain is a category (for a
qualitative data) or a value (for quantitative data).
For example, for qualitative data the usual estimator for the size of the population for a domain of interest
is:
∑∩∈
=
domainSi
idomain
r
wNˆ
where wi is the final adjusted weight of the ith
respondent and Sr is the set of responding units.
For quantitative data, the usual estimator of a domain total is:
∑∩∈
=
domainSi
iidomain
r
ywYˆ
To illustrate the estimation of frequency distributions from a sample survey, consider an SRS of 100 male
employees selected from a population of 1,000 men. One of the survey variables is the nominal variable
type of work which has two categories: manual and office workers. Another survey variable is the
continuous variable systolic blood pressure which was directly measured by a trained nurse and reported
in millimetres of mercury (mm Hg). After the survey, the blood pressure readings were also categorised
into three groups: low, medium or high.
242.
SURVEY METHODS ANDPRACTICES
STATISTICS CANADA
230
The weighted frequency distribution of the qualitative variable type of worker can be shown in tabular
form as:
Table 1: Estimated Number of Men by Type of Worker
Type of Worker Estimated Number of Men
Nˆ
Manual 550
Office 450
Total 1,000
Source: Fictitious Survey of Working Men, Canada, 2002.
(Note that each of the estimates in these tables should also be accompanied by an estimate of sampling
error.)
The weighted frequency distribution of the qualitative variable blood pressure is:
Table 2: Estimated Number of Men by Blood Pressure
Blood Pressure Estimated Number of Men
Nˆ
Low 320
Normal 630
High 50
Total 1,000
Source: Fictitious Survey of Working Men, Canada, 2002.
Joint distributions are useful for identifying unusual combinations. The weighted joint distribution of type
of worker and blood pressure below indicates no incidence of high blood pressure amongst manual
workers (for the population surveyed):
Table 3: Estimated Number of Men by Type of Worker and Blood Pressure
Blood PressureType of Worker
Low Normal High
Estimated Number of Men
Nˆ
Manual 240 310 0 550
Office 80 320 50 450
Total 320 630 50 1,000
Source: Fictitious Survey of Working Men, Canada, 2002.
(Tables of joint distributions are often analysed before data are disseminated to the public in order to
ensure that confidential data are not released, i.e., tables that reveal unique individuals are suppressed. For
more information on disclosure control methods, see Chapter 12 - Data Dissemination.)
Frequency distributions can also be displayed using graphs or charts. In fact, data analysis should begin
with a visual analysis of the data. Graphical displays are important for many reasons, some of which are:
- graphical representations of the data are superior to purely numerical representations for discovering
the characteristic shape of the distribution;
- the shape of the distribution is at least as important as the spread and centre of the distribution;
- the shape of the distribution should determine the choice of parameter (e.g., mean, median or mode)
used to describe the data for a single variable.
243.
ANALYSIS OF SURVEYDATA
STATISTICS CANADA
231
The following types of charts might be included in a report presenting survey results:
- pie chart;
- column chart;
- bar chart;
- line chart;
- box plot.
These will be reviewed in the next section.
11.3.1.1.1 Charts and Diagrams
The type of chart used depends on the data that are to be represented and what the chart is intended to
stress: magnitude, size or trend.
i. Pie charts
A pie chart is a circle divided into slices like a pie, used to display the percentage of the population falling
into different categories of a qualitative variable. For a chart to be useful, the population needs to be
divisible into separate groups (e.g., mother tongue is French or English) and preferably only a few units
fall into an other or not applicable category. Pie charts are used to answer questions about relative
proportions of mutually exclusive components.
When preparing a pie chart, sectors (slices) should be arranged according to size, placing the largest slice
at 12:00 and continuing clockwise with progressively smaller portions. In general, the number of sectors
should be limited to five or six. If there are many small sectors, it may be worth collapsing them. Labels
should be placed outside the slices; arrows and legends should be avoided. A good example of a pie chart
showing household expenditures is illustrated below:
Distribution of Household Expenditures
shelter and
household
23%
taxes
21%
other
19%
transportation
15%
food
14%
personal and
clothes
8%
Source: Fictitious Survey on Household Income and Expenditures, Canada, 2002
Three-dimensional presentations of pie charts (see below) can be confusing since they distort areas and
therefore should be avoided.
244.
SURVEY METHODS ANDPRACTICES
STATISTICS CANADA
232
taxes
21%other
19%
food
14%
transportation
15%
shelter and
household
23%
personal and
clothes
8%
ii. Column charts
A column chart is a series of columns whose heights represent magnitudes (e.g., totals, means or
proportions). Column charts can be used for qualitative or quantitative variables. Column charts should
only be used for a few points and the columns should all have identical widths.
For example, the distribution of systolic blood pressures (a quantitative variable) in the population can be
estimated using weighted sample survey data and can be presented in the following column chart:
Distribution of Systolic Blood Pressure, Canada 2002
0
20
40
60
80
100
120
140
160
140,3 140,5 140,7 140,9 141,1 141,3 141,5 141,7 141,9 142,1 142,3
Systolic Blood Pressure (mm Hg)
EstimatedPopulationCount
Source:Fictitious Survey of Working Men, Canada, 2002
There are a number of variations of the column chart. A grouped column chart has several variables
grouped in bars side by side. There should be no more than three bars in a group. For example, the analyst
might want to compare total revenue, total sales and net income over a period of time. The following is an
example of a grouped column chart, where the side by side columns represent consecutive years and each
group of columns represents the number of passengers visiting a given region by city of passengers’
origin.
Source : Fictitious Survey on Household Income and Expenditures, Canada, 2002
Distribution of Household Expenditures
245.
ANALYSIS OF SURVEYDATA
STATISTICS CANADA
233
Distribution of Passengers' Origin
-
500
1 000
1 500
Calgary Ottawa Toronto Montréal
City of Origin
Estimatednumber
(in000)
1994
1995
Source: Fictitious Survey on Domestic Tourism, Canada 1995,1996
A 100% (or stacked) column chart shows the proportion of the population falling into each category of a
qualitative variable, where each column represents a different domain. The columns are all the same
height and the proportion of most interest should be next to the baseline to facilitate easy comparison. The
variable being compared across different domains should have no more than three categories – too many
can make the stacked column chart almost unreadable. For this reason, in the following example, the
variable satisfaction, which originally had five categories (very satisfied, satisfied, neutral, dissatisfied
and very dissatisfied) was collapsed into three (satisfied, neutral and dissatisfied) and compared for five
domains of interest (hours, staff, delivery, warranty, service):
Client Satisfaction, by Reason for Satisfaction
0%
25%
50%
75%
100%
hours staff delivery warrantee service
dissatisfied
neutral
satisfied
Source: Fictitious Client Satisfaction Survey, Place, Year
In general, column charts are used only for positive values (e.g., population counts, proportions, etc.).
However, a deviation column chart portrays positive and negative values over a period of time. A
negative value simply points down from the baseline instead of pointing up.
iii. Bar charts
A bar chart is a sideways column chart. When preparing a bar chart, bars should be arranged in order of
length (from the longest to the shortest, or vice versa).
If exact values are shown, the chart should be annotated (i.e., the exact value should be placed at the end
of each bar). If these stub headings are lengthy, a bar chart may be easier to read and appear less cluttered
than a column chart. There are many variations on the basic bar chart, corresponding to the different types
of column charts (e.g., stacked, grouped, etc.).
246.
SURVEY METHODS ANDPRACTICES
STATISTICS CANADA
234
The following is an example of a grouped bar chart:
Distribution of Passengers' Origin
- 200 400 600 800 1 000 1 200
Calgary
Ottawa
Toronto
Montréal
City of Origin
Estimated number (in 000)
1995
1994
Source: Fictitious Survey on Domestic Tourism, Canada 1995,1996
iv. Line charts
A line chart shows variation in the magnitude of a variable over a period of time (e.g., totals, means or
proportions over time). Time (the explanatory variable) is placed on the horizontal axis. The range of
values of the variable of interest is placed on the vertical axis. A point (i.e., a measure of magnitude) is
plotted for this variable for each unit of time, and the points are connected in sequence. The lines can
either be straight lines from point to point, or smooth curves. The following are examples of line charts:
Distribution of Systolic Blood
Pressure, Canada 2002
0
20
40
60
80
100
120
140
160
140,3140,6140,9141,2141,5141,8142,1142,4
Systolic Blood Pressure (mm Hg)
EstimatedPopulationCount
Source:Fictitious Survey of Working Men, Canada, 2002
Consumer Price Index: All Items and
Private Transportation
80
90
100
110
120
130
140
150
160
170
1986 1988 1990 1992 1994 1996
All Items
Private
Transportation
Line charts should be used to demonstrate trends or movement. For time series with a large number of
points, line charts are preferable to column charts. For comparing several data series, line charts are the
best way to highlight differences or similarities between groups. If there are obvious trends in the data,
line charts give the user some predictive ability. Steady upward or downward trends, or obvious
periodicity, allow the viewer to interpolate or extrapolate data.
Use consistent intervals for line charts. For example, do not use 1, 2, 5, 8 even if there are no data points
for the other values. Instead use 1, 2, 3, 4, 5, 6, 7, 8. Also, when starting with a large number, or when
there is a gap in the values of one of the axes, use a symbol to indicate the gap.
247.
ANALYSIS OF SURVEYDATA
STATISTICS CANADA
235
It is best not to compare too many series at once, since this can be confusing. The following is an example
of a poor line chart:
Therapeutic Abortions, per 10,000 Child-bearing Aged Women, Canada
and Provinces, 1981, 1993
0
5
10
15
20
25
1981
1982
1983
1984
1985
1986
1987
1988
1989
1990
1991
1992
1993
Newfoundland
P.E.I.
Quebec
Canada
Ontario
Manitoba
Saskatchewan
Alberta
British Columbia
Nova Scotia
New Brunswick
v. Box plots
Summary statistics can also be depicted in a single summary graph: the box plot. A box-plot is used to
study the distribution and the spread of the data. The box itself extends from the first quartile (i.e., the 25th
percentile) to the third quartile (i.e., the 75th
percentile) with a line at the median (i.e., the 50th
percentile).
The ‘whiskers’ or the endpoints of the lines attached to the box represent the minimum and maximum
values. Some statistical packages will also display the mean and standard error of the mean (assuming
SRS) on the box plot; neither one are displayed here.
Distribution of Sales Prices for Houses, June 2002
(Prices in 1,000’s of Dollars)
400
300
200
100
0
Med
1st
Q
3rd
Q
10th
Ct
90th
Ct
Interquartile
range
Source: Fictitious survey of houses sold in June 2002.
For a definition of the median, first quartile, third quartile and 10th
and 90th
percentile and how they are
calculated, see Example 11.1 in the following section for simple data and sections 11.3.2.1 and 11.3.2.2
for complex data. For more information on box plots, see Tukey (1977).
248.
SURVEY METHODS ANDPRACTICES
STATISTICS CANADA
236
11.3.1.2 Location: the Mean, the Median and the Mode
There are three common measures of location: the mean, the median and the mode. For statistical
analysis, the mean is by far the most commonly used for quantitative data. For quantitative data, the
population mean for a census is simply the arithmetic average: the sum of all the values of a variable
divided by the number of values. To estimate the population mean from a simple random sample with
100% response rate, the usual estimator is:
r
Si
i
n
y
Y r
∑∈
=ˆ
where yi is the reported value for the ith
responding unit, and nr is the sample size.
The mean has several advantages compared to other measures of location. The first is that it is easy to
calculate and understand. For many probability sample designs and for large samples in general, it has the
desirable feature of being an unbiased estimator of the population mean. However, there are several
disadvantages to using the mean. When considering integer values, such as the number of children per
household, the mean may be a fraction. For example, the mean number of children per household may be
1.8. Also, the mean cannot be used as a measure of location for qualitative variables. Another
disadvantage of the mean is that it can be strongly affected by extreme values (it moves in the direction of
the extreme values). For example, in a survey of incomes, if a few members of the population have
extremely high incomes, the population mean will be inflated by these individuals. So, if the user wants
an estimate of the central value, he or she may prefer a measure of location that is less sensitive to skewed
distributions or extreme values.
Another measure of location is the median. The median is the middle value of a set of data arranged in
numerical order (listed either from lowest to highest or highest to lowest). When there are an even
number of data points, the median is the mean of the middle two values. The median can be used for both
quantitative and numerical ordinal data and is the best measure of central tendency for ordinal data.
The main advantage of the median is that it is less affected than the mean by extreme values. For
example, in a survey of incomes, the median will be less affected by the presence of a few members with
extremely high incomes. In fact, the median would be unchanged whether the highest income earner is a
millionaire or a billionaire. In the case of sample survey data, the main disadvantage of the median is that
it is usually more difficult to calculate its sampling variance and thus use it for inferential analysis.
The third measure of location is the mode. The mode is the data value that occurs most frequently. It is
the most general of the three measures of central tendency. It can be applied to all types of data but is
most appropriate for qualitative data and is the only measure of central tendency that is meaningful for
nominal data. For example, if an agricultural census asks farmers to list the crop that occupies most of the
land, and if 38 out of the 50 farmers in the population state that this crop is wheat, then wheat is the mode.
The main advantage of the mode is its simplicity – it can be determined from a table or graph of the
frequency distribution of the data. However, the mode has a number of disadvantages. First, it may not be
very descriptive of the data, since the most common category may not occur very often. This problem
usually arises when there are many possible data values. For example, a census on inter-city migration
may collect nominal data asking 2,000 people what city they moved from, and get 1,999 different
answers, with two people sharing a common origin. This common city would be the mode, but it would
not be very meaningful. This is why the mode is infrequently applied to quantitative data, where there are
249.
ANALYSIS OF SURVEYDATA
STATISTICS CANADA
237
usually many possible values. Also, unlike the median and the mean, the mode is not necessarily unique.
It is possible for several categories to be tied for the most common ranking.
The natural question is ‘Which measure should I use?’ What is important is that the measure be
meaningful, appropriate and meet the user’s needs. In general, the mode should be used for nominal data,
the median for numerical ordinal and skewed (i.e., not symmetrical about the mean) quantitative data, and
the mean for quantitative, symmetrically distributed data. When dealing with quantitative data, the choice
should depend on the distribution of the values of the variable. If the distribution is symmetric with just
one peak (e.g., normally distributed) then the mode, median and mean are all the same. The choice in this
case does not matter, but knowing that they are all the same informs the analyst that the data are
symmetric. In the case of a skewed distribution, an estimate of all three measures provides an indicator of
the amount of skewness.
Other measures of location are sometimes used in descriptive statistical analysis. Quartiles are measures
of position that, like the median, require ordering the data values first, but instead of separating the
distribution into two parts (like the median), quartiles define four parts, each containing 25% of the
ordered distribution. Percentiles also order data values, but divide the distribution into 100 even pieces.
The 10th
, the 50th
(the median) and the 90th
percentiles are commonly used statistics.
Example 11.1: Measures of Location for a Census of Home Sales
Suppose that a survey conducts a census of all of the homes sold in the month of June in a particular city
and obtains the following sales figures: (in thousands of dollars): 85, 235, 146, 295, 96, 250, 235, 205,
195 and 375. Sorted in order: 85, 96, 146, 195, 205, 235, 235, 250, 295 and 375.
Table 4: Estimated Measures of Location for Census of Home Sales
Measure of Location Estimate
Mean $211,700
Median $220,000 (i.e., mean of $205,000 and $235,000)
Mode $235,000
1st
quartile (25th
percentile) $146,000 (i.e., smallest value greater than first 25% of values)
3rd
quartile (75th
quartile) $250,000 (i.e., smallest value greater than first 75% of values)
90th
percentile $375,000 (i.e., smallest value greater than the first 90% of values)
11.3.1.3 The Spread
Spread refers to the variability or the dispersion of the data. Chapter 7 - Estimation presented one
measure of spread: the variance, which is calculated as squared differences about the mean value. The
variance of two different distributions were discussed: the population’s and the estimator’s. The
population variance measures the spread of the distribution of all yi in the population (where y is a
variable of interest and yi is the value for the ith
unit). The sampling variance measures the spread of the
distribution of estimates from different samples using the same sample design and estimator. In order to
provide users with information on the quality of the sample survey, all sample estimates should be
accompanied by some measure of sampling error (sampling variance, standard error, coefficient of
variation or margin of error).
Besides the population variance, other measures of population spread include the range and interquartile
range. The range is the difference between the largest and smallest values. Since this measure uses only
two values of the distribution, it gives only a rough idea of the spread and is strongly affected by extreme
values.
250.
SURVEY METHODS ANDPRACTICES
STATISTICS CANADA
238
The interquartile range gives the range of the middle 50% of the data. It is the difference between the
third and first quartile (or the 75th
and 25th
percentile). This measure is less sensitive to extreme values,
thus; it gives a more useful measure of the spread than the simple range. The interquartile range can be
used for all quantitative data.
Example 11.1 (continued): Range and Interquartile Range for a Census of Home Sales
For the census of home sales, the estimated range is $290,000 (i.e., $375,000 - $85,000) and the estimated
interquartile range is $104,000 (i.e., $250,000 - $146,000).
To understand the importance of combining information about the spread with information of location,
consider the following hypothetical case. An employee of a bank selling financial products for retirement
is trying to identify the best location to open a new office. The target market has been identified to be
workers around 45 years old, as they are not too far from retirement but are unlikely to have already
started planning, and they have money available. There are two potential cities in which to open an office.
A statistical report on a census of the cities shows that the mean age of workers is 45 years old in both.
Without other information, the employee may want to open an office in both cities. But looking at the
spread of the data shows that city A workers are all between 40 and 50 years old, and city B workers are
between 15 and 65 years old, with two modal values at 20 and 60 years old. The picture is now quite
different and it may be more beneficial for the bank to build an office in city A (more information would
still be required, for instance knowing how many residents aged 40 to 50 live in each city).
11.3.2 Complex Survey Data
The same domain estimators as presented in Chapter 7 - Estimation and section 11.3.1 above can be
used to estimate frequency distributions, means, totals and proportions for surveys with complex data.
Estimates for order statistics such as the median and interquartile range are more complicated.
11.3.2.1 The Median
The population median is the value of the variable of interest below which half of the population
distribution is found. For complex designs, estimating the population median is more complicated than for
simple designs. For ordinal variables, estimated class sizes are needed. For continuous variables, data
values are sorted in increasing order and estimation weights added until the sum reaches 50% of the
estimated population size. The following example illustrates how to estimate the population median by
estimating the population distribution using weighted counts.
Example 11.2: Estimated Median for a Stratified SRS (see example 7.6 from Chapter 7 - Estimation)
Recall that in this example, the sample has ten observations and two strata. The (sorted) sample data
points are:
251.
ANALYSIS OF SURVEYDATA
STATISTICS CANADA
239
Table 5: Estimated Population Distribution of Incomes from a Stratified SRS
Stratum Unit
Id
Final
Weight
Cumulative
Weight
Cumulative
relative weight
Type of
Farm
Reported
Income ($)
2 8 16.5 16.5 0.16 1 14,000
1 2 5.67 22.17 0.22 2 15,000
2 10 16.5 38.67 0.38 1 22,000
2 7 16.5 55.17 0.55 1 30,000
1 6 5.67 60.84 0.60 1 40,000
2 9 16.5 77.34 0.77 2 48,000
1 4 5.67 83.01 0.83 1 67,000
1 1 5.67 88.68 0.88 1 75,000
1 5 5.67 94.35 0.94 2 80,000
1 3 5.67 100.02 1.0 1 125,000
Type of Farm
1=Crop (N1=34, n1=6)
2=Livestock (N2=66, n2=4)
The estimated mean income for the entire population of farms is:
1.595,41
02.100
340,160,4ˆ ===
∑
∑
∈
∈
r
r
Si
i
i
Si
i
w
yw
Y
Estimating the Median from the Estimated Distribution
0 .0
0 .1
0 .2
0 .3
0 .4
0 .5
0 .6
0 .7
0 .8
0 .9
1 .0
in c o m e
0 1 0 0 0 0 2 0 0 0 0 3 0 0 0 0 4 0 0 0 0 5 0 0 0 0 6 0 0 0 0 7 0 0 0 0 8 0 0 0 0 9 0 0 0 0 1 0 0 0 0 0 1 1 0 0 0 0 1 2 0 0 0 0 1 3 0 0 0 0
The estimated median is between $22,000 and $30,000 since the cumulated weights go from 0.38 to 0.55
for these 2 figures; to obtain a single value, a common practice is to do a linear interpolation between the
points ($22 000, 0.38) and ($30 000, 0.55) to obtain the co-ordinates of the median point (Med, 0.50); this
is illustrated above (the unweighted estimate of the median is $44,000).
252.
SURVEY METHODS ANDPRACTICES
STATISTICS CANADA
240
647,27)38.050.0(
38.055.0
000,22000,30
000,22ˆ =−
−
−
+=deM .
11.3.2.2 The Spread
To illustrate the concept of sampling variance, it is easiest to present the case of survey data from an SRS
or stratified SRS without weight adjustments, as presented in Chapter 7 - Estimation. In practice,
however, virtually all surveys have more complex data; even if the sample design is SRS or Systematic
(SYS), a weight adjustment for nonresponse is usually applied, so the SRS or stratified SRS formulas do
not apply.
The correct variance formula depends on the sample design and the point estimator (i.e., the estimator for
the sampling variance of a mean depends on the estimator of the mean). Variance estimation for complex
data rapidly becomes complicated. In order to correctly estimate the sampling error for a survey with
complex data, a survey statistician familiar with this type of problem should be consulted. Simply running
software – even statistical software – is not recommended, since oftentimes the software assumes SRS
with no weight adjustments.
In order to estimate interquartile ranges for complex data, use the approach explained above for the
median to estimate the 25th
and 75th
percentile.
11.3.2.2.1 Confidence Intervals in the Presence of Bias
So far, the discussion of estimation and analysis of survey data has assumed that there is no bias. Chapter
3 - Introduction to Survey Design listed the four sources of nonsampling error which can cause bias:
coverage, measurement, nonresponse, processing errors. Bias can also be caused by the estimator: the
analyst may prefer to use an estimator with small bias but good precision rather than an alternative
unbiased estimator with poorer precision.
The total variation about the true value of a parameter, θ, is called the Mean Square Error:
( ) .)()(
))(())((
)()(
2
22
2
tBiastVar
tEtEtE
tEtMSE
+=
−+−=
−=
θ
θ
Where t is the estimate of θ for a realised sample, E(t) is the expected value, or the average estimate over
all possible samples, and Var(t) is the sampling variance of t.
When bias is present, E(t) = θ+B. When there is no bias, E(t) = θ, and the total variation about the true
value, θ, is simply the sampling variance:
).(
))(())((
)()(
22
2
tVar
tEtEtE
tEtMSE
=
−+−=
−=
θ
θ
253.
ANALYSIS OF SURVEYDATA
STATISTICS CANADA
241
Confidence intervals (previously discussed in Chapter 7 - Estimation and Chapter 8 - Sample Size
Determination and Allocation) are commonly used to present results from probability surveys. Given an
estimate t and its estimated standard error, )(ˆ)(ˆ traVtES = , a confidence interval can be constructed as
follows:
))(ˆ),(ˆ( tESzttESzt ×+×−
where z is a value corresponding to the level of confidence (e.g., z=1.96 for a 95% confidence interval)
from a standard normal distribution table. This is the standard theory that is taught in undergraduate
statistics classes. It applies to means, proportions, regression parameters, and many other statistics. Its
theoretical foundation is the Central Limit Theorem in infinite populations; its practical limitation is that
it requires a large enough sample for the asymptotic theory to apply.
An example of a 95% confidence interval is:
According to a recent survey, 15% of Ottawa residents attend religious services every week. The
results, based on a sample of 1,345 residents, are considered accurate within plus or minus three
percentage points 19 times out of 20.
For unbiased estimators that have normal, or approximately normal, sampling distributions, a 95%
confidence interval means that if the survey were repeated many times, about 19 times out of 20 (or 95%
of the time), the confidence interval would cover the true population value.
Distribution of an Estimator, t, with and without Bias
B/SE(t)=1
When bias is present there is usually no measure of Bias(t) – if there were, then )(ˆ tsaBit + would be an
unbiased estimate of θ and a confidence interval could be constructed about this value – instead, a
confidence interval is constructed about t using )(ˆ)(ˆ traVtES = instead of )(ˆ tESM .
254.
SURVEY METHODS ANDPRACTICES
STATISTICS CANADA
242
The impact of bias on the confidence interval is especially felt in the coverage probability (‘is this really
95%?’). In the presence of bias, if the usual estimator for a confidence interval is used then the confidence
interval will be constructed about E(t) = θ+B, yielding the blue curve on the right (the coverage
probability is the white area under the blue curve). If the analyst is unaware that bias exists and thinks that
he or she is estimating the red curve on the left, then the coverage probability for the confidence interval
about θ (the white space under the red curve) is much less than expected and the confidence interval is
asymmetric.
Särndal et al. (1992) give the following table of the effective coverage probability as a function of the
relative bias, that is the ratio .)(/ tVarB
Table 6: Coverage Probability given .)(/ tVarB
Bias
Ratio
Coverage
probability
0.00
0.05
0.10
0.30
0.50
1.00
0.9500
0.9497
0.9489
0.9396
0.9210
0.8300
As stated already, in practice, B is unknown but the survey designer and the survey user must be aware of
its existence and its detrimental effect.
Often the survey report or data analysis report includes tables of estimated standard errors or coefficients
of variation, that is the ratio of the sampling error to the estimate (in percent), so that users can calculate
their own confidence intervals and perform their own hypothesis tests. These tables should be
accompanied by an explanation of how they can be used to perform analytical tests. Information on bias
and its implications should also be presented.
11.4 Testing Hypotheses About a Population: Continuous Variables
Recall that sample surveys are typically conducted in order to study the characteristics of a population,
build a database for analytical purposes or test a hypothesis. Most of the theory and methods that have
been covered in this manual, so far, pertain to describing the population and its characteristics: How many
men and women are there in the population? How many are smokers? What proportion of the population
are low income families? What is the median household income?
This section focuses on testing hypotheses about the population: is the proportion of male smokers
different from the proportion of female smokers? Is the proportion of low income families the same
across all provinces? Does life expectancy vary by province?
11.4.1 Introduction: The Elements of a Test
Hypothesis testing is a procedure to verify whether or not the sample data support statements made about
the population. A hypothesis is a statement, or theory, about the true population value of a characteristic.
Hypothesis testing involves testing a null hypothesis, Ho, against an alternative hypothesis, H1. For
255.
ANALYSIS OF SURVEYDATA
STATISTICS CANADA
243
example, in an experiment where a coin is tossed repeatedly, the null hypothesis might be Ho : the coin is
unbiased and the alternative hypothesis is H1 : the coin is biased.
Using data from a sample, the probability that the observed values are the chance result of sampling,
assuming the null hypothesis is true, is calculated. If this probability turns out to be smaller than the
significance level of the test, the null hypothesis is rejected.
There are four components to a hypothesis test: the null and alternative hypotheses, the test statistic, and
the significance level. One could add a fifth element: a conclusion.
i. The null hypothesis
The null hypothesis is a statement about a population parameter that the analyst wants to test and is
denoted by Ho. Examples of null hypotheses might be:
- there is no difference in the mean incomes from the two provinces, 21: YYHO = ;
- the proportion of smokers in the population is 40%, 4.: =PHO ;
- the mean age of the population is 38, 38: =YHO .
ii. The alternative hypothesis
This is the hypothesis against which the null hypothesis is tested and is often denoted by H1 or HA. The
alternative hypothesis is often a statement about the population that is expected to be true. The alternative
hypothesis can only be accepted if the null hypothesis cannot be supported by the data for a given level of
significance. For example, alternative hypotheses to the null hypotheses above might be:
- the mean incomes from the two provinces are different, 211 : YYH ≠ ;
- the proportion of smokers in the population is greater than 40%, 4.:1 >PH ;
- the mean age of the population is less than 38, 38:1 <YH .
iii. The test statistic
The test statistic is a value calculated from a sample (or samples) in order to test a hypothesis about the
population from which the sample was drawn. The value of the test statistic depends on the data, the
hypothesis being tested, the significance level and the estimator being used to estimate the parameter.
Typically, the test statistic requires that the estimator be unbiased (or approximately unbiased) and the
sampling distribution of the estimator be known. For example, a z-statistic is normally distributed, a chi-
squared statistic has a chi-squared distribution and an F-statistic has a Fisher-Snedecor F-distribution.
iv. The significance level
The only possible outcomes of a hypothesis test are reject the null hypothesis or do not reject the null
hypothesis. Rejecting the null hypothesis does not always mean that it is false, just as failing to reject the
null hypothesis does not mean that the null hypothesis is necessarily true. There are actually two types of
false conclusions: concluding that the null hypothesis is false when it is actually true and concluding that
the null hypothesis is true when it is actually false.
256.
SURVEY METHODS ANDPRACTICES
STATISTICS CANADA
244
Table 7: Types of Error
The null hypothesis is, in fact:
TRUE FALSE
TRUE IIThe test concludes that
the null hypothesis is: FALSE I
These two types of false conclusions are known as Type I errors and Type II errors, respectively. The
significance level of a test, denoted by α, is the accepted risk of committing a Type I error, in other
words, rejecting a true null hypothesis. For example, α = .05 is commonly used. If less risk is acceptable,
α can be set lower, say α = .01. If more risk is allowable, α = .10 may be used.
The Cambridge Dictionary of Statistics (Everitt, 1998) illustrates significance levels as follows: Suppose
a coin is tossed 100 times and comes down heads every time. There is strong reason to suspect the coin of
being biased, but there is the remote possibility that it is unbiased and just happened to fall that way.
What is known is that the probability of a fair coin landing the same way 100 times out of 100 is very
small: 2 x (½)100
, or 1.6 x 10 –30
(this is the value of the test statistic). Based on this evidence, the analyst
can confidently reject the null hypothesis, Ho: the coin is unbiased in favour of the alternative hypothesis,
H1: the coin is biased, knowing that there is only a tiny probability that our conclusion is incorrect.
Suppose, however, that the coin was only tossed 6 times and it came down heads every time. The
probability of a fair coin landing this way is: 2 x (½)6
, which is .031. While this is unlikely, it is not
impossible. With a significance level of α = .05, the analyst would reject the null hypothesis; but with a
stricter significance level of α = .01, the analyst would accept the null hypothesis.
There are two types of hypothesis tests: one-tailed and two-tailed tests. A test is one-tailed when the
rejection region for the null hypothesis, expressed graphically, consists of one tail of the estimator’s
sampling distribution. (The rejection region is the range of values of the test statistic that would lead to
rejecting the null hypothesis.) With a two-tailed test, the rejection region consists of both tails of the
distribution. Usually two-tailed tests refer to normally distributed estimators. For example, the above
alternative hypothesis that the mean incomes from the two provinces are different (e.g., 211 : YYH ≠ )
would use a two-tailed test while the other two alternative hypotheses would use one-tailed tests.
11.4.2 Simple Survey Data
The material covered in this section is usually the topic of undergraduate statistics courses; most of the
details and complications will be skipped on purpose. The interested reader is referred to any elementary
textbook (e.g., Snedecor and Cochran, 1989, Wonnacott and Wonnacott, 1977).
11.4.2.1 Testing for a Single Mean
Given a data set that has been obtained by a simple random sample scheme from a population, the
estimated population mean, Yˆ , is unbiased and (with a large enough sample) almost normally distributed
with mean, Y , and estimated standard error, )ˆ(ˆ YES . If an analyst wishes to test the hypothesis that the
value of Y is k (i.e., kYHO =: ), the following test statistic can be used:
257.
ANALYSIS OF SURVEYDATA
STATISTICS CANADA
245
)ˆ(ˆ
ˆ
YES
kY
z
−
=
This test statistic is called a z-statistic since if Ho is true, then z has an approximately standard normal
distribution with mean equal to 0 and standard error equal to 1. Note that this is the same z-statistic that is
used to construct confidence intervals about the mean (see section 7.3.2.2).
To choose the level of significance for the test, the analyst uses the known probability of z lying within a
certain number of standard errors of its mean. For example, it is known that 5% of the z-values are larger
in magnitude than 1.96. So, to construct a two-tailed test (e.g., kYH ≠:1 ) using a z-statistic with
α = 0.05, the rejection region would be values of z that are less than –1.96 or greater than 1.96. In the case
of a one-tailed test (e.g., kYH >:1 ) to construct a test with α = 0.05, the rejection region would be
values of z that are greater than 1.65.
Note that for large samples it is often reasonable to assume that Yˆ follows a normal distribution. This is
because of the Central Limit Theorem which states that, under certain conditions, the distribution of a
sample mean approaches the normal distribution as the sample size increases.
Example 11.3: Testing a Single Mean from an SRS
Suppose a statistical agency conducts a health survey and collects the data using a probability sample.
The agency wishes to test the hypothesis that the population is overweight, which is defined as the mean
weight of the population being greater than 100 kg. The usual estimator for the population mean is known
to be unbiased and normally distributed, so a z-statistic is used with a significance level of %5=α . Since
a one-tailed test is appropriate, in order to be 95% certain when rejecting the null hypothesis, the rejection
region consists of all z-values that are greater than 1.65.
The hypothesis test is:
>
≤
kgYH
kgYH
100:
100:
1
0
The test statistic is:
)ˆ(ˆ
100ˆ
YES
Y
z
−
=
If the survey estimates are Yˆ = 102.1 and )ˆ(ˆ YES = 1.5, then:
4.1
5.1
1.2
5.1
1001.102
==
−
=z .
Since 1.4 is less than 1.645, it does not lie in the rejection region. Therefore, there is not enough evidence
to reject the null hypothesis.
258.
SURVEY METHODS ANDPRACTICES
STATISTICS CANADA
246
11.4.2.2 Comparing Two (Sub-)population Means
The approach to the test on one mean can readily be extended to two means: the difference between two
groups is of interest, or perhaps, the same group measured at two points in time. Now, it is assumed that a
sample was drawn from each group, that the samples are independent and that each sample is large
enough to justify the application of the Central Limit Theorem.
Now, the first group has unknown mean 1Y and the second group has unknown mean 2Y ; if the null
hypothesis is true, these unknown means are equal. Thus, their difference is zero and their estimates
should be quite close to one another. Any large observed difference between the estimates must be either
because the samples are unfortunately bad (but there is no good reason for that), or because H0 is false.
Following this rationale, the test can be laid out as:
≠
=
211
210
:
:
YYH
YYH
with the asymptotically normal test statistic:
)ˆ(ˆ)ˆ(ˆ
ˆˆ
21
21
YraVYraV
YY
z
+
−
= .
The level of the test is decided in advance, usually 5%. Since this is a two-tailed test, this corresponds to
rejecting the null hypothesis if the test statistic lies outside (–1.96, 1.96). (Note that this test statistic is
only correct if the two samples are independent.)
Example 11.4: Testing Two Means from an SRS
Suppose an analyst is interested in determining whether the people in one province weigh more, on
average, than the people another province. A simple random sample was drawn in each province and the
results are 1
ˆY = 95, 2
ˆY = 105, )ˆ(ˆ
1YES = 1.4, )ˆ(ˆ
2YES = 2.2. Then the test statistic is:
83.3
80.6
10
2.24.1
10595
22
−=
−
=
+
−
=z
and the two groups are declared to be significantly different.
11.4.2.3 Comparing Many (sub-)population Means: the One-way ANOVA and Linear Regression
Models
The natural extension of the above theory is to develop a test for the comparison of the means of many
groups. With ANOVA (analysis of variance) no assumption is made about the relationship that could
exist among the means; with linear models, a linear relationship among the means is hypothesised. Linear
models fall in a class of statistical techniques used to determine if a response variable is linearly related to
one or more explanatory variables. A key characteristic of linear models is that the effects of the various
explanatory variables are additive.
259.
ANALYSIS OF SURVEYDATA
STATISTICS CANADA
247
11.4.2.3.1 Analysis of Variance (ANOVA)
ANOVA is used to assess the effects of one or more qualitative variables (called factors) on a continuous
response variable. The differences between means are tested by investigating the variability in a set of
observations to determine if the variability is random, or if it can be attributed to the factor(s).
The simplest ANOVA involves a one-way design in which a sample is drawn from each of the k different
groups of a single factor (i.e., k different means are compared and the null hypothesis is that they are all
equal). For example, the analyst might want to test the null hypothesis that there is no difference in mean
incomes for ten provinces:
10987654321: YYYYYYYYYYHO ========= .
The mathematical expression for the ANOVA model has the following form:
iggiy εγγ ++= 0
where ygi is the value of the response variable, income, for the ith
unit of the gth
province; γ0 is the mean
income across all provinces; γg is the difference between province g’s mean income and the national
income; if all means are equal, ∑γg = 0; finally, εi is assumed to be a random error variable with mean 0
and variance σ2
.
The total variation in the population is divided into variation due to the differences between the k groups
and variation due to differences between subjects within the same group:
( )∑∑∑∑∑ −+−=−
g i
ggi
g
gg
g i
gi YyYYNYy
222
)()(
where Ng is the number of units in group g, Y is the mean of group g and Y is the overall mean.
If independent random samples have been drawn from g normally distributed populations, then this
variation can be estimated as follows:
( )
)()()(
)()(
222
ResidualSSModelSStotalSS
yyyynyy
g Si
ggi
g
gg
g Si
gi
+=
−+−=− ∑∑∑∑∑ ∈∈
where ng is the number of sampled units in group g, gy is the sample mean of group g, y is the overall
sample mean and SS stands for ‘sums of squares’.
If the k sample means are all the same, they are also equal to the overall mean y . Then, within the limits
of random variation, the between group variance, namely:
1
)(
)(
−
=
g
ModelSS
ModelMS
should be close to zero.
260.
SURVEY METHODS ANDPRACTICES
STATISTICS CANADA
248
This can be assessed using an F-test built as follows:
≠
==
≡
≠
∀=
kjYYH
YYH
jH
gH
kjj
g
,somefor,:
:
somefor,0:
,0:
1
1010
1
0 L
γ
γ
with the test statistic
)1(;1~
)1(
)(
)1(
)(
)(
)(
−−
−
−
== gngg
g
F
ng
ResidualSS
g
ModelSS
ResidualMS
ModelMS
F
This test statistic has a Fisher-Snedecor F-distribution with (g-1) and g(ng-1) degrees of freedom. The
critical values are read off ‘F tables’ with the appropriate level α and degrees of freedom. The test will
find a significant difference among the means if the calculated F statistic is large enough, that is, larger
than the tabulated critical value.
The case described here is for the simplest sample design: assuming equal size samples in each group and
simple random sampling in each group. This is not typical situation of large scale surveys, and need not
be efficient in practical applications of experimental designs.
For more information on ANOVA, see any introductory statistics book (e.g., Lohr, 1999, Wonnacott and
Wonnacott, 1977), or books on experimental designs (Box, Hunter, Hunter, 1978).
11.4.2.3.2 Linear Regression
Linear regression is probably the best known linear model. Whereas ANOVA is used to determine if one
group mean is significantly different from the rest, regression is used to identify or model the relationship
among the different group means. Another application of linear regression is to make predictions or
forecasts of the response variable for values of the known related explanatory variables. In linear
regression, the response variable is usually a continuous variable (e.g., age, weight, height) and the
explanatory variables are either qualitative or quantitative. When only one explanatory variable is used,
the regression is called simple, when several are used, the regression is called multiple.
For example, suppose that a survey collecting weight and height data has been conducted and the analyst
is interested in how these two variables are related. From the following graph of the data, there seems to
be a linear relationship between the two variables.
The mathematical model for this relationship has the following form:
iii xy εββ ++= 10
where yi is the value of the continuous response variable, weight, for the ith
unit; xi is the value of the
explanatory variable, height, for the ith
unit; β0 is the y-intercept (the value of y when xi=0); β1 is the slope
of the line (the change in yi for one unit increase in xi). εi is assumed to be a random error variable with
mean 0 and variance σ2
. In other words, it is assumed that yi is approximately linearly related to xi and
that observed values of yi deviate above and below this line by a random amount, εi. β0 and β1 are
unknown parameters and are estimated from the sample data. To determine whether or not the two
261.
ANALYSIS OF SURVEYDATA
STATISTICS CANADA
249
variables are linearly related, confidence intervals can be created for β1 and hypothesis tests about its true
value can be performed.
Weight by Height
40
50
60
70
80
90
100
110
140 150 160 170 180 190 200
Height (cm)
Weight(kg)
The parameter estimates can be computed from the observed data (here, assuming simple random
sampling) as:
( )( )
( )
.ˆˆ,ˆ
1021 xy
xx
yyxx
i
ii
βββ −=
−
−−
=
∑
∑
Of course, sampling errors for these estimates can be obtained as well. The test for the significance of the
relationship is the test on β1; the relationship is significant if the line is not horizontal, that is β1 ≠ 0. The
null and alternative hypotheses are:
≠
=
0:
0:
11
10
β
β
H
H
the test statistic is the familiar z:
)ˆ(ˆ
ˆ
1
1
β
β
ES
z =
which has a standard normal distribution under the usual large sample assumptions. The decision criterion
is identical to that seen earlier, namely reject H0 if values of z lie in the rejection region for the chosen
level α.
Example 11.5: Linear Regression for Height and Weight Data Collected from an SRS
Suppose that the height and weight data above were collected from an SRS and that the following
estimates were calculated:
262.
SURVEY METHODS ANDPRACTICES
STATISTICS CANADA
250
Table 8: Estimated Values for Bo, B1
Estimate SE(Estimate) z
0
ˆβ -90.88 7.66
1
ˆβ 0.95 0.04 21.09
The analyst would conclude that there is a significant relationship between the weight and height of
people in the population.
Regression is also used by surveys during estimation or imputation to improve the quality of the estimates
(see Chapter 7 - Estimation and Chapter 10 - Processing). For more information on regression analysis
and how to calculate β0 and β1, see Draper and Smith (1981).
11.4.3 The Case of Complex Survey Data
11.4.3.1 Testing for a Single Mean
The test for a mean can be readily extended to the case of complex survey data. In effect, the large sample
requirements for the test are covered by the finite population version of the Central Limit Theorem. The
correct estimation of the sampling error of the estimator of the mean (that is, accounting for stratification
and clustering of the data) replaces the traditional requirements that the data be independent and
identically distributed of the traditional requirements.
11.4.3.2 Comparing Many Sub-population Means: Adapting the ANOVA and Regression
ANOVA and regression models can be applied to populations and inferential analyses can be made when
samples with complex survey designs are drawn from those populations. Few books devote space to the
estimation and testing of the parameters of ANOVA and linear regression models under complex designs,
those who do regroup them under the umbrella of linear models and treat both at once.
The theoretical interest and difficulties are beyond the scope of this manual. By now, the reader should be
fully aware that ordinary statistical packages will not correctly account for the eventual complexities of
the design of interest, and would probably yield misleading results. More can be found in Chapter 8 of
Thompson, 1992, Chapter 7 of Särndal et al., 1992, and in Chapter 8 of Lehtonen and Pahkinen, 1995.
11.5 Testing Hypotheses About a Population: Discrete Variables
The previous section 11.4 discussed testing hypotheses using continuous variables. Often, analysis is
performed on categorical data (e.g., analysis of counts for different categories). For example, in the joint
distribution presented in Table 3, the analyst may want to test if the proportion in the population of office
workers with low blood pressure is different from the proportion of manual workers with low blood
pressure.
263.
ANALYSIS OF SURVEYDATA
STATISTICS CANADA
251
11.5.1 Tests of Independence and Tests of Homogeneity with Simple Survey Data
The relationships among discrete variables in a population – particularly discrete variables with a small
number of distinct values – are often examined and tested through the use of contingency tables of counts
and proportions.
11.5.1.1 Testing for Independence
In the case of a two-way contingency table, it is often of interest to determine whether two characteristics
defining the rows and the columns of the table are independent. Let variable A, with r different values, be
the characteristic defining the rows of the table and let variable B, with c different values, be the
characteristic defining the columns. The observed proportions (or counts) from the sample are displayed
in an r×c table with the value in the ith
row and the jth
column being the proportion (or number) of
individuals who simultaneously have value i for variable A and value j for variable B.
Table 9: Sample Counts in a Two-Way Contingency Table with r Rows and c Columns
Variable A Variable B Sample Sizes
1 2 … C
1 n11 n12 N1c n1+
2 n21 n22 N2c n2+
3
…
r nr1 nr2 nrc nr+
n+1 n+2 N+c n++
Let pij represent the proportion of the population in cell (i, j) and pi+ and p+j represent the proportions for
the ith
row and jth
column respectively. These may be estimated by
++
=
n
n
p
ij
ijˆ ,
++
+
+ =
n
n
p i
iˆ and
++
+
+ =
n
n
p
j
jˆ .
Then the hypothesis of independence to be tested can be written as:
≠
===
++
++
jipppH
cjripppH
jiij
jiij
andsomefor,:
...1;...1,:
1
0
.
Note that ∑i∑j pij = 1, because every individual in the population under study falls into one and only one
cell. For a data set that has been obtained by a simple random sample scheme from a population, common
statistics for testing independence are Pearson’s X2
( )
∑ ++
++−
=
ji ji
jiij
pp
ppp
nX
,
2
2
ˆˆ
ˆˆˆ
,
and the likelihood ratio G2
,ˆwith,
ˆˆ
ˆ
lnˆ2
,
2
++++
=
= ∑ n
n
p
pp
p
pnG
ij
ij
ji ji
ij
ij
where nij is the sample count in cell (i, j) and ijpˆ is the corresponding sample proportion.
264.
SURVEY METHODS ANDPRACTICES
STATISTICS CANADA
252
Under Ho and the other hypotheses about sampling, both statistics have an asymptotic chi-square
distribution with (r-1)(c-1) degrees of freedom. For a given level of significance α, the null hypothesis is
rejected if X2
(or G2
) is larger than the tabulated critical value χ2
(1-α);(r-1)(c-1).
Example 11.6: Test of Independence for Contingency Table Data from an SRS
You wish to examine whether the frequency of reading the daily paper (characteristic A, i=1 if daily, i=2
if sometimes, i=3 if never) is independent of one’s political opinions (characteristic B, j=1 if extreme right
wing, j=2 if moderate right wing, j=3 if moderate left wing, j=4 if extreme left wing). Suppose a simple
random sample of n=500 is selected and the two characteristics are measured on all individuals. The
survey results are:
Table 10: Survey Estimates
Political Opinions
Left Wing Right WingReads the
Paper… Extreme Moderate Moderate Extreme Total
Daily Frequency
Proportion (%)
11n = 35
11ˆp = 7.0
50
10.0
36
7.2
6
1.2
127
+1ˆp = 25.4
Sometimes Frequency
Proportion (%)
46
9.2
124
24.8
72
14.40
16
3.2
258
51.6
Never Frequency
Proportion (%)
28
5.6
50
10.0
33
6.6
4
0.8
115
23.0
Total Frequency
Proportion (%)
109
1ˆ +p = 21.8
224
44.8
141
28.2
26
5.2
500
100.0
The results of the tests are
Table 11: Test Statistics
Statistic Df Value p-value
Pearson’s X2
6 6.86 0.334
Likelihood ratio G2
6 6.90 0.329
As the test values are well below the critical value for α=0.05, χ2
0.95;6= 12.59, there is not enough
statistical evidence to confirm that political opinions and frequency of reading a newspaper are linked.
Alternatively, one can compare the probability of obtaining a result at least as extreme as the one obtained
(for example, Pr(X2
≥ 6.86) = 0.334) to α, the level of the test (here, α = 0.05). That probability is called a
p-value. If the p-value is larger than α, then one can say, always supposing H0 true, that what was
observed was not extreme enough to reject the null hypothesis.
11.5.1.2 Testing for Homogeneity
Another simple case with discrete variables is testing for the homogeneity of proportions across
populations, where an independent sample has been selected from each population. For example, the
comparison across provinces of the proportion of individuals speaking neither, one, or both official
languages, using a national survey with independent samples within each province would be a test of
homogeneity.
265.
ANALYSIS OF SURVEYDATA
STATISTICS CANADA
253
In this situation, suppose that r populations are being compared. Let ijp | be the proportion of individuals
in the ith
population having the jth
value of a c-category discrete variable. Since each individual in the ith
population has to fall into one of the c categories, 1| =∑j
ijp . The hypothesis to be tested is
≠
====
jkippH
cjpppH
kjij
rjjj
oneleastatforandandsomefor,:
...1,...:
||1
|2|1|0
.
Suppose that independent simple random samples of sizes ni+, i=1, …, r, are chosen from each of the
populations. Let nij be the number of individuals from the ith
population with the jth
value of the discrete
variable. Obviously, +=∑ i
j
ij nn , the sample size. The counts may be shown in a r×c table and the
proportion pj|i may be estimated by .ˆ |
+
=
i
ij
ij
n
n
p
Pearson’s statistic for testing homogeneity has the form:
( )
∑ ∑ ++
+
+
+
+
++
+
=
−
=
r
i
j
j
c
j j
jiji
H
n
n
p
p
pp
n
n
nX .ˆwhere,
ˆ
ˆˆ 2
|2
)(
There is also a corresponding likelihood ratio statistic.
Straightforward calculations will show that X2
(H) can also be written as
( )
∑∑ ++
++−
=
r
i
c
j ji
jiij
H
pp
ppp
nX
ˆˆ
ˆˆˆ 2
2
)( ,
which has the same form as Pearson’s X2
statistic for testing independence. Also, under the null
hypothesis of homogeneity, X2
(H) has an asymptotic Chi-square distribution with (r-1)(c-1) degrees of
freedom.
Example 11.6 (continued): Test of Homogeneity
Suppose that, in the political opinion survey examined above, instead of a simple random sample, four
independent simple random samples had been taken, each from a different political opinion group. The
test of homogeneity would be testing whether the frequency of reading the paper is the same for each
political group.
11.5.1.3 Use of Log-Linear Models when Testing Hypotheses
Relationships among the proportions in the cells of a contingency table may often be expressed in the
form of a log-linear model. For a two-way table, for example, a saturated log-linear model is in the form
of a 2-factor ANOVA model with interaction:
266.
SURVEY METHODS ANDPRACTICES
STATISTICS CANADA
254
( )
( ) ( ) 0
0with
)(ln i
==
==
+++=
∑∑
∑∑
j
ij
i
ij
ji
ijjijp
αβαβ
βα
αββαµ
The earlier independence hypothesis is equivalent to testing for the absence of interaction and can be re-
written as:
( ) .,,0:0 jiH ij ∀=αβ
Test statistics for many different hypotheses about parameters of log-linear models have been developed,
as seen, for example, in Agresti (1996). The test statistic for testing independence (which is not given
here) has an asymptotic Chi-square distribution with (r-1)(c-1) degrees of freedom when the hypothesis is
true.
11.5.2 Tests of Independence and Tests of Homogeneity with Complex Survey Data
Tests for properties such as independence or homogeneity of discrete variables in the population may also
be carried out with data collected from a survey with a complex design. However, the tests used in the
simple survey case are not applicable to the complex case without modification. First of all, a contingency
table of sample counts or of simple proportions, ignoring the probabilities of selection, would not give an
accurate picture of the association between the discrete variables determining the cells of the table. As
well, the use, without modification, of the test statistics for independence and homogeneity given in
11.5.1.1, could lead to incorrect conclusions (since these test statistics no longer follow a central chi-
square distribution when the hypothesis is true). In what follows, only the test for independence will be
discussed, although similar approaches are available for the test of homogeneity.
Many different approaches have been proposed for accounting for a complex survey design when testing
for independence. Thomas et al. (1996) describe more than 25 methods and give an extensive
bibliography; they also compare the performance of these methods through a simulation study. Lohr
(1999) gives a clear account of the main methods that have been included in computer software for
analysis of data from complex surveys.
One class of approaches consists of adjustments to statistics similar to the Pearson and likelihood ratio
statistics that were described above for data from simple survey designs. The starting step for these
approaches is to modify the X2
and G2
test statistics defined in 11.5.1.1 by replacing
++
=
n
n
p
ij
ijˆ with
∑
∑
∈
∈
=
Sk
k
Sk
kijk
ij
w
yw
pˆ
where
=
otherwise,0
cellinisif,1 (i,j)y
y k
kij
and wk is the weight of the kth
sampled individual.
267.
ANALYSIS OF SURVEYDATA
STATISTICS CANADA
255
This modification alone is not sufficient since, under H0, these modified statistics, which we will denote
by X2
m and G2
m do not follow a χ2
(r-1)(c-1) distribution. Further adjustments are required, such as
multiplying the X2
m and G2
m statistics by a constant to come up with statistics that may approximately
follow a Chi-square distribution. Two well-known adjustments which have been implemented in some
software packages are described below.
The first-order corrections to X2
m and G2
m (Rao and Scott, 1981, 1984) – often called ‘first-order Rao-
Scott corrections’ – consist of matching the asymptotic mean of the test statistics to the mean of a
χ2
(r-1)(c-1) distribution. The corrected statistics have the form
δˆ
2
2 m
RS
X
X = and
δˆ
2
2 m
RS
G
G = , where δˆ is a
function of the design effects for estimating the cell proportions pij and the marginal proportions pi+ and
p+j. The correction thus requires the facility to do variance estimation for the estimated proportions
involved in the formulas for X2
m and G2
m. X2
RS and G2
RS may then be compared to a χ2
(r-1)(c-1) distribution.
The first-order corrections only adjust X2
m and G2
m so that their means are the same as that of a random
variable with a χ2
(r-1)(c-1) distribution. Rao and Scott (1981, 1984) have also proposed a second-order
correction – often called ‘Satterthwaite correction’- that matches both the means and variance of the test
statistic to the mean and variance of a χ2
distribution. This second-order correction is somewhat more
involved to compute than a first-order correction, but may perform better when the cell design effects
vary considerably.
Example 11.7: Test of Independence for Data from a Stratified Cluster Sample
(Lohr, 1999, p. 332-334)
In a survey on youth and criminality (Survey of Youth in Custody) conducted by the U.S. Department of
Justice in 1987, a sample of 2,621 juveniles and young adults residing in long-term state-operated
juvenile institutions was taken. The sample is a stratified cluster sample of individuals in some 52
institutions selected with unequal probabilities. Interviews collected information on family background,
criminal history, and drug and alcohol use. Using the survey data, the following table was built to
investigate a possible relationship between age and whether or not the criminal offence was violent; the
weighted proportions were found to be:
Table 12: Estimated Proportions (Using Weights)
Age Class
≤ 15 16 or 17 ≥ 18
No 0.1698 0.2616 0.1275 0.5589
Violent Offence?
Yes 0.1107 0.1851 0.1453 0.4411
0.2805 0.4467 0.2728 1.0000
If the unequal selection probabilities and clustered design were ignored, the estimated proportions would
be:
Table 13: Unweighted Proportions
Age Class
≤ 15 16 or 17 ≥ 18
No 0.1389 0.2823 0.1328 0.5540
Violent Offence?
Yes 0.0908 0.1969 0.1583 0.4460
0.2297 0.4792 0.2911 1.0000
268.
SURVEY METHODS ANDPRACTICES
STATISTICS CANADA
256
Clearly, the sample design has an effect on the estimates and cannot be dismissed or disregarded.
As well, the simple Pearson test statistic for independence defined in 11.5.1.1 would have a value of 34.
Since the critical value for a χ2
(2-1)(3-1) is 5.99 at the 5% level, the hypothesis of independence would be
rejected. Now, clearly, young offenders are not scattered at random among the correctional facilities. In
particular, all residents of Facility #31 are violent offenders. The effect of these clusterings can be seen
after computing the design effects for the preceding table:
Table 14: Design Effects
Age Class
≤ 15 16 or 17 ≥ 18
No 20.2 1.9 2.8 5.7
Violent Offence?
Yes 5.3 8.4 2.4 5.7
22.0 9.7 4.3
The first-order adjusted test statistic has a value of X2
RS = 16.2. The effect of the design is noticeable,
although the conclusion remains the same.
11.6 Summary
Data analysis is one of the most crucial steps of a survey, since the quality of the analysis and how well it
is communicated can substantially affect the usefulness of the whole survey. Data analysis should relate
the survey results to the questions and issues identified during the first step of the survey.
Data analysis may be restricted to the survey data alone or it may involve comparing the survey results
with results obtained from other surveys or data sources. Often, it consists of examining tables and charts
of various summary measures such as frequency distributions, means and ranges. More sophisticated
types of data analysis may also be performed – statistical inference may be applied in order to verify
hypotheses or study the relationships between characteristics.
In order to make inferences about the population, the sample design must be properly accounted for. For
simple survey data, standard formulas can be obtained from statistical textbooks. For more complex data,
a specialist should be consulted.
Bibliography
Agresti, A. 1996. An Introduction to Categorical Data Analysis. John Wiley and Sons. New York.
Aldrich, J.H. and F.D. Nelson. 1984. Linear probability, Logit and Probit Models. Quantitative
Applications in the Social Sciences Series. 07-045. Sage Publications, California.
Ardilly, P. 1994. Les Techniques de sondage. Editions Technip, Paris.
Bausch, T. and U. Bankhofer. 1992. Statistical Software Packages for PCs - A Market Survey. Statistical
Papers [formerly: Statistischen Hefte], 33: 283-306.
Binder, D.A. 1984. Analysis of Categorical Data from Surveys with Complex Designs: Some Canadian
Experiences. Survey Methodology, 10(2): 141-156.
269.
ANALYSIS OF SURVEYDATA
STATISTICS CANADA
257
Box, G.E.P., W.G. Hunter and J.S. Hunter. 1978. Statistics for Experimenters. John Wiley and Sons, New
York.
Bouroche, J.-M. and G. Saporta. 1980. L’Analyse des données. Collection Que sais-je? 1854, Presses
Universitaires de France, Paris.
Brogan, D.J. 1998. Pitfalls of Using Standard Statistical Software Packages for Sample Survey Data.
Encyclopedia of Biostatistics. John Wiley and Sons, New York.
Brackstone, G. 1999. Managing Data Quality in a Statistical Agency. Survey Methodology, 25(2):139-
149.
Carlson, B.L. 1998. Software for Statistical Analysis of Sample Survey Data. Encyclopedia of
Biostatistics. John Wiley and Sons, New York.
Chambers, R.L. and C.J. Skinner. 2003. Analysis of Survey Data. John Wiley and Sons.
Cohen, S.B. 1997. An Evaluation of Alternative PC-Based Packages for the Analysis of Complex Survey
Data. The American Statistician, 51: 285-292.
Draper, N.R. and H. Smith. 1981. Applied Regression Analysis. Second Edition. John Wiley and Sons,
New York.
Dubois, J.-L. and D. Blaizeau. 1989. Connaître les conditions de vie des ménages dans les pays en voie de
développement : Analyser les résultats. Collection Méthodologies. Ministère de la coopération et
du développement, Paris.
Dufour, J. 1996. Labour Force Survey Data Quality. Statistics Canada. HSMD-96-002E/F.
Ehrenberg, A.S.C. 1982, A Primer in Data Reduction – An Introductory Statistics Textbook. John Wiley
and Sons, Great Britain.
Everitt, B.S. 1998. The Cambridge Dictionary of Statistics. Cambridge University Press, United
Kingdom.
Fellegi, I.P. 1980. Approximate Tests of Independence and Goodness of Fit Based on Stratified
Multistage Samples. Journal of the American Statistical Association, 75: 261-268.
Fink, A. and J. Kosecoff. 1998. How to Conduct Surveys: a Step-by-Step Guide. Sage Publications,
California.
Freund, J.E. and R.E. Walpole. 1987. Mathematical Statistics. Fourth edition. Prentice Hall, New Jersey.
Friendly, M. 1995. Categorical Data Analysis with Graphics. Statistical Consulting Service Short Course,
York University, Toronto.
Hidiroglou, M.A. and J.N.K. Rao. 1987. Chi-squared Tests with Categorical Data from Complex Surveys,
I and II. Journal of Official Statistics, 3: 117-140.
Holt, D., T. M. F. Smith and P. D. Winter. 1980. Regression Analysis of Data from Complex Surveys.
Journal of the Royal Statistical Society, Series A (General), 143(4): 474-487.
270.
SURVEY METHODS ANDPRACTICES
STATISTICS CANADA
258
Johnson, S., N.L. Kotz and C.B. Read. 1982. Encyclopedia of Statistical Sciences. John Wiley and Sons,
Toronto.
Lee, E.S., R.N. Forthofer and R.J. Lorimor. 1989. Analyzing Complex Survey Data. Quantitative
Applications in the Social Sciences Series. 07-071. Sage Publications, California.
Lehtonen, R. and E.J. Pahkinen. 1995. Practical Methods for the Design and Analysis of Complex
Surveys, Statistics in Practice. John Wiley and Sons, New York.
Lepkowski, J. and J. Bowles. 1996. Sampling Error Software for Personal Computers. The Survey
Statistician, 35:10-17.
Levy, P.S. and S. Lemeshow. 1999. Sampling of Population: Methods and Applications. Third edition.
John Wiley and Sons, New York.
Lohr, S. 1999. Sampling: Design and Analysis. Duxbury Press, U.S.A.
Mendenhall, W. 1991. Introduction to Probability and Statistics. Eighth edition. PWS-Kent Press,
Boston.
Nathan, G. and D. Holt. 1980. The Effect of Survey Design on Regression Analysis. Journal of the Royal
Statistical Society, Series B (Methodological), 42(3): 377-386.
Porkess, R. 1991. The Harper Collins Dictionary of Statistics. Harper Collins, New York.
Rao, J.N.K. and A.J. Scott. 1981.The Analysis of Categorical Data from Complex Sample Surveys: Chi-
Squared Tests for Goodness of Fit and Independence in Two-Way Tables (in Applications).
Journal of the American Statistical Association, 76(374): 221-230.
Rao, J.N.K. and A.J. Scott. 1987. On Simple Adjustments to Chi-square Tests with Sample Survey Data.
Annals of Statistics, 15: 385-397.
Rao, J.N.K., S. Kumar and G. Roberts. 1989. Analysis of Sample Survey Data Involving Categorical
Response Variables: Methods and Software. Survey Methodology, 15(1): 161-186.
Särndal, C.E., B. Swensson and J. Wretman. 1992. Model Assisted Survey Sampling. Springer-Verlag,
New York.
Skinner, C.K., D. Holt and T.M.F. Smith. 1989. Analysis of Complex Surveys. John Wiley and Sons,
Chichester.
Snedecor, G. and W.G. Cochran. 1989, Statistical Methods. Eighth edition, Iowa State University Press,
Ames Iowa.
Steel, R.G.D. and J.H. Torrie. 1980. Principles and Procedures of Statistics – A Biometrical Approach.
Second edition. McGraw-Hill, U.S.A.
Thompson, S. K. 1992. Sampling, John Wiley and Sons, New York.
Tillé, Y. 2001. Théorie des sondages : Échantillonnage et estimation en populations finies. Dunod, Paris.
271.
ANALYSIS OF SURVEYDATA
STATISTICS CANADA
259
Tukey, J.W. 1977. Exploratory Data Analysis. Addison-Wesley Publishing Company, Reading, MA.
Wonnacott, T.H. and R.J. Wonnacott. 1977. Introductory Statistics. John Wiley and Sons, New York.
Wonnacott, T.H. and R.J. Wonnacott. 1991. Statistique: Économie - gestion - sciences – médecine.
Economica, Paris.
272.
E L EC T R O N I C P U B L I C A T I O N S
A V A I L A B L E A T
www.statcan.gc.ca
273.
STATISTICS CANADA
261
Chapter 12- Data Dissemination
12.0 Introduction
Most people ultimately judge the entire survey through the reports or data that are disseminated. This
chapter discusses ways to release survey results to users, with a focus on one of the main methods of
dissemination: a survey report with tables and charts.
A data quality evaluation should be performed in order to inform users of the quality of the survey so that
they can judge for themselves the usefulness of the data. It may also provide valuable input to improve
the survey (if repeated) or other surveys. This evaluation and its accompanying report should include a
description of the survey methodology along with measures and sources of sampling and nonsampling
error.
Before the data are released, they must be examined to ensure that the confidentiality of respondents is
not violated. This process, called disclosure control, may result in the suppression or modification of
some data.
The purpose of this chapter is to present different methods of dissemination, provide tips on how to
organise a written report, and explain methods of disclosure control for tabular data and public-use
microdata files.
12.1 Data Dissemination
Data dissemination is the release of the survey data to users through various media. Communicating
survey results to users consists of reducing a large set of information into concise and important details
while indicating the strengths and weaknesses of the data. When delivering the results to users, it is
important to ensure that the information is accurate, complete, accessible, understandable, usable, timely,
meets confidentiality requirements and is appropriately priced. Those responsible for dissemination
should exploit technological advances in order to enable users to process the statistical information cost-
effectively and efficiently in their own working environments.
In order to generate interest and to maintain – and be seen to maintain – a position of neutrality, release
dates for survey results should be pre-announced. If unexpected circumstances arise, there should be a
plan to explain the reasons for the delay.
Data can be disseminated through various media: a press release, a television or radio interview, a
telephone or facsimile response to a special request, a paper publication, a microfiche, electronic media
including the Internet or a public-use microdata file on a CD. (A public-use microdata file is an
anonymised file containing individual records with each respondent’s answers to the questionnaire.)
Several types of reports may be published including:
- a main survey report which includes the methods as well as the main findings and tabulations;
- a data analysis report;
- a data quality evaluation report;
- a report of the survey’s methodology;
- specialised reports on data processing procedures, data collection, methodological studies, etc.
274.
SURVEY METHODS ANDPRACTICES
STATISTICS CANADA
262
The following section focuses on how to organise a survey report.
12.2 Main Survey Report
The main survey report is one of the most important products of the survey. It is usually the first report
produced and released to users and therefore contains information on the goals and methodology of the
survey, documentation on concepts and definitions, as well as the main findings and tabulations.
Uniformity in the structure of the survey report helps users seek out and find specific information about
the survey.
The statistical agency likely has specific policies, standards and guidelines concerning the content,
organisation and appearance of these reports. Subject to these the following is a suggested structure for
the survey report and is applicable in most situations.
i. Title page
This item is required. Statistical agencies usually develop a standard layout including logos and numerical
identification for printing controls.
ii. Table of contents
This item is required. It helps the user to find the information needed.
iii. List of tables and charts
This item is required. Many users look for a visual representation of the results for their own presentation
or to compare with other sources.
iv. Highlights or executive summary
This item is optional but highly recommended. An executive summary reveals the most important
findings or highlights of the survey in no more than two or three pages. It is a quick reference for those
who may not have time to study all the details of the main report, but who need to know the essentials of
the survey findings. Sometimes, it gives a very brief description of the objectives of the survey, when and
where it was conducted and the key topics covered. It should then describe, in no more than a short
paragraph each, the most noteworthy findings, beginning with the more global results and going on to
highlight some of the more specific or unexpected findings. Sometimes, it can be just a summary of the
most important findings in point form. Highlights should be self-explanatory. Examples are: The total
area of field crops decreased 3% since 1986; Respondents have a growing concern toward telephone
interviews. Most stated they would not provide financial information over the phone.
v. Introduction
The introduction should give background information relevant to the development of the survey, such as the
history of the project, sponsors, study objectives, a short overview of the methodology and the purpose of
the report. It may also give a very brief synopsis of what was done and what was learned, but this should be
in general terms, since the detailed results will be given in the subsequent sections. It gives the general
overview of the sections to come and the links between them.
275.
DATA DISSEMINATION
STATISTICS CANADA
263
vi.Objectives
This section is optional. For surveys with multiple clients or users covering a very wide range of topics, it
is a good idea to have a section entirely dedicated to explaining the objectives of the survey. However,
these details are usually covered in the introduction.
vii. Body
The body of the report is divided into several sections. One of the first sections should provide definitions
of concepts and key variables (an appendix may contain more details) and explain the methodology of the
survey, collection procedures, processing, etc. This is usually followed by survey results (including
measures of quality, such as precision) and tabulations.
The body of the report is where all the details about the main conclusions are to be found. Each section
presenting results should start with main results and findings followed by more detailed information.
Ideas should be arranged logically in order of importance. Tables, charts, along with explanations of what
the results mean and their significance all belong in the body of the report. One of the biggest challenges
when writing a report is keeping the attention of the audience. To ensure that the important messages are
read and understood by users, they should be ordered by level of importance. Also, information should be
presented in the simplest language possible for the intended readership.
viii. Conclusions
This section presents a synopsis of the implications of the findings. Any appropriate conclusions or
recommendations about necessary action may be given here. The conclusions have to be supported by
appropriate analysis and consideration of the potential effects of sampling and non-sampling errors. While
major decisions will undoubtedly be made by policy analysts and funding ministries or donor agencies, this
section presents a unique opportunity for the persons closest to the survey to present their understanding of
the implications of what has been learned.
ix. Recommendations
This section is optional. In technical reports, recommendations can be made to solve problems met during
any activity of the survey. This is usually done for the benefit of other surveys that may encounter the
same situation.
x. Bibliography/List of references
All references should be clearly identified.
xi. Contacts
This section is mandatory. For any survey, a clear and direct contact to someone knowledgeable about the
project must be given to the users. A phone number, fax number, email address and mailing address
should all be provided. Increasingly, reference is made to a website where information may be found.
xii. Appendices
The purpose of appendices is to give a brief but clear idea of topics not described in the body of the report
or to provide essential details that would make the text too cumbersome. Appendices can contain: details
276.
SURVEY METHODS ANDPRACTICES
STATISTICS CANADA
264
about the survey objectives and the population under study, the questionnaire, more details on the survey
methodology, additional measures of data quality including the formula used to estimate the sampling
variance, a description of statistical tests, etc. Sometimes, the procedures used to collect the data in the field
are included (e.g., the data collection method, the training and supervision of field staff). Mention may be
made of the hardware or software employed and about the development of the computer systems.
12.2.1 Guidelines for Writing
The choice of an appropriate form and style for the report depends heavily on the intended audience and the
purpose of the report. Reports may be written for survey staff, other survey-takers, for subject matter and
policy analysts, for political leaders or for the general public.
One commonly used and often effective structure for each section of the body of the report consists of an
interesting question, a logical organisation of evidence used to answer the question and the answer.
Some guidelines for writing include:
i. Concise, clear language
A good report conveys a number of specific messages but is not cluttered with unnecessary detail. While
concise language is desirable, shorter is not always better and clarity should always take precedence. For
example, life insurance companies' assets and segregated longer-term, retirement-oriented investment
asset funds may be shorter, but the assets of life insurance companies and their segregated funds (longer-
term, retirement-oriented investment assets) is definitely clearer.
ii. The active versus the passive voice
Usually (and preferably) the subject responsible for the action expressed by the verb is mentioned first in
the sentence, for example: Manitoba and Alberta registered the largest provincial increases in cash
receipts during the period. This is the active voice and it gives the sentence action, conviction and a
confidence not expressed by verbs in the passive voice. Compare this with the same sentence written in
the passive voice: The largest increases in cash receipts for the period were registered provincially in
Manitoba and Alberta.
iii. Abbreviations and acronyms
Use abbreviations and acronyms sparingly and, when in doubt, spell them out. Do not assume that the
reader knows what they mean. Write terms out in full at first mention, followed by the abbreviated form
in parentheses, for example: The Consumer Price Index (CPI). The abbreviation or acronym alone may
then be used in the remainder of the text.
iv. Consistent terminology
Terminology used in various elements of the report must be consistent. For example, if the title and text
refer to assets and liabilities, the table or graph should not be labelled balance sheet. And, as explained in
Chapter 2 - Formulation of the Statement of Objectives, it is helpful if the terminology is consistent
with other surveys.
277.
DATA DISSEMINATION
STATISTICS CANADA
265
v.Residual categories
Although residual categories are often large and noteworthy, the term other is vague and ambiguous.
Where possible, define the category or identify its components rather than referring to it simply as other.
vi. Dates
Ambiguous references to dates such as last year or last month should not be used. The specific year and
month should be used in the first mention, for example: The slump of almost 26% in domestic shipments
in July 1993 looked large, but it was comparable to the 23% decline recorded in July 1992.
vii. Reference period
The reference period should be given immediately under the main descriptive title of each release and
data announcement, for example: Monthly Survey of Manufacturing, December 2002. If the data are
preliminary, this should be indicated in the reference period line to avoid repeating ‘preliminary’
throughout the text.
viii. Keep ratios simple
It is acceptable to use one-half, one-third, one quarter, and one-fifth to express results. Beyond these,
ratios are difficult to understand. Be consistent – do not mix ratios in the same sentence. Use whole
numbers when possible: use descriptions such as two out of three women compared to one out of three
men... Use simple ratios, e.g., Women were twice as likely…
ix. Percentages
Put percentages in parentheses, e.g., About two-thirds (66%) of lawyers and one-third of dentists (32%)...
Report whole percentages, e.g., say 45% instead of 45.3%, unless more detail is warranted and precise.
Avoid including too many percentages in the same sentence or over-reporting categories. For example,
instead of reporting results as ...definite yes (17%), probably yes (25%), probably no (27%), and definite
no (14%)... it may be simpler and clearer to report that respondents were divided about evenly between
yes (42%) and no (41%), if the details are provided in a table.
x. Too many numbers in the text confuse the reader and obscure the message
An example of confusing text is: The national rate for total offences per 100,000 people rose steadily
from 1979 to 1981 then recorded consecutive yearly decreases between 1982 and 1985. In 1986, however
a 4.1% increase was recorded over 1985 followed by a 2.5% rise between 1986 and 1987. In 1988, a
1.2% decrease was recorded over 1987. Over the 1979-1988 period this rate rose 9.1%.
xi. Titles, headings and subheadings
The main title may include references to base years and dates, for example: Real gross domestic product
at factor cost by industry, July 1993 (preliminary). Subsequent subheadings should be used as guides or
signposts that take the reader through the text, for example: Goods-producing industries. Subheadings
that are too numerous, too long and laden with jargon lose their impact. They should provide information
about what follows, not act simply as uninformative labels. Make each word, and each subheading, count.
278.
SURVEY METHODS ANDPRACTICES
STATISTICS CANADA
266
xii. Communication services
Many agencies can use the services of communications professionals who point out difficulties for
intended readers and make suggestions to improve the text. These people can review the report or even
help in preparing it before it is written. Editing as well as translation reviews are part of the services.
12.2.2 Tables
As explained in Chapter 2 - Formulation of the Statement of Objectives, tables are one of the major
outputs of a survey. The tables should directly address the stated objective and the specific output
requirements of the survey. Tables are used to illustrate or examine quantitative aspects of the data. They
can quickly reveal relationships among several variables and allow for the direct comparison of amounts.
During analysis and before documentation of the results, the analyst should verify the estimates and tables
produced. Are the results internally consistent? This means that marginal totals about the same variables
in different tables should be the same. Sub-population counts should add up to the total population, etc.
Are the totals in line with other sources?
The following guidelines should be followed when producing tables:
i. Tables should be simple and show only the key information, generally to make just one point at a
time. It is better to have two simple tables than one that is too complex.
ii. The overall format, spacing, and the wording, placement and appearance of titles, row and
column headings and other labelling should contribute to the clarity of the data in the tables and
prevent misinterpretation.
iii. The design should be clear, logical and consistent between tables.
iv. Titles should be clear and succinct and abbreviations should be avoided.
v. Headings should be presented to support the message of the analysis in a rational order and all
units of measurement should be clearly stated.
vi. As much as possible, tables should be designed such that, if photocopied, the copy is legible.
Also, there should be enough information in the table (title, footnotes, etc.) that it does not lose its
value when copied.
vii. Data should be rounded to help the reader understand the precision of the estimates.
viii. When the data come from a sample survey, estimates and their measures of precision should be
generated using the final sample weights (i.e., the design weights which may be adjusted for
nonresponse and auxiliary data). See Chapter 7 - Estimation for how to generate estimates using
the sample weights.
279.
DATA DISSEMINATION
STATISTICS CANADA
267
12.2.3Charts
Charts and diagrams are used to visually display data. They focus on relative patterns, shapes or distributions,
and orders of magnitude. Good charts should complement the text and tables, not merely repeat information.
They should be used to explain or support major points in the text. The text should refer to the charts and the
charts should be placed next to the reference.
The presentation of charts and diagrams is also discussed in Chapter 11 - Analysis of Survey Data. Much
the same basic set of rules applies to charts and diagrams as to tables. They should be kept simple and show
only the key information, generally to make just one point at a time. They should not require detailed
explanations. Charts should be used to convey an intuitive, visual interpretation of highlights or trends, and
therefore should be clean and uncluttered. An attempt to convey too much information in a single chart or
table may simply confuse the reader. When charts are used to illustrate points about the population, the final
sample weights must be used for data from a sample survey.
Care should be taken not to mislead the reader. While charts are very effective in conveying information,
they can be easily misused. Carelessly labelled axes, legends and titles, improper shading, distorted or
non-uniform scales, etc., are common abuses. Three-dimensional presentations should generally be
avoided but might be appropriate in some circumstances (e.g., a plot of a surface).
Use consistent intervals for line charts. For example, do not use 1, 2, 5, 8 even if there are no data points
for the other values. Instead use 1, 2, 3, 4, 5, 6, 7, 8. Also, when starting with a large number, or when
there is a gap in the values of one of the axes, use a symbol to indicate the gap.
12.3 Data Analysis Report
The main survey report includes some basic results and findings, but if more in-depth analysis is planned,
a data analysis report, or reports, should be produced. Ultimately, the analytical activities should result in
a written report that provides clear answers to the questions that initiated the survey. The data analysis
report may be structured much like the main survey report presented in section 12.2. In the data analysis
report, there should be a summary of the analytic methods, as well as a description and discussion of the
possible effects of sampling and nonsampling errors, caveats and assumptions made on the results and the
statistical significance of the results.
For details on methods of data analysis, see Chapter 11 - Analysis of Survey Data.
12.4 Data Quality Report
A data quality evaluation is an important step in any survey and should be documented in the main survey
report or in a separate data quality report. The data quality evaluation refers to the process of evaluating
the final product in light of the original objectives of the statistical activity, in terms of the data’s
accuracy or reliability. Such information allows users to make more informed interpretation and use of
the survey results. Users must be able to assess the degree to which errors in the data restrict their uses of
the data, but few users are in a position to independently assess the accuracy of the data produced by a
survey. Therefore, a statistical agency has a responsibility to perform the required data quality evaluations
and to disseminate the results of such evaluations to its users in a timely and easy-to-use fashion. Data
quality evaluations are also of benefit to the statistical agency. To the extent that errors can be traced to
280.
SURVEY METHODS ANDPRACTICES
STATISTICS CANADA
268
specific steps in the survey process, such evaluations can be used to improve the quality of subsequent
occasions of the survey and of other similar surveys.
The analyst should also consider using certification methods. Certification involves a thorough review of
data quality indicators, various univariate and multivariate analyses and numerous comparative studies,
comparing the survey results with alternate sources and historical time series. For example, all Canadian
Census data undergo a rigorous quality assessment and critical review to determine their suitability and
reliability for public release at specific levels of reporting geography. Suitability refers to the data
meeting specific quality and confidentiality standards.
Documentation on data quality should integrate information on the survey methodology with indicators of
data quality. The level of detail to be provided in the data quality documentation depends on the
following factors:
- type of survey (census, sample, administrative data, etc.) and its frequency (one time or repeated);
- type of data collected;
- type of analysis performed;
- intended uses of the data (i.e., impact on policies, social and economic planning, etc.);
- the potential for error and its significance to the use of the data;
- intended use of the quality report (e.g., for general information, for future improvements, etc.);
- intended audience of the quality report;
- the medium of dissemination (i.e., publication, public use microdata file, etc.);
- the total budget of the program and the cost of the quality evaluation relative to the overall cost.
The following elements are a non-exhaustive list of items that can be included in a data quality document.
This information should normally accompany the statistical product. If for some reason it is not possible
to include this documentation, an explicit reference to the availability of such documentation on data
quality should be made available.
i. Note(s) to users (if applicable)
This item should be included if applicable. It may consist of highlights of information provided in one or
more of the following sections, or particular explanations or warnings of which users should be aware.
ii. Data sources and methodology
This subsection should cover:
- general methodology (differences between the target population and survey population, data sources,
collection methodology, processing, estimation and validation);
- reference period;
- revisions, if applicable;
- adjustments, if applicable.
iii. Concepts and variables measured
This subsection should cover key concepts, variables and classifications used as well as key indicators.
281.
DATA DISSEMINATION
STATISTICS CANADA
269
iv.Data accuracy
There should be a statement on accuracy issues, including sample size and the types and sources of
nonsampling error (e.g., nonresponse rates, imputation rates, etc.) by geographic region and characteristic.
v. Comparability of data and related sources
If applicable, this subsection advises that data are or are not comparable over time and why (e.g., in case
of a change in question wording).
vi. Other quality indicators and assessments (if applicable)
For any analytical results, this subsection provides a summary of the analytic approach or methods, as
well as a brief description and discussion of the possible effects of accuracy issues, assumptions and
caveats on the results and their statistical significance. It also includes a description of other important
potential sources of error, or of any events (for example, a strike) which likely influenced the accuracy,
timeliness and interpretation or use of the data.
vii. Appendices (if necessary)
12.5 Confidentiality and Disclosure Control
Most statistical agencies are required by law to protect the confidentiality of respondents’ information.
Confidentiality can be assured through measures such as:
- protecting questionnaires during data collection and when in transit;
- requiring that all employees swear an oath not to disclose confidential information;
- restricting access to buildings and servers with confidential information;
- implementing disclosure control methods.
For a statistical agency, protecting respondents’ confidentiality is essential to maintaining the public’s
confidence and hence of obtaining good quality data and high response rates.
Disclosure control refers to those measures taken to protect disseminated data so that the
confidentiality of respondents is not violated. It involves, for instance, suppressing cells in a table that
may reveal confidential information about a specific respondent. Sometimes, applying disclosure control
has a negative impact on the quality of the data since some data may have to be suppressed or modified in
the process. The goal of disclosure control is to ensure that the confidentiality of the respondent is
respected while preserving the usefulness of the data to the greatest extent possible.
12.5.1 Disclosure
There are two main types of disclosure that are of concern: identity disclosure and attribute disclosure.
Identity disclosure occurs when an individual respondents (person, household, business, etc.) can be
identified from the released data and confidential information is revealed as a result. This is more of an
issue with microdata, where identifying a respondent’s record almost certainly leads to revealing
chracteristics of the respondent. Attribute disclosure occurs when it is possible from released data to
reveal confidential information about a respondent. This is more of a problem with census or
282.
SURVEY METHODS ANDPRACTICES
STATISTICS CANADA
270
administrative data, since the presence of sampling error helps to protect the results from disclosure. For
example, a census may provide a narrow (accurate) range for the income of doctors in a certain area.
There are different types of disclosure with differing degrees of seriousness. The following definitions are
not mutually exclusive:
i. Oneself to him/herself
If a respondent is able to deduce the information he or she provided, but is the only one able to do so, then
there is not a disclosure problem. However, there might be the perception of one since the respondent
may feel that others can also deduce the information, even if this is not the case. For this reason, statistical
agencies should try to avoid releasing results in a format that allows this to occur.
ii. One to another
If someone else is able to deduce the information provided by a respondent. This is the most serious
problem and the focus of disclosure control.
iii. One through him/herself
This is a problem specific to surveys with multiple respondents connected to each other. For example, a
survey about children may have a section for the parents, one for the teachers and one for the children. If
a father recognises himself in a microdata file, he may be able to determine the answers provided by his
children and their teachers.
iv. Direct
This occurs when confidential information can be deduced by simply looking at a cell. A very simple
example is a table that gives average incomes by occupation for a certain area. If there is only one person
with an occupation in an area, his or her salary is the average. Note that if there are two, each person can
use the average to deduce information about the other (a case of residual disclosure).
v. Residual
Residual disclosure occurs if other information released or otherwise available allows the accurate
estimation of suppressed information. For example, if one component of a total were suppressed, residual
disclosure would occur because the missing component could be estimated by subtracting the other
components from the total.
vi. Exact
This occurs when an individual can deduce the exact value of the confidential information. The example
given in direct disclosure above is an example of exact disclosure.
vii. Approximate
This occurs if an individual cannot deduce the exact value of the confidential information but can
determine an interval with very high probability of containing the confidential value. To be considered
disclosure, the interval must be small enough to potentially cause prejudicial actions against the
respondent. For example, if a manufacturer dominates the total production of a certain product (say, over
283.
DATA DISSEMINATION
STATISTICS CANADA
271
95%),releasing an estimate of the total production for that product gives an approximate estimate of the
production for that manufacturer.
12.5.2 Techniques to Avoid Disclosure
Two approaches used to protect the confidentiality of data are restricted access methods and restricted
data methods. Restricted access methods prevent or restrict access to the data, for example, by limiting
access to a site or server to authorised staff, using password-protected files and encryption, sharing data
under the terms of a license agreement, etc. These methods will not be covered here. Restricted data
methods are methods that protect the data themselves. Restricted data methods are classified into data
reduction methods (i.e., reducing the information released) and data perturbation methods (i.e., modifying
the data).
The techniques developed to avoid disclosure vary with the statistical product – the three most common
products being tables of frequencies (counts or weighted counts), tables of magnitude (for quantitative
data) and public-use microdata files. The techniques will be described below.
12.5.2.1 Protection of Tabular Data
The cells in a table of magnitude give numeric (usually non-negative) values such as means or totals of
dollar values, or number of employees. Such tables present a disclosure risk especially when the data
come from a business survey. This is because the skewed nature of business data may cause some cells to
be dominated by one or two large businesses, and releasing these cells’ values may yield a reasonably
good estimate of the values of these large contributors. The first step is therefore the identification of
sensitive cells (i.e., cells at risk of disclosure). Many rules have been developed to identify sensitive cells.
Here are a few examples of rules that define a cell in a table of magnitude as sensitive:
i. Cut-off rules
There must be a minimum number of respondents in a cell (e.g., at least three respondents). Under this
limit, the cell is declared sensitive.
ii. The (n,k) rule
A cell is declared to be sensitive if too much of the cell’s total is concentrated in too few respondents.
More precisely, if the largest n respondents account for at least k% of the total cell value. For example,
the (2,90) rule states that if the largest two respondents make up more than 90% or more of the cell total,
then the cell is sensitive.
iii. The p-percentage rule
A cell is sensitive if publishing it would enable someone to estimate the contribution of another
respondent to within p-percent of its value. The greatest threat is posed when the second largest
respondent in the cell attempts to estimate the contribution of the largest respondent by subtracting its
own value from the published total. Assuming that the cell comprises m respondents, disclosure is
equivalent to the condition that: 13 )100/(... xpxx m <++ . Where x1 is the value of the largest contributor,
x3 is the value of the third largest contributor, etc.
284.
SURVEY METHODS ANDPRACTICES
STATISTICS CANADA
272
The (n,k) rule and the p-percent rules are two examples of rules that are used to identify cases of
dominance by one or two large units. These are not the only choices of rules available – there are others.
At Statistics Canada, the Duffett rules are sometimes used. Duffett rules are sets of (n,k) rules, where the
parameters depend on the number of units in the cell. Whatever the rule or rules used, it is generally best
to keep the values of their parameters confidential.
The cells in a frequency table give counts or estimated counts of units sharing the characteristics of the
cell. Frequency tables can present a disclosure risk when they reveal characteristics of a respondent. As
mentioned above, the risk of attribute disclosure is greatest with census and administrative data, although
sample data may present disclosure risks when sample units’ survey membership becomes known (e.g., to
other household members). Three potential problems are full cells, zero cells and low frequency cells.
Full cells occur when all the respondents are in a single response category, such as when only one cell
inside a row or column is non-zero. Full cells can present a disclosure risk when they allow confidential
information to be obtained about a sub-population. For example, a table may reveal that all the support
staff in an institution have the education level of ‘high school diploma’. If a table of income distribution
puts them all in the ‘$20,000-29,999’ range, then information about their salary is disclosed.
Zero cells – i.e., cells with no units or where the total is zero – may also present a disclosure risk for
reasons similar to those of full cells (which they are responsible for causing). For example, the table
above may reveal that support staff are in only two education categories: ‘did not complete school’ and
‘high school diploma’. A table of income distribution for a plant that has employees in three income
categories: ‘$20,000-29,999’, ‘$30,000-39,999’ and ‘$90,000-99,999’ may provide a good estimate of the
plant engineers’ salaries (the last range).
Low frequency cells are cells with few respondents, e.g., less than 3 or 5. Low frequency cells may
present a disclosure risk when they allow the identification of their respondents and reveal some of their
characteristics. For example, a frequency table for a census in a small area that shows two single-parent
households headed by widowed men may identify those households. Any additional characteristics
revealed about the cell’s members may constitute attribute disclosure. Another problem with small cells is
that they can give the impression that disclosure has occurred even when that is not the case. For example,
revealing that there was only one new case of colon cancer detected in Prince Edward Island in 2001 does
not reveal anything about the person concerned.
There are several ways to handle sensitive cells.
1. Data Reduction methods include:
i. Cell collapsing
Cell collapsing groups categories to increase the number of entries per cell (e.g., reduce the level of
industrial detail provided). This simple method can reduce much information by suppressing details in the
data.
ii. Cell suppression
When sensitive cells are suppressed, usually non-sensitive cells must also be suppressed, so that the
sensitive cell values cannot be derived from the marginal total. These other cells are called
complementary suppression cells, and many rules exist to choose which cells to suppress. The choice of
which rules to apply in a specific case depends on the nature of the variable and the degree of protection
285.
DATA DISSEMINATION
STATISTICS CANADA
273
sought.Complementary cell suppression could be optimised by minimising the number of suppressed
cells, minimising the sum of the values of the suppressed cells, minimising the number of respondents
suppressed, or by a method providing a compromise between those needs. Other rules may be used, for
example, preference could be accorded to identifying complementary suppressions from within the same
industry grouping.
2. Data Perturbation methods include:
i. Deterministic rounding
Data in a cell are rounded according to a deterministic rule (e.g., round down to the next multiple of 10 if
the unit’s last digit is below 5, and round up otherwise). However, this can result in bias and the equality
of rounded values with rounded marginal totals may not be maintained.
ii. Random rounding
The direction of the rounding is determined randomly. This method offers more protection than
deterministic rounding using the same rounding base because it is more difficult to estimate the original
value. It is also unbiased. Again, marginal totals may not be maintained.
iii. Controlled random rounding
In controlled random rounding, pre-defined aggregate margins are preserved. Applying this method to
multi-dimensional tables is a non-trivial problem. Solutions can be found for tables of up to three
dimensions but do not exist for higher dimension tables.
iv. Adding noise
Random noise can be added to table results, to introduce more uncertainty and decrease the disclosure
risk.
v. Disclosure control methods for microdata (see following section).
Apply disclosure control methods to the microdata file, then all tabulations can be safely run from this
file.
When multiple tables are produced from the same survey, confidentiality protection cannot be performed
independently for each table since combining information from different tables may lead to disclosure.
Consequently, the techniques described above ideally need to be applied by considering the tables already
published and those yet to be released. For tables of magnitude, tabulations should be pre-defined as early
as possible since protection of ad hoc tables is particularly difficult. When combining hundreds of tables,
the number of cells may easily reach into the thousands or tens of thousands making automation
necessary.
If the survey is repeated regularly, special attention must be paid to developing a pattern of suppression to
be used for the entire series. Note though, that over time, a cell or record that once required suppression
may no longer need it (for example, a cell may grow in size making it no longer sensitive). The opposite
can also occur.
286.
SURVEY METHODS ANDPRACTICES
STATISTICS CANADA
274
12.5.2.2 Protection of Public-Use Microdata Files
Public-use microdata files, which contain individual records, are released because they allow users to
perform analyses on survey data, something that is difficult to do with tabular results. Public-use
microdata files are very sensitive and need special confidentiality consideration before dissemination to
ensure respondents’ identities remain confidential. Public-use files are usually only released for sample-
based data since the risk of identifying respondents increases with the sampling rate (note that for a
census a public use file could be released for a sample of respondents). Usually, there are direct or
personal identifiers on the survey’s master file that can uniquely identify an individual (e.g., name,
address, identification number). These must be removed. There are also indirect identifiers – variables
that can be used to identify respondents (e.g., geographic area, age, occupation, race, even income in
some cases).
Indirect identifiers on the public-use file are examined to see if they can be used to identify respondents.
Some of the verifications done are:
i. Check indirect identifiers for unique records.
For example, look for individuals with very high incomes or for exceptional household sizes.
ii. Analyse 2 and 3-dimensional tables of indirect identifiers (e.g., age, sex, education, etc.).
For example, look at tabulations of age by sex by education and look for unique combinations (e.g., a
very old person who is still employed).
Other verifications may be done, depending on the nature of the survey (e.g., population structure, sample
design, data collected or used). For example, design information and survey weights are examined to
ensure that they do not reveal sensitive information about the geographic location of sample units, if
survey data are hierarchical (e.g., household-person) then the relation between units is examined (e.g.,
looking for rare combinations of spouses’ ages), if data come from an administrative source, the
probability of successfully linking public-use file records to the administrative database is studied, etc.
Several methods are available to reduce the risks of disclosure. The methods all come at a cost in terms of
analytical usefulness of the resulting data. When implementing the methods, care must be taken to
preserve as much of the analytical value of the data as possible (e.g., variable means and correlations).
1. Data Reduction methods include:
i. Suppress direct identifiers (this should always be done).
ii. Suppress indirect identifier variables that augment the disclosure risk (e.g., country of origin,
questions on visual impairment).
iii. Suppress individual records (e.g., for a well-known public figure).
iv. Suppress individual data for a particular record (e.g., an ethnicity that is very rare in a specific
region).
287.
DATA DISSEMINATION
STATISTICS CANADA
275
v.Recode the data:
- reduce geographical detail – geographical information can substantially increase the risk of
disclosure and should be provided only at very aggregate levels;
- top and bottom code data (e.g., incomes greater than $100,000 could be top-coded to $100,000);
- categorise quantitative variables such as age or income;
- further aggregate categorical variables.
vi. Sample the microdata file
Provide data for only a sample of survey units (and adjust sampling weights accordingly). This is useful
for introducing uncertainty for units having unique characteristics in the sample. It must be done if the
original file is a census.
vii. Microaggregate records
Microaggregation consists of grouping records, say 3 at a time, and replacing the values of quantitative
variables with the average values for the groups. Categorical variables can be used to define groups of
similar units.
2. Data Perturbation methods include:
i. Round microdata or add noise
For example, apply random or deterministic rounding to the data, or add normally-distributed random
noise to the data values.
ii. Data swap
For a sample of microdata records, matching records are identified based on a predetermined set of
variables, and values for other variables are swapped between matched records. Data swapping can be
used to swap indirect identifier variables or variables that may be sensitive. For example, a small sample
of microdata records could be selected and their income values could be swapped with records that match
on geographic information, age and sex. However, this technique may affect correlation analysis.
iii. Delete information and replace it with imputed data
For example, for small populations, replace reported values with average values.
When external databases such as administrative datafiles exist that have common variables with the
survey users may attempt to link their data with the public-use datafile. In these cases the extent of
perturbation applied must be even greater.
12.5.3 Other Confidentiality Considerations
The balance between the need for information for public use and the need to protect the privacy of sample
units constitutes one of the challenges facing a statistical agency. Because a statistical agency relies on
respondents’ goodwill, their generosity and non-remunerated use of their time, an implicit contract is
made with the providers of the data. In order to respect the implicit contract, the statistical agency must
consider four factors during the planning of a survey:
288.
SURVEY METHODS ANDPRACTICES
STATISTICS CANADA
276
i. Intrusion into privacy should be limited. ‘Does society really need the information? Can the
information be found without asking the individuals? Is a smaller sample size possible?’
ii. There must be no risk of indirect harm to the respondent. In answering the questions, will the
respondents put themselves in a potentially dangerous situation? For example, in a survey about
household violence, the persecutor may overhear the interview and then harm the respondent after
the interviewer has left.
iii. Respondents should be guaranteed of confidentiality. They should know that all information will
be publicly released in a format that will prevent the disclosure of personal information
concerning them.
iv. So that respondents can provide informed consent (meaning they understand and agree to the uses
of their data), they must be informed of:
- the purpose of the survey (including the expected uses and users of the survey data);
- the authority (law) under which the data are collected;
- the collection registration details (for follow-up);
- the mandatory or voluntary nature of the survey;
- confidentiality protection;
- the plans to link the data to other files;
- the identity of the parties to any agreements to share the information.
These conditions are essential to obtaining reliable information from respondents. In order to make sure
that respondents provide informed consent, a statistical agency should rely on a uniform policy of
informing respondents of the necessity of the survey and their rights and responsibilities. The information
required by this policy must, for all surveys, be prepared in written form and made available to
respondents prior to or at the time of collection. In the case of telephone surveys without introductory
materials, the information must be provided verbally and provided in writing on request. (See Chapter 5
- Questionnaire Design for information that should be included in a questionnaire.)
Additional confidentiality considerations include:
a. Questionnaires need protection during collection, transmission, storage and retrieval of data.
b. Interviewers should not interview in public places (parks, restaurants, etc) since others could overhear
the answers. Avoid interviewing on sensitive subjects where other members can overhear.
c. Some surveys select individuals from a list and a tracing procedure takes place if the person moved.
Interviewers must be aware of the risk of disclosure during tracing (for example, a follow-up survey
targeting respondents suffering from asthma should not inform persons other than the respondent the
reason why the respondent is being followed).
d. Means of electronic transmission such as cordless phones, cellular phones and the Internet rely on
public bandwidth, and all the information travelling from them is accessible by anyone who cares to
look. As a result, confidential information should never be transmitted through either unless securely
encrypted. Respondents using these cordless or cellular phones during an interview should be told of
the risk and asked to use a phone with a physical landline if possible. Surveys conducted via the
Internet should be encrypted. Encryption is available with most web browsers and e-mail programs.
289.
DATA DISSEMINATION
STATISTICS CANADA
277
e.After the data have been compiled into machine-readable format and processing is finished,
questionnaires should be destroyed (shredded, burned, etc.), assuming that this is consistent with the
statistical agency’s policy on confidentiality.
12.6 Summary
Data dissemination and evaluation are very important steps in a survey. The goal is to communicate
information to users so that they are able to understand the survey results and make decisions. Data
evaluation should evaluate the final results in light of the survey’s original objectives. It should indicate
the survey’s strengths and weaknesses so that users can assess the degree to which errors in the data
restrict their use of it.
Methods of dissemination include written reports with tables and charts and/or a public-use microdata
file. However, before the survey results (or data) are disseminated, they must be thoroughly tested to
ensure that the confidentiality of respondents is respected.
Bibliography
Ardilly, P. 1994. Les Techniques de sondage. Editions Technip, Paris.
Boudreau, J.R. 1996. Assessment and Reduction of Disclosure Risk in Microdata Files Containing
Discrete Data. Proceedings of STC Symposium 95: from Data to Information – Methods and
Systems. Statistics Canada.
Brogan, D.J. 1998. Pitfalls of Using Standard Statistical Software Packages for Sample Survey Data.
Encyclopedia of Biostatistics. John Wiley and Sons, New York.
Brackstone, G. 1999. Managing Data Quality in a Statistical Agency. Survey Methodology, 25(2):139-
149.
Carlson, B.L., A. E. Johnson and S.B. Cohen. 1993. An Evaluation of the Use of Personal Computers for
Variance Estimation with Complex Survey Data. Journal of Official Statistics, 9(4): 795-814.
Cox, B.G., D.A. Binder, B.N. Chinnappa, A. Christianson, M.J. Colledge and P.S. Kott, eds. 1995.
Business Survey Methods. John Wiley and Sons, New York.
Doyle, P., J.I. Lane, J.M. Theeuwes and L.V. Zayatz, eds. 2001. Confidentiality, Disclosure, and Data
Access – Theory and Practical Applications for Statistical Agencies. North-Holland.
Dufour, J. 1996. Labour Force Survey Data Quality. Statistics Canada. HSMD-96-002E/F.
Ehrenberg, A.S.C. 1982. A Primer in Data Reduction – An Introductory Statistics Textbook. John Wiley
and Sons, Great Britain.
Everitt, B.S. 1998. The Cambridge Dictionary of Statistics. Cambridge University Press. United
Kingdom.
290.
SURVEY METHODS ANDPRACTICES
STATISTICS CANADA
278
Fink, A. and J. Kosecoff. 1998. How to Conduct Surveys: a Step-by-Step Guide. Sage Publications,
California.
Freund, J.E. and R.E. Walpole. 1987. Mathematical Statistics. Fourth edition. Prentice Hall, New Jersey.
Groves, R.M. 1989. Survey Errors and Survey Costs. John Wiley and Sons, New York.
Johnson, S., N.L. Kotz, and C.B. Read. 1982. Encyclopedia of Statistical Sciences. John Wiley and Sons,
Toronto.
Levy, P. S. and S. Lemeshow. 1999. Sampling of Population: Methods and Applications. Third edition.
John Wiley and Sons, New York.
Lohr, S. 1999. Sampling: Design and Analysis. Duxbury Press, U.S.A.
MacNeill, I.B. and G.J. Humphrey, eds. 1987. Applied Probability, Statistics and Sampling Theory.
Reidel, Boston.
Mendenhall, W. 1991. Introduction to Probability and Statistics. Eighth edition. PWS-Kent Press,
Boston.
Mood, A.M., F.A. Graybill and D.C. Boes. 1974. Introduction to the Theory of Statistics. Third edition,
McGraw-Hill Series in Probability and Statistics, McGraw-Hill, U.S.A.
Public Works and Government Services Canada Translation Bureau. 1997. The Canadian Style: A Guide
to Writing and Editing. Dundurn Press, Toronto.
Schackis, D. 1993. Manual for Disclosure Control. Eurostat, Luxembourg.
Steel, R.G.D. and J.H. Torrie. 1980. Principles and Procedures of Statistics – A Biometrical Approach,
Second edition. McGraw-Hill, U.S.A.
Statistics Canada. 1993. Standards and Guidelines for Reporting of Nonresponse Rates.
Statistics Canada. 2000. Policy on Informing Users of Data Quality and Methodology.
Willenborg, L. and T. de Wall. 1996. Statistical Disclosure Control in Practice. Lecture Notes in
Statistics 111. Springer-Verlag, New York.
Willenborg, L. and T. de Wall. 2001. Elements of Statistical Disclosure Control. Lecture Notes in
Statistics 155. Springer-Verlag, New York.
Wilson, J.R. and M. Reiser. 1993. Transforming Hypotheses for Test of Homogeneity in Survey Data.
Journal of Official Statistics, 9(4): 815-824.
291.
STATISTICS CANADA
279
Chapter 13- Survey Planning and Management
13.0 Introduction
The planning and management of a survey is crucial to its success. Without a clear and effective management
structure, there will not be a clear understanding of what is to be achieved and how it is to be achieved. There
are a multitude of structures that could be used to manage a survey. One commonly used structure is the
project or survey team approach. The interdisciplinary survey team is given responsibility for the planning,
design, implementation, and evaluation of the survey and of its planned products. The team is composed of
members having different technical skills required to plan and implement the survey. All members of the
survey team plan, manage and co-ordinate activities within their scope of expertise and responsibility, and co-
ordinate these activities with all other activities within the survey.
Planning and management are the keys to achieving the survey’s objectives. Planning sets out the strategy
that permits the statistical agency to meet the survey objectives. It is at the planning stage of a potential
statistical activity that the requirements of the client and the means by which and the degree to which these
requirements are expected to be met are examined and established (see Chapter 2 - Formulation of the
Statement of Objectives). It is also during planning that the resource and funding requirements, and the
schedule of activities are developed. The quality of the planning phase is crucial to the quality and cost of the
entire project. Some amount of planning continues throughout most of the survey life cycle, ending only when
the final data request has been delivered to the satisfaction of the final user.
Good planning requires good management, and knowledgeable and experienced people. Regardless of the
management structure used, a manager should be appointed who is responsible for the proper functioning of
all aspects of the survey activity. The manager should be answerable to senior management, usually to a
steering committee, which provides direction and guidance. Key management functions include organising,
directing, monitoring and controlling the survey.
The purpose of this chapter is to discuss how to plan a survey, with an emphasis on the survey team approach.
At the end of the chapter is a checklist of activities or methodologies that should be considered during
planning (see the Planning Checklist).
13.1 Approaches to Survey Planning and Management
The basic issues to be addressed when planning and managing a survey within a statistical agency are much
like those for any project in any organisation, i.e., how are requirements to be clearly identified, effectively
communicated and implemented in the shortest reasonable time, within budget and with the highest quality
that is affordable and consistent with requirements? Although the specifics are very different, the critical
common elements to meet the objectives of any project remain the same: communication, knowledge, skills,
commitment, efficiency and effectiveness.
The style and nature of planning and management of a survey depend, in part, on the resources available
within the statistical agency, its functional organisation and on how responsibilities are allocated within the
agency and within the national statistical system. The organisation must take into account the responsibilities
and the operating culture and practices of the statistical agency, provincial statistical offices, the overall
statistical organisation in the country at all levels and the relevant professional groups.
292.
SURVEY METHODS ANDPRACTICES
STATISTICS CANADA
280
A commonly used and effective framework for survey planning and management is a project team structure.
With the right people and with the commitment of senior management, a survey team can bring together
knowledge and skills, engender commitment, and simplify and improve communication-giving opportunity
for greater efficiency and effectiveness. Other frameworks or approaches are possible, and may be necessary
in some situations. However, if the project team structure is not explicitly used, greater emphasis and reliance
must be placed on precisely written specifications as a form of communication, with limited occasion for
modification. Greater reliance must also be placed on the specific abilities of participants, with less
opportunity for effective monitoring and control.
13.1.1 The Survey Team
Often, an interdisciplinary survey team is given responsibility for the planning, design, implementation, and
evaluation of the survey and of its planned products. It is composed of members having different technical
skills required to plan and implement the survey. All members of the survey team plan, manage and co-
ordinate activities within their scope of expertise and responsibility. They also co-ordinate these activities
with all other activities within the survey. Although the survey team members have individual responsibilities,
they share responsibility for meeting the objectives of the survey. All proposals, plans, budgets, options,
strategies and major instruments or specifications are reviewed by each team member and then discussed by
the team to identify the best way to proceed. For most surveys, individual team members are supported by
other staff who are assigned activities to be carried out on the team’s behalf. Conversely, every organisational
unit involved in a survey does not need to be directly represented on the survey team. For example, services
in logistics, printing, data capture or administration need not be represented on the project team.
The survey team is not a committee or a set of individuals each with a separate purpose and agenda. It is a
group of people working jointly and collaboratively on a single project. Other than the project manager, there
should be no hierarchy within the team, only roles. Communication, effective resolution of problems and
issues, and nurturing of innovation, efficiency, commitment and quality are the characteristics sought in the
team approach. There must be ongoing and open discussion, constructive comments, positive feedback,
flexibility and a willingness to consider all requirements, issues and points of view. The team also must be
thorough, thoughtful, self-directed and decisive. Proposals, issues, problems and disagreements must be
resolved unequivocally, appropriately, in a timely manner and with a clear understanding of the consequences
of decisions.
Survey teams are typically composed of a survey manager, an expert in the field of study covered by the
survey (a subject matter expert), a survey statistician, a computer systems analyst, and a data collection and
operations expert.
i. Survey manager
The survey manager is responsible for the management of the survey. He or she ensures that the objectives,
budget and schedule are respected. The survey manager is usually responsible for determining the required
resources for the survey, developing a preliminary plan and co-ordinating the preparation and updating of the
plan, preparing the budget and monitoring resource utilisation and progress. The survey manager also liaises
with, and reports progress to, senior management and the client. He or she ensures adherence to departmental
legal, legislated and regulatory commitments and to departmental policies, standards, guidelines and
regulations. The survey manager presides over team meetings and is the representative of the client on the
team, regardless of the survey manager’s functional or organisational relationship to the client.
293.
SURVEY PLANNING ANDMANAGEMENT
STATISTICS CANADA
281
ii. Subject matter co-ordinator
The subject matter co-ordinator is responsible for the content of the survey. When more than one field of
study is involved (e.g., for a survey studying demographic, education, labour force and income data), the co-
ordinator manages the activities and inputs of the subject matter participants who are not members of the
survey team. Through discussions with the client and the team, he or she is responsible for ensuring a clear
and appropriate representation of the subject matter and intended uses of the data in the statement of
objectives, design and implementation. In particular, the subject matter co-ordinator conducts or co-ordinates
the preparation of definitions and concepts, the collection and analysis of relevant historical data (for planning
and development), content development and testing of the questionnaire, preparation of all subject matter
reliant data collection and processing specifications, design of statistical outputs, development and
implementation of data analysis and preparation of the analytical text. He or she also co-ordinates the
validation or certification of survey results and provides subject matter expertise for the evaluation of data
quality and preparation of related subject matter documentation.
iii. Statistical methodology co-ordinator
An experienced survey statistician (or survey methodologist) is responsible for conducting and co-ordinating
the design and development of the statistical methodology to be used for the survey. He or she is responsible,
in particular, for the sample design, weighting and estimation, design of quality control methodologies, data
quality evaluation designs and measures, the design of edit and imputation mechanisms or strategies, and
statistical aspects of data dissemination and analysis. The survey methodologist also acts as a consultant and
adviser to all other members of the survey team on matters of statistical methodology, and ensures adherence
to the use of sound and efficient statistical methods.
iv. Computer systems co-ordinator
The systems analyst is responsible for the design and development of the computer systems and programs, as
well as the identification, integration and modification of existing or commercial software that are required to
conduct the survey. He or she ensures that these systems function according to specifications provided by
other team members and participants. The systems analyst also acts as a consultant and adviser to all other
members of the survey team on matters of computing, and ensures adherence to the use of sound, compatible,
verifiable and efficient methods throughout. He or she also co-ordinates or ensures effective implementation
of some aspects of statistical processing (e.g., edit and imputation, weighting and estimation, and tabulation),
depending on the role of an operations manager.
v. Data collection and operations manager
The data collection and operations manager is responsible for development of data collection, capture and
coding specifications and procedures. This manager is also responsible for planning and co-ordinating the
recruitment, training, monitoring and control of data collection staff such as interviewers and supervisors, as
well as data capture and coding staff, if applicable. His or her responsibilities includes the development,
implementation and management of collection operations and public relations programs, preparation of
material (e.g., manuals and maps) and logistical support requirements. He or she also acts as a consultant and
adviser to all other members of the survey team on operational matters related to his or her expertise and
ensures the specifications and requirements developed by other team members – e.g., interviewer edit and
follow-up specifications – are properly built into the procedures. This manager’s role may encompass field
collection through Regional Offices, separate data capture and coding operations, as well as implementation
of manual and some automated operational activities performed at Head Office. For larger projects these roles
may be assigned to two different persons – a data collection manager and a processing manager.
294.
SURVEY METHODS ANDPRACTICES
STATISTICS CANADA
282
vi. Other members
A larger number of managers or co-ordinators might be required for large undertakings, such as a population
census. For these projects, separate managers may be assigned for communications or publicity, geographic
inputs and outputs (associated with the frame, and geographic variables and products), and survey products.
Large surveys or censuses may also be sub-divided into particular tasks (e.g., questionnaire design and
development, data collection, edit and imputation) and sub-tasks (e.g., collection quality control, coding, etc.).
Each task and sub-task has its own team. Such teams may differ in the nature of their membership, but each
has a manager reporting to a manager in the next level up in the survey team structure.
There are two dimensions to management. The survey team provides one dimension, that of managing
resources. This is usually termed matrix management. The functional organisation provides the other –
through the delivery of contracted services or intermediate products, and through provision of team members
and technical review and supervision of their contribution to the survey.
13.1.2 Additional Planning and Management Committees
To be effective, the planning and management structure requires more than a project or survey team. For
major surveys, or for groups of surveys forming a coherent statistical program, a number of committees may
be used to provide direction and advice.
i. The statistical agency’s management committee (under various names – e.g., Policy Committee)
ensures that the survey is relevant in the overall context of the agency’s statistical program and is
effectively managed. This committee (or an equivalent level functional manager) ultimately approves
the initiation of the survey, and the budget and resource allocation for the survey.
ii. A steering committee, composed of managers with responsibility for a group of similar surveys,
provides expert or technical resources or services to surveys. The role of the steering committee is to
approve the statement of objectives, the schedule, the allocation of resources within the approved
budget, the detailed content and output and methodology. It also provides overall direction and
guidance to the survey team, monitors progress and resolves issues that cannot be resolved by the
team. Regardless of the ultimate sponsor of the survey, the steering committee is often considered to
be the client for the project team. The survey manager should be a member of this committee or
report directly to it, and attend its meetings. If the survey is funded by an external department or
agency, then it may be useful for a representative of that agency to sit on the committee.
iii. A subject matter committee provides advice and guidance on subject matter content, concepts,
definitions and classifications. Such a committee co-ordinates functions across statistical programs to
promote subject matter standards and consistency. In lieu of such a committee, the subject matter co-
ordinator should liaise with his or her technical colleagues to obtain guidance and background.
iv. In some cases, a consultative committee with regional or provincial membership, or with members
from other government departments can provide advice on broad issues, priorities, content and user
requirements, and specific outputs. This committee reflects the vested interest of the members in the
survey or its outcome. In lieu of such a committee, the project manager and the subject matter co-
ordinator must ensure effective liaison with users and groups that might have a vested interest in the
survey.
295.
SURVEY PLANNING ANDMANAGEMENT
STATISTICS CANADA
283
v. Finally, a professional advisory committee consisting of independent (outside) experts can provide
advice of a technical nature and ongoing review of the statistical methods and outputs. In lieu of such
a committee, the survey methodologist should seek advice, and take care to carry out appropriate
research and testing of methods.
Any or all of these committees may serve as part of the planning and management process. Their involvement
reflects and coalesces support for the program, and situates the priority of the survey within the agency’s
overall statistical program. This ensures the commitment of all levels of management to the survey and access
to the expert resources required. The nature of the committee structure depends on the importance of the
survey, on the structure of the national statistical system and on the management practices of the statistical
agency.
The infrastructure and functional organisation of the statistical agency affords the team a wide variety of
support. For development and design, technical supervision should be performed by the functional
organisation, i.e., the supervisors within functional areas review the contributions of their subordinates
working on teams. The team members, for their part should solicit technical advice or guidance from their
functional supervisor and from colleagues within their infrastructure. The team manager should be able to
assume that the input to his project has the approval and support of the member’s supervisor (assuming that
the functional organisation accommodates supervision based on technical or professional expertise), or
reflects some form of peer assessment and support.
In addition, the team should seek assistance or services that may be available within the organisation – data
capture and collection facilities and services, computing services, printing services, media or public
communication services, training services and facilities, interdepartmental or federal-provincial liaison
services, etc. It would be unusual for a survey team to carry out all such aspects of a survey on its own.
Although the functional manager or supervisor liaises with and reports to the appropriate survey team member
on matters related to the survey, the management of these operations is usually carried out within the
functional organisation or unit.
13.1.3 Alternative Management Approaches
The survey team approach is highly effective for development of new surveys and for major survey redesigns.
However, not all organisations are set up to operate in this manner, especially for very large statistical
projects. Several variants are described below:
i. Large survey or census
For a project such as a census of population, or in a statistical organisation with few centralised sources or
centres of technical expertise, the survey team structure may reflect only a management role rather than a
management, design and implementation role. In such situations, the survey team has to depend on several
major component project teams, task teams and sub-task teams to carry out the detailed planning, design and
implementation. A likely consequence of this structure is that the team would be composed of component
project managers, largely managing a set of operations or modules of the overall survey (e.g., data collection).
The roles of the statistical methodology, subject matter and computer systems co-ordinators might be fulfilled
only at the level of the component project or task team. There would be a loss in communication, efficiency
and quality as a result, but this loss must be assessed in terms of requirements of control and effective
management. The potential loss is much greater for a new survey. The potential loss should be less for an
ongoing survey such as a census of population if there is adequate evaluation and long inter-censal
development time.
296.
SURVEY METHODS ANDPRACTICES
STATISTICS CANADA
284
ii. Outside supplier of skills and services
If the agency does not have the technical infrastructure or facilities to conduct all aspects of the survey, it will
have to add these skills from external sources – for example, under short-term contract or by contracting out
the functions to an external organisation. For example, if the agency does not have staff or adequate facilities
for printing of questionnaires and interviewer manuals, or for data capture, it will have to seek external
services for these activities. Specifications for the functions or services to be provided, under what conditions
and expectations, will have to be prepared by the project and agreed upon by the contractor. It then becomes
the external organisation’s responsibility to implement those specifications, under the terms of the contract.
Most surveys contract out some parts of the survey to internal (outside the project team) or external service
providers.
Some new surveys are sufficiently straightforward operationally that ‘off the shelf’ methods or commercial
facilities can do the work with little need for direct involvement with the survey team (for example, in
printing). For complex functions, larger surveys and censuses, contracting out adds risk and requires specific
controls. For a national statistical agency external contractors may be other government departments,
institutions, or private enterprise organisations or individuals. The rules and regulations of the statistical
agency as well as those of the government, including those for procurement and contracting out, must be
followed. The project team must be careful to have access to the necessary internal management, legal and
administrative knowledge and experience. Diligence, properly commensurate with the significance and risk,
must be applied in selecting the contractor, preparing and agreeing on specifications and requirements, and in
monitoring and managing their implementation and fulfilment.
iii. Providing specific services to project committee
Some surveys might be planned and managed through a project or steering committee, with survey
development, design and implementation participants working separately through designated committee
members with no team role. The survey typically is only one aspect of the committee’s mandate and is not
directly part of the committee’s objective. Surveys being conducted by a government department other than a
statistical agency (but with some design support from the statistical agency) are often organised in this
manner. In such cases, the committee is within the host department. Surveys requiring specialised
measurement or direct observation skills (e.g., blood tests or other medical or dental measurements) might
also operate in this manner.
iv. Limited redesign
In many situations, the design work encompasses only one component of an ongoing survey – for example,
the redesign of the questionnaire or a sample redesign. Such cases are frequently handled without a survey
team even though many aspects of the survey may require updating or upgrading. Time and cost are usually
the reasons for doing without a survey team.
In all these cases, the various skills and the knowledge necessary to plan and conduct the survey or the
particular component is provided in a contractual manner. Most statistical agencies operate in this manner for
a variety of projects, for example, in providing consultative services to other government departments, for
conducting their own one-time surveys (for example, on client/user/employee satisfaction or on public
opinion) and for partial redesign projects.
For those components that can be specified precisely and for which an organisational unit or external
contractor has the technically specialised knowledge and resources needed to design, develop or produce the
required component on schedule, contracting out might be the most cost effective approach. However,
297.
SURVEY PLANNING ANDMANAGEMENT
STATISTICS CANADA
285
communication needs to be effective and there has to be evidence of capacity, ability, progress and
compliance to specifications.
v. Functional manager is the survey manager
There are some cases for which most of the skills needed are available within the functional unit that initiated
the survey. Where this is a meaningful distinction, the survey manager is also a functional manager of most or
all of the participants. Notwithstanding, the participant team should function in the manner of a survey team
as described above. However, many of the positive attributes of the survey team – a sense of collaboration,
openness, shared responsibility, independence and objectivity – may be unsustainable. The levels of
experience and knowledge may differ and differences in functional levels may more frequently result in
conflict. Participants from outside the functional area may have less influence, and may be given a narrow
focus of responsibility and few team roles.
13.2 Survey Planning
It is hopefully clear that various decisions have to be made throughout survey design and implementation to
ensure the survey meets its objectives. The survey is also part of a larger statistical system. So too the survey
must meet the broader objectives and requirements of the statistical organisation – considering among other
things the merits of the objectives of the survey, the overall agency program and mandate, and the opportunity
cost to produce the data or information. These objectives and requirements form five basic sets of criteria that
have to be met in the planning, design and implementation of any survey or statistical project.
i. The survey data must be ‘fit for use’.
Among statistical agencies there is no commonly accepted definition of what constitutes ‘fitness for use’.
However, whether the survey data and statistical information are fit for use can be assessed in terms of the
following six characteristics: relevance, accuracy, timeliness, accessibility, interpretability and coherence (for
a definition of these terms, see Appendix B - Quality Control and Quality Assurance).
ii. The imposed response burden or likely public reaction must be justified.
How long does the questionnaire take to complete? How much time is required for the respondent to check
records or to obtain information from other members of the household or business? How intrusive are the
questions? Will the survey collection period interfere with the work of the respondent (e.g., conducting a
survey in rural areas during planting or harvest periods)? Are basic definitions different from those of other
surveys using similar concepts? Has the population been surveyed too many times before? Will the survey
harm the reputation of the organisation or have some negative impact on other surveys (e.g., reduced response
because controversial, or because conducted at the same time)? Will the response burden and survey cost be
justified by the inherent social value of the data that will be yielded by the survey, and will this be
demonstrable to the respondents and the public?
iii. Results disseminated from of the survey should reflect all of the valid results.
Dissemination and analysis by the statistical agency must not be limited so as to, in effect, unduly reflect,
imply or support a particular perspective, agenda, conclusion or point of view. (This is a not uncommon and
unintentional result of releasing incomplete, or limited analytical results.) The survey results should not be
used to support a particular perspective, point of view or conclusion unless other plausible or contrary
outcomes or conclusions have been tested and rejected by way of clear statistical evidence and tests. Further,
298.
SURVEY METHODS ANDPRACTICES
STATISTICS CANADA
286
the statistical confidence or reliability of those tests, and results or conclusions must be clearly presented with
the results.
iv. Requirements of the policies, regulations, administrative procedures, standards and guidelines of
the agency and government must be satisfied, and sound practices and methods used.
There will be a variety of ‘rules’ for conducting a survey – from formal authorisation for the particular data
collection through to the use of statistically valid and efficient methods. Sound practices and methods are
required so as not to waste resources, to more effectively meet and to be shown to meet the criteria of ‘fit for
use’, and as a consequence, to support the professional reputation of the agency.
v. A survey meeting all of these criteria must be achievable within an agreed upon and approved budget,
and with available means and resources.
13.2.1 Stages of Survey Planning
Survey planning should be conducted in phases of increasing detail and exactitude. At the preliminary, or
survey proposal stage, only the most general notion of the feasibility and data requirements of the survey may
be known. In consultation with users and the client, the team proceeds to make the data requirements and
analytical concepts more precise and to develop some appreciation of frame options, the general sample size
and precision required, data collection options, schedule and cost. They will, at the same time have a sense of
the limitations that will be imposed by the client on cost and time, while having some knowledge of what
resources might be available for the survey. In the later stages, plans are revised, elaborated and refined, and
more detailed aspects are examined. Each and every activity and operation needs some form of plan for
design, development and implementation. Still, planning continues. Modifications and adjustment have to be
made and contingency plans and corrective procedures may be required.
A survey or statistical project goes through the following five stages of planning:
i. setting the survey proposal;
ii. establishing feasibility and the survey plan;
iii. preparing plans for the components of the survey;
iv. finalising plans during design and development;
v. adjusting and supplementing plans during implementation and evaluation.
13.2.1.1 Stage 1: The Survey Proposal
The first step in planning a survey is the identification of an information gap and the preparation of a survey
proposal. Transforming an identified need into a survey first requires approval or agreement to proceed with
preliminary planning. Most likely, members of the agency management committee or some members of the
steering committee would appoint an interim survey manager who would provide initial information on
alternatives to a survey (e.g., data available from another survey or administrative source), and on cost and
feasibility of a survey. The preliminary stage of a survey redesign or to a survey request from an external
organisation would be similar.
299.
SURVEY PLANNING ANDMANAGEMENT
STATISTICS CANADA
287
Such initial studies may have to be done quickly and, as a result, may be more superficial than desirable.
Nonetheless, the preliminary examination should be based on consultation with experts from the various
disciplines that could be expected to be involved in the eventual survey team (although these members may
not be, in the end, members of the actual survey team). Some documented process of agreement and support
from these experts should be undertaken prior to, and as part of, the decision making process on how or
whether to proceed with more substantive development towards a statement of objectives, and a full
feasibility study and survey plan.
Once a survey proposal has been prepared, reviewed and discussed, senior management is in a position to
decide whether to proceed with further planning and development. Once established, the survey team must
develop the statement of objectives and quickly confirm feasibility and some broad options or alternatives.
13.2.1.2 Stage 2: Establishing Feasibility and the Plan for the Survey
This is a critical stage of planning since the cost of the survey is established at this stage (within a narrow
range). This is particularly important if the cost limit set by the funding organisation is close to or below the
estimated cost. The main goals of this stage of planning are to:
i. establish the (draft) statement of objectives, cost limits, quality targets and rough time frame;
ii. identify and assess adequacy and accessibility of existing sources of data and identify information
gaps (administrative data and existing surveys);
iii. identify frame and potential statistical units for sampling (if applicable) and data collection;
iv. determine what methodology approaches have been used for other surveys of the same target
population and for surveys of other statistical agencies on the same general topic;
v. provide preliminary assessment of cost, time frame, feasibility and response burden, including an
assessment of the appropriateness and impact of sampling in regard to cost and quality requirements;
vi. prepare feasibility and planning report – with options, special issues, requirements and limitations
(e.g., in relation to policies and regulations, legal practices/limitations/requirements) – covering every
step of conducting the survey, including the statement of objectives, as well as options for the frame,
sample design, data collection, processing, disclosure control, testing, dissemination, budget, etc.
At any step within this stage, it is possible to report back to the Steering Committee and to terminate the
process, if the team has sufficient indication that a survey would not be viable under the terms and conditions
of the draft statement of objectives. If planning proceeds to the point where a feasibility and planning report is
prepared, the survey proposal should be reviewed and assessed by the Steering Committee. A decision on
whether or not to conduct the survey, as well as, its parameters and general design is made on the basis of the
survey proposal. Any decision to undertake further planning or design work usually leads to Stage 3.
13.2.1.3 Stage 3: Prepare Component Plans
Each team member prepares the components of the plan associated with his or her responsibility within the
team. Each also provides input to the plans of others to which they contribute expertise. Task and sub-task
teams prepare plans similarly and co-ordinate these with the survey team member responsible. All plans are
300.
SURVEY METHODS ANDPRACTICES
STATISTICS CANADA
288
reviewed and refined by the survey team. The steps in preparing these plans are:
i. prepare development, design, implementation and evaluation activity plans, schedules, estimates of
resource requirements and refined cost estimates for implementation for each component and phase
of the survey or statistical project;
ii. review all component plans, identifying inputs and outputs for each component and dependencies;
iii. conduct development required as major input to plans of other components;
iv. establish links and consistency within and between components;
v. revise schedules as required;
vi. prepare major milestones and overall schedule;
vii. prepare final testing proposal and plan;
viii. revise budgets and make adjustments to plans as required.
During this stage, planning becomes a more complex matter. In order to plan operational components (data
collection, data capture and processing), substantive development work must be included as part of the
planning for the sample design (size and allocation should be established), questionnaire content, the
collection methodology in detail, and editing and quality assurance requirements. Collection plans, for
example, are meaningless without an accurate estimate of the length of the interview.
At the end of this stage, assuming approval by the steering committee, the team arranges or finalises
arrangements for the resources required. The reference date, the data collection date, the budget and resource
requirements should now be fixed.
13.2.1.4 Stage 4: Finalise Plans for Design, Development and Implementation
At this stage the focus shifts from deciding what to do to doing it. Outstanding planning issues should only be
at very detailed levels and should be well within the bounds of existing plans (for cost, time and resources). It
is only at this stage that testing and implementation plans can be finalised. As indicated above, various aspects
of design and development start at different times, with different degrees of certainty as to what methods,
procedures and systems will be used. In some cases those receiving and having to implement specifications
may have only a general understanding of what they must transform into more detailed specifications,
procedures or computer systems. A few last minute changes in specifications during development or as a
result of testing can always be counted on. Trade-offs may have to be made to meet the agreed upon cost, time
and resource constraints.
13.2.1.5 Stage 5: Adjustments and Supplementary Plans
As design, implementation, and quality evaluation proceed, it may be discovered that not all aspects of the
survey have proceeded according to plan. Response rates may be higher or lower. Tracing may be more
costly. A greater proportion of the work of interviewers may be rejected during quality control, causing
delays. The edit failure rate for a particular variable may be excessively high. At the data quality certification
301.
SURVEY PLANNING ANDMANAGEMENT
STATISTICS CANADA
289
stage, it might be found that many respondents have misinterpreted a question, etc. These situations should be
reviewed by the survey team and plans prepared quickly.
If there is added cost, a need for additional resources, an expected delay or an impact on the survey objectives
or quality requirements, the supplementary plan should include options and consequences. The approval of
the Steering Committee must also be sought.
Even without any of these serious issues, day to day adjustments to plans may be required. As the reference
date and then the completion date of the survey get closer, small issues rapidly grow into big issues.
13.2.2 Estimating Costs, and Resource and Time Requirements
During survey planning, estimation of costs (budget), and of resource and time requirements (schedule) are
conducted in phases of increasing detail and exactitude. To start with, estimates are based on broad
assumptions of the methodology to be used, of how many and what staff and other resources are needed to
plan, design, implement and evaluate the survey, and of the requirements for logistics, materials, supplies,
transportation needs, etc. These estimates have to be more exact and more detailed at each stage of planning.
The estimates must be prepared or reviewed and supported by experts representing the specific functional
areas that are providing resources or services. Estimates should be based on historic information on resource
utilisation, duration and cost (from past surveys and other current surveys, as well as on utilisation to date for
the survey under development) and administrative information on current unit costs. This information must
then be applied to the specific application of the survey under development.
The relevant activities or methodologies among those itemised in the Planning Checklist (at the end of this
chapter) represent at least a partial list of inputs to costs and that require resources and time to complete,
prepare or deliver. Resource, time and cost estimates, however, should consider the following:
- the primary uses of the data and the quality requirements;
- the nature of the target population and the survey content;
- the length and complexity of the questionnaire and of the interview (if applicable);
- complexity of the sample design and the type of frame (e.g., area frame, list frame, random digit dialling
or telephone lists);
- sample size and sample distribution;
- data collection methodology (personal interview, telephone interview, mail out questionnaire, etc.);
- field procedures (proxy/non-proxy interview, tracing and follow-up requirements and strategy);
- the number and complexity of the built-in edits;
- expected response rate;
- experienced/inexperienced staff, as well as need for recruitment and training;
- computer hardware and software, as well as computing costs;
- what specifications, procedures and systems need to be designed, developed and tested, and which ones
can be reused or modified;
- resource requirements (equipment and personnel requirements and costs by type and level of staff);
- management and administrative reporting requirements;
- frequency and length of meetings (team and steering committee, etc.).
Costs, schedules and resource requirements must incorporate the activities of the survey manager and other
members of the team, as well as all other participants. Estimates should include all activities from inception
to delivery of the last product and report.
302.
SURVEY METHODS ANDPRACTICES
STATISTICS CANADA
290
13.3 Management of the Survey
Regardless of the management structure used, the management of a survey, beyond planning, involves
organising, directing, monitoring and controlling the survey.
i. Organise
Organising is the management function by which people, functions, and physical factors are brought together
to accomplish the goals of the organisation. The survey manager is responsible and accountable for the
management of the survey but must rely on the survey team (and on managers within functional groups
providing services) to share this responsibility. For this purpose, team members participate in and agree on the
assignment of responsibilities. Responsibilities should be allocated according to expertise and experience and
to specific sets of compatible activities or components of the survey. All activities must be covered with
respective individuals responsible for inputs or outputs from each activity of the survey. One of the roles of
the survey manager is to ensure there are no gaps and no conflicts.
ii. Direct
Directing the survey, or more specifically the work of participants, entails making decisions, giving guidance
and acquiring or providing assistance where needed. Managers must provide leadership and training and
development opportunities, motivate and maintain good communications. Conflicts must be resolved quickly
and clearly. If starting with a good plan, confidence, trust, and clear and well-understood objectives, then
motivated, well-trained staff are a manager’s guarantee of meeting the objectives of the survey.
iii. Monitor and control
Monitoring and controlling is the management function of being and staying informed and reacting to any
problems to keep the survey progressing according to plan. The survey team must ensure that the resources
assigned to the survey are available and are used efficiently and effectively. It must ensure that survey plans
are properly implemented, and that any necessary corrections and adjustments are made. The manager must
ensure that plans, policies and procedures are followed, ensure that objectives are adhered to, prepare and
issue instructions and ensure that they are followed, set performance standards, follow-up to ensure
completion of tasks and ensure adherence to schedules.
Monitoring is done through regular team meetings, discussion, day-to-day contact with participants, and
through the use of plans and a variety of management information reports. The planning report, and the
budget and schedule are key benchmarks. Resource utilisation, expenditures and progress must be tracked and
reported. Each team member should regularly submit a report (either written or verbal depending on the
situation) on progress, utilisation and expenditure. Operational data such as response rates, interviewer
completion rates, follow-up rates, and information from production reports, and quality control or quality
assurance operations should be reported and reviewed. The frequency of meetings and reporting should be
based on the potential urgency of reacting to any problems.
The schedule and cost forecasts for critical activities on a strict schedule, such as interviewing, should be
broken down to the lowest level of component steps. If possible and meaningful, these steps should be
scheduled to the level of the day, and monitored. Without this, it cannot be easily determined how long these
activities will take, whether they are in reality on schedule, and whether corrective actions, adjustments or
changes of plans are necessary.
303.
SURVEY PLANNING ANDMANAGEMENT
STATISTICS CANADA
291
iv. Communicate, co-ordinate and review
The survey team and in particular the survey manager is responsible for ensuring co-ordination and
communication. The survey team and functional managers are responsible for all review and communication
within their sphere of activity, and for providing feedback to the team and the survey manager. Plans, budgets
and schedules, statements of responsibility and mandates are primary communication and co-ordination tools.
A complete set should be available to all participants. Participants need to know their roles, but also their
purpose and where and how they fit into the overall survey. The survey team must also ensure it receives
adequate communication in order to monitor and report.
To aid in communication and co-ordination, the team schedule should include major milestones for the
survey. There should be a decision record (a list of relevant decisions made by the team). There should be a
problem notice procedure for major operations and systems (a brief report on errors, inconsistencies and
solutions that require modification to procedures, operations or systems, or to other changes not reflected in
the approved specifications or plans). The decision record and the problem notices require broad distribution.
Flow charts, or similar devices, showing the schedule and interdependencies of activities should be prepared
and provided to managers and team members.
As noted earlier, the functional manager or supervisor should review the input to the survey of his or her staff.
The survey team also has this responsibility. The team must ensure assure itself that inputs (specifications,
procedures, manuals, the questionnaire, etc.) meet survey requirements; to ensure that all the components
meet their individual objectives, fit together and are consistent with the survey objectives and plans.
13.3.1 Role of the Survey Manager
The survey manager has co-ordinating and hierarchical responsibilities not shared by the survey team as a
whole. In addition to the duties listed in the previous section, someone has to be in charge, with overall
responsibility and accountability to make timely decisions consistent with the mandate provided by the
Steering Committee. Someone must interact directly with the Steering Committee. Someone must represent
the survey team with users in general and with users providing funds, in particular. These are part of the
management role of the survey manager.
Along with other members of the team, the survey manager works with the client and users to determine their
data and analytical needs. However, it is the survey manager who must ensure that decisions made during the
course of the survey do not compromise the fundamental fitness of use of the final data. The manager
responds to the client’s questions about ongoing progress, explain the reasoning behind decisions,
communicate the client’s preferences to the survey team, and ensure that the client’s money is being spent
appropriately and within budget. The manager also acts as a buffer between the client and the survey team,
allowing the project team to carry out their work without interruption or interference. The survey manager has
the same role with the Steering Committee. If the client is not a member of the Steering Committee, then the
survey manager must ensure there is effective three-way communication of requirements, decisions and
outcomes.
It is critical that the survey manager be personally and directly assured at all times that the client and key
users know what they want, and understand what they will receive, what the limitations are, and how the data
will or will not meet their needs. The costs, consequences and appropriate alternatives must also be made
clear. A similar condition applies to the Steering Committee.
304.
SURVEY METHODS ANDPRACTICES
STATISTICS CANADA
292
The manager co-ordinates the activities of the survey team and ensures all plans, specifications, decisions, etc.
are properly communicated to members of the team. The manager reacts to any unexpected problems and
ensures that the appropriate people and information are brought together to take the necessary actions. The
manager must ensure that it is possible to monitor progress, quality and issues that arise. He or she must have
sufficient information at all times to be able to personally support the credibility of the survey and its results,
as well as to understand its limitations.
The survey manager must ensure that activities of the survey team are properly co-ordinated with
infrastructure and functional groups or service providers within and outside the statistical agency. He or she
must also be aware of any similar surveys and of new techniques and methods. The manager must ensure that
these participants are aware of the extent and timing of their involvement in the survey and that they are
informed, in a timely manner, of any changes to the plan. The survey manager must monitor their
involvement and seek clear evidence of required performance. Much of this type of activity may be delegated
to survey team members, but the survey manager should have the ability to keep an independent check on
progress, usually through monthly contact with the corresponding managers.
The manager may represent the survey and the agency to the public. The survey manager is the final point of
contact for survey respondents, and others who want to obtain more information about the survey or if there
are complaints or issues. When the survey data are released, the survey manager is a contact point (along with
the subject matter co-ordinator) for questions from the media, data analysts, and researchers.
Finally, the survey manager has primary, but not exclusive, responsibility to anticipate, prevent and resolve
problems. Survey managers must use their experience and knowledge judiciously. They must be careful to be
sceptical, realistic and supportive simultaneously. They have to decide on the basis of what is pragmatic,
which is not always the ideal in terms of staff relations and users demands. They have to avoid adjusting or
changing the wrong things, and as a result only perpetuating, cloaking or exacerbating problems. They have
to avoid tinkering, disrupting and interfering.
The survey manager must monitor the participation of team members. To prevent problems, the manager must
attempt to keep the team together throughout the survey as long as it remains of benefit to the success of the
survey. Nonetheless, the manager must not expect all participants to stay to the end of the survey. The
manager should consider an informal strategy for succession and give some thought to alternatives or options.
Adjustments have to be made for team members or participants absent due to extended illness, participants
who are promoted, change positions or who leave the organisation. Adjustments have to be made to replace
members or other participants who are making an inadequate or disruptive contribution to the survey.
13.3.2 Why Do Things Go Wrong?
Finally, the survey manager should have sufficient knowledge and experience to know why things go wrong.
A few of these that should be kept in mind are (in no particular order):
- team members do not have the same relative skill levels and experience or some lack adequate skills;
- inappropriate or disproportionate allocation of responsibilities within the team;
- poor communication or occasional serious communication gaps;
- survey run by Steering Committee chairperson and survey manager (the team is not clear on the direction,
do not consult with some team members before making decisions, react to problems or issues without
305.
SURVEY PLANNING ANDMANAGEMENT
STATISTICS CANADA
293
getting background information from the survey team);
- changing or vague objectives (client and/or users do not know what they want or do not understand
issues, adding requirements late, attempting to do too much in one survey);
- excessive complexity in methods, concepts or questions;
- inadequate testing;
- errors in planning (forcing or accepting an inflexible plan, unrealistic schedule or inadequate resources,
lack of sufficient scrutiny of plans and specifications – review only if something goes wrong, being too
optimistic about, or not knowing, how long activities take and what might go wrong, fewer resources than
planned for);
- outside interference;
- lack of understanding of cause and effect in assessing problems and in designing solutions;
- focusing on the methodology (as an end in itself) and not the objectives;
- lack of commitment or participation when required by the Steering Committee or senior management;
- lack of commitment by team members (participants have too many other assignments/commitments or are
diverted to other activities outside the survey or to additional imposed activities within the survey –
trouble shooting or dealing with information requests beyond the planned scope of the survey, team
members looking to or undertaking future assignments before completing current survey, unable to get
people to do what they do not want to do or do not believe in).
13.4 Summary
This chapter covered the main topics in planning and managing a survey, specifically:
i. Methods of organising the planning and management of surveys
Particular attention was paid to the survey team approach because of its ability to bring together knowledge
and skills, engender commitment, and simplify and improve communication – giving opportunity for greater
efficiency and effectiveness.
ii. The stages and process of planning
Survey planning must be conducted in phases of increasing detail and exactitude, progressing from setting the
survey proposal to establishing feasibility and the survey plan to preparing plans for the components of the
survey to finalising plans during design and development to adjusting and supplementing plans during
implementation and evaluation.
iii. How to manage the survey to meet its objectives
Good planning requires good management, and knowledgeable and experienced people. A manager should be
appointed who is responsible for the proper functioning of all aspects of the survey activity. Key management
306.
SURVEY METHODS ANDPRACTICES
STATISTICS CANADA
294
functions include organising, directing, monitoring and controlling the survey.
Bibliography
Amabile, T.M. 1998. How to Kill Creativity. Harvard Business Review. September-October 1998: 65-74.
Biemer, P.P, R.M. Groves, L.E. Lyberg, N.A. Mathiowetz and S. Sudman, eds. 1991. Measurement Errors in
Surveys. John Wiley and Sons, New York.
Brackstone, G.J. 1993. Data Relevance: Keeping Pace with User Needs. Journal of Official Statistics, 9: 49-
56.
Brackstone, G. 1999. Managing Data Quality in a Statistical Agency. Survey Methodology, 25(2): 139-149.
Cialdini, R., M. Couper, and R.M. Groves. 1992. Understanding the Decision to Participate in a Survey.
Public Opinion Quarterly. 56: 475-495.
Collins, J. 1999. Turning Goals into Results: The Power of Catalytic Mechanisms. Harvard Business Review.
July-August 1999: 71-82.
Cox, B.G., D.A. Binder, B.N. Chinnappa, A. Christianson, M.J. Colledge and P.S. Kott, eds. 1995. Business
Survey Methods. John Wiley and Sons, New York.
Dinsmore, P.C., ed. 1993. The American Management Association Handbook of Project Management.
AMACON, American Management Association, New York.
Drucker, P.F. 1999. Managing Oneself. Harvard Business Review. March-April 1999: 65-74.
Early, J.F. 1990. Managing Quality in National Statistics Programs. Proceedings of Statistics Canada
Symposium 1990: Measurement and Improvement of Data Quality. Statistics Canada.
Eisenhardt, K.M., J.L. Kahwajy and L.J. Bourgeois III. 1997. How Management Teams Can Have a Good
Fight. Harvard Business Review. July-August 1997: 77-85.
Fellegi, I.P. 1992. Planning and Priority Setting – the Canadian Experience. Statistics in the Democratic
Process at the End of the 20th Century; Anniversary publication for the 40th Plenary Session of the
Conference of European Statisticians. Federal Statistical Office, Federal Republic of Germany,
Wiesbaden.
Fellegi, I.P. 1996. Characteristics of an Effective Statistical System. International Statistical Review, 64(2).
Freedman, D.H. 1992. Is Management Still a Science? Harvard Business Review. November-October 1992:
26-38.
Goleman, D. 1998. What Makes a Leader? Harvard Business Review. November – December 1998: 93-102.
Groves, R.M. 1989. Survey Errors and Survey Costs. John Wiley and Sons, New York.
Kish, L. 1965. Survey Sampling. John Wiley and Sons, New York.
307.
SURVEY PLANNING ANDMANAGEMENT
STATISTICS CANADA
295
Linacre, S.J. and D.J. Trewin. 1989. Evaluation of Errors and Appropriate Resource Allocation in Economic
Collections. Proceedings of the Annual Research Conference. U.S. Bureau of the Census. 197-209.
Lyberg, L., P. Biemer, M. Collins, E. de Leeuw, C. Dippo, N. Schwarz and D. Trewin, eds. 1997. Survey
Measurement and Process Quality. John Wiley and Sons, New York.
Pinto, J.K., ed. 1998. The Project Management Institute Project Management Handbook. Jossey-Bass Inc,
San Francisco.
Project Management Institute. 2000. A Guide to the Project Management Body of Knowledge. 2000 Edition.
Project Management Institute, Newton Square, PA.
Smith, T.M.F. 1995. Problems of Resource Allocation. Proceedings: Symposium 95, From Data to
Information – Methods and Systems. Statistics Canada. 107-114.
Statistics Canada. 2000. Policy on Informing Users of Data Quality and Methodology. Policy Manual. 2.3.
Statistics Canada. 1987. Quality Guidelines. Second Edition.
Statistics Canada. 1998. Statistics Canada Quality Guidelines. Third Edition. 12-539-X1E.
Statistics Canada. 2002. Quality Assurance Framework.
Sull, D.N. 1999. Why Good Companies Go Bad? Harvard Business Review. July-August 1999: 42-52.
Wang, R.Y. and D.M. Strong. 1996. Beyond Accuracy: What Data Quality Means to Data Consumers.
Journal of Management Information Systems, 12(4): 5-34.
308.
SURVEY METHODS ANDPRACTICES
STATISTICS CANADA
296
Planning Checklist
The following are some considerations when planning the steps of the survey:
1. Formulation of the Statement of Objectives
- the information needs of the survey;
- the primary uses and users of the data;
- concepts and operational definitions;
- the survey content;
- the analysis plan (i.e., the framework and level of detail of the survey results).
See Chapter 2 - Formulation of the Statement of Objectives.
2. Selection of a Survey Frame
- define target population;
- define survey population based on available frames;
- area versus list frame versus multiple frame;
- use of existing frames;
- cost to build a new frame;
- available data to create frame;
- frame units;
- quality of the frame:
- undercoverage;
- overcoverage;
- duplicates;
- how up-to-date is the frame?
See Chapter 3 - Introduction to Survey Design.
3. Determination of the Sample Design
- census versus sample;
- for sample surveys, probability versus non-probability sampling;
- if probability sampling:
- simple random sampling;
- stratified simple random sampling;
- cluster sampling;
- multi-stage sampling;
- multi-phase sampling.
- if stratified sampling:
- stratification variables;
- method of allocating sample to strata;
- sample size;
- method of estimation;
- desired level of precision (variance) of estimates;
- repeated or once-only survey?
309.
SURVEY PLANNING ANDMANAGEMENT
STATISTICS CANADA
297
See Chapter 6 - Sample Designs, Chapter 7 - Estimation and Chapter 8 - Sample Size Determination
and Allocation.
4. Questionnaire Design
- method of collection:
- interviewer-assisted, self-enumeration or direct observation;
- if interviewer assisted:
- personal or telephone;
- if self-enumeration:
- method of delivery and pick-up of questionnaire;
- use of some administrative data for some data collection?
- use of proxy respondents?
- questionnaire content;
- question wording;
- question types:
- closed versus open answers;
- order of questions.
See Chapter 4 - Data Collection Methods and Chapter 5 - Questionnaire Design.
5. Data Collection
- how to locate and contact selected units;
- selection of interviewers;
- training of interviewers;
- supervision of interviewers;
- controlling documents (tracking number of questionnaires completed, etc.);
- field work procedures;
- control of quality of field work:
- observation of interviewers;
- re-interviews;
- field edits;
- follow-up of nonresponse.
See Chapter 9 - Data Collection Operations.
6. Data Capture and Coding
- data capture;
- coding data:
- classification schemes to be used;
- methods of measuring, controlling and correcting errors:
- quality assurance;
- quality control.
See Chapter 10 - Processing and Appendix B - Quality Control and Quality Assurance.
310.
SURVEY METHODS ANDPRACTICES
STATISTICS CANADA
298
7. Editing and Imputation
- field edits to be performed;
- edits to be performed after field collection (both manual and automated edits);
- type of edits to be performed:
- validity edits;
- consistency edits;
- consistency of edits;
- methods of imputation to be used;
- consistency of imputation;
- preparing and testing edit and imputation systems.
See Chapter 10 - Processing.
8. Estimation
- calculation of design weights;
- possible adjustments for:
- total nonresponse;
- auxiliary data;
- parameters to be estimated (point estimates):
- totals;
- ratios;
- proportions, etc.
- estimators for point estimates;
- estimators for sampling variance of point estimates.
See Chapter 7 - Estimation.
9. Data Analysis and Presentation of Survey Results
- measures of sampling error;
- measures of non-sampling error:
- coverage error;
- nonresponse (e.g., nonresponse rates);
- measurement error;
- processing error (e.g., edit failure rates);
- methods of measuring, controlling and correcting errors:
- quality assurance;
- quality control;
- evaluation of all survey operations;
- type of analyses to be performed;
- tabulation of data;
- reports to be generated;
- methods of disclosure control;
- suppression of data versus modification of data.
See Chapter 11 - Analysis of Survey Data, Chapter 12 - Data Dissemination and Appendix B - Quality
Control and Quality Assurance.
311.
SURVEY PLANNING ANDMANAGEMENT
STATISTICS CANADA
299
10. Data Dissemination
- users and uses;
- vehicle for dissemination:
- paper publication;
- public speech or presentation;
- television or radio interview;
- microfiche;
- electronic media:
- internet;
- microdata file;
- methods of disclosure control.
See Chapter 12 - Data Dissemination.
11. Documentation
- intended audience:
- management;
- technical staff;
- planners of other surveys;
- etc.;
- survey report;
- methodology reports;
- data quality evaluation reports;
- training manuals (e.g., for interviewing);
- performance reports on interviewers;
- instruction manuals (e.g., for respondents);
- schedule of activities;
- specifications for systems programs;
- feasibility report;
- progress reports;
- survey report (documenting the implementation of all steps of the survey);
- data analysis report;
- general report versus technical reports.
See Chapter 9 - Data Collection Operations for documentation of field operations and Chapter 12 - Data
Dissemination, for documentation in general.
312.
SURVEY METHODS ANDPRACTICES
STATISTICS CANADA
300
Cost Checklist
Some factors to take into account when assessing survey costs include:
- planning;
- design and development:
- survey design;
- survey procedures (e.g., data collection);
- post survey processing;
- evaluation of survey;
- documentation;
- training personnel.
Costs for survey processing would include personnel time, hardware and software purchases or rental and
other services – offices, furniture, supplies.
The design and development of a Computer Assisted Interview (CAI) application depends on the following
criteria:
- the length and complexity of the questionnaires;
- the number and complexity of the built-in edits;
- the software package used;
- the requirements to prefill information from a previous cycle;
- the functionalities required such as tracing, management reports, etc.;
- the sampling system i.e., random digit dialling or telephone lists, etc.;
- the training package to be built into the application;
- the number of revisions to the specifications;
- the time frame for the development;
- the testing requirements;
- the size of the sample (i.e., if special actions required because of large volume of data).
The following factors determine the cost of training personnel:
- type of training (classroom, home study, etc.);
- levels of training (who trains whom);
- duration (hours, days);
- location;
- number of interviewers trained;
- equipment rental (e.g., telephone, computers, PC viewer).
The cost of data collection is based on the following factors:
- sample size;
- sample distribution;
- sample frame;
- length of interview;
- data collection methodology ( personal, telephone, mail, etc.):
- e.g., number of interviewers if interviewer-assisted;
- response rate expected;
- follow-up strategy;
313.
SURVEY PLANNING ANDMANAGEMENT
STATISTICS CANADA
301
- target population ( proxy vs. non-proxy interview);
- tracing requirements;
- data collection time frame;
- manual edits and coding;
- data capture and verification requirements;
- equipment rental (telephone, computers);
- space rental;
- cost of travelling for interviewers.
314.
E L EC T R O N I C P U B L I C A T I O N S
A V A I L A B L E A T
www.statcan.gc.ca
315.
STATISTICS CANADA
303
Appendix A- Administrative Data
1.0 Introduction
Demands for statistics on many aspects of society continue to grow. Of course, one method of obtaining
statistical data is through the use of surveys. However, budget constraints and concerns about respondent
burden have led statistical agencies to examine alternative methods of obtaining statistical data. One
alternative is the use of administrative data. Administrative data are those that have been collected for
administrative purposes (e.g., to administer, regulate or tax activities of businesses or individuals) as
opposed to statistical purposes (to study groups of individuals, businesses, farms, etc.).
2.0 Using Administrative Data
The main statistical uses of administrative data are:
i. Direct tabulation or analysis
This means that the administrative data are the main source of data for some or all of the sample units.
The data are aggregated, analysed and disseminated in the same fashion as survey data. When
administrative data are used to replace a sample survey, the statistical agency must implement some, but
not all, of the survey steps discussed in this manual. For example, data collection, capture and coding
would normally be done by the administrative organisation, but the statistical agency would still need to
perform editing, imputation and data analysis. In some cases, administrative data may be the only
practical source of data (e.g., detailed information on health costs).
ii. Indirect estimation
This includes the use of administrative data as an input to the estimation system, through regression
estimation, calibration, etc. For example, using administrative data for auxiliary variables in model. For
more detail, see Chapter 7- Estimation. It also includes the combination of data from several
administrative sources to produce estimates.
iii. Survey frames
Administrative data are often used to create, supplement or update survey frames. For more information
on survey frames, see Chapter 3- Introduction to Survey Design.
iv. Survey evaluation
Administrative data can be used to evaluate survey data at a micro or aggregate level. For more details,
see Chapter 12- Data Dissemination.
There are six major sources of administrative data:
i. Records maintained to regulate the flow of goods and people across borders. These include
records of imports, exports, immigration and emigration.
316.
SURVEY METHODS ANDPRACTICES
STATISTICS CANADA
304
ii. Records resulting from legal requirements to register events such as births, deaths, marriages,
divorces, business incorporations, licensing, etc.
iii. Records needed to administer benefits or obligations such as taxation, employment insurance,
pensions, health insurance, family allowances, voter lists, etc.
iv. Records needed to administer public institutions such as schools, universities, health institutions,
courts, prisons, etc.
v. Records arising from the government regulation of industry such as transportation, banking,
broadcasting, telecommunications, etc.
vi. Records arising from the provision of utilities such as electricity, telephones, water, etc.
The usefulness of administrative data depends on their concepts, definitions and coverage (and the extent
to which these factors stay constant), the quality with which the data are reported and processed, and the
timeliness of their availability. These factors can vary widely depending on the administrative source and
the type of information. Before deciding to use administrative data, they should be thoroughly evaluated,
keeping in mind the following considerations:
i. Timeliness
Depending on the source of the information, a survey that uses only administrative data may be able to
produce results in a more timely fashion than a sample survey. Conversely, the administrative program
may be slower at producing data than a sample survey (particularly if the administrative data constitute a
census or if they have to be collected from several government jurisdictions). Processing the
administrative data after receipt may be particularly slow if many files must be combined.
ii. Cost
Many of the survey steps may be eliminated (particularly, data collection), thereby lowering costs.
iii. Response burden
If administrative data are used in lieu of administering a questionnaire then there is no response burden.
iv. Coverage
The target population is defined by administrative requirements, which may not coincide with statistical
requirements.
v. Content
Since the content is defined by administrative requirements, not all topics of interest may be covered by
the administrative data.
317.
APPENDIX A -ADMINISTRATIVE DATA
STATISTICS CANADA
305
vi. Concepts and definitions
The administrative program, designed for other objectives, may use different concepts or definitions than
the survey taker would have chosen. In fact, the concepts used by the administrative source may not be
suitable for the research problem.
vii. Sampling error
If the administrative data cover the entire target population (i.e., constitute a census), then there is no
sampling error. If the administrative data replace data for a sample of the population, sampling error is
still present.
viii. Nonsampling errors
Control of nonsampling errors is often more difficult than for a sample survey. The administrative data
may contain more errors or omissions than would survey data (making editing and imputation crucial).
Also, whenever individuals or businesses benefit or lose based on the information they provide to the
administrative source, bias may be present in the information supplied. In some cases, administrative data
may contain fewer errors than survey data, for example, when recall error may impair the ability of the
respondent to accurately answer the questions or when the respondent is likely to round their answer to a
survey question (income).
ix. Quality control
The quality of data collection, data capture and coding are under the control of the administrative program
and may be less stringent than that used by a statistical agency. Therefore, it is necessary to implement
continuous or periodic assessment of incoming data quality
x. Reliability of the administrative source
The administrative source may not be reliable in terms of consistently providing the data when needed.
Also, it is possible that the coverage, content and concepts may change over time. Therefore, one should
collaborate with the designers of the administrative system and maintain contact to remain up-to-date on
proposed changes to concepts, definitions, coverage, frequency and timeliness that may affect their
statistical use and to lobby for changes that will enhance rather than detract from their statistical use.
xi. Format of the data
The administrative data may not be in a convenient format. For example, the data may only be in
aggregate form while the statistical agency would prefer individual records for each unit. The data may
come from more than one source introducing the problem of matching and standardising data across
different formats. Also, the files may not be well documented.
xii. Privacy issues
The use of administrative data may raise concerns about the privacy of the information in the public
domain, particularly if the administrative records are linked to other sources of data. Therefore, one
should consider privacy implications and disclosure control issues, especially when linking to other files.
318.
SURVEY METHODS ANDPRACTICES
STATISTICS CANADA
306
Bibliography
Brackstone, G.J. 1987. Issues in the Use of Administrative Records for Statistical Purposes. Survey
Methodology, 13(1): 29-43.
Brackstone, G.J. 1988. Statistical Uses of Administrative Data: Issues and Challenges. Proceedings of
Symposium on Statistical Uses of Administrative Data. Statistics Canada.
Cox, L.H. and R.F. Boruch. 1988. Record Linkage, Privacy and Statistical Policy. Journal of Official
Statistics. 4: 3-16.
Hidiroglou, M.A., M. Latouche, B. Armstrong and M. Gossen. 1995. Improving Survey Information
Using Administrative Records: The Case of the Canadian Employment Surveys. Proceedings of
the Annual Research Conference. U.S. Bureau of the Census. 171-197.
Internal Revenue Service. 1999. Statistics of Income: Turning Administrative Systems into Information
Systems. Washington, D.C.
Internal Revenue Service. 2000. Statistics of Income Bulletin. 19(4). Washington, D.C.
Kilss, B. and W. Alvey, eds. 1984. Statistical Uses of Administrative Records: Recent Research and
Present Prospects. 1. Department of the Treasury. Internal Revenue Service. Statistics of Income
Division.
Kilss, B. and W. Alvey, eds. 1984. Statistical Uses of Administrative Records: Recent Research and
Present Prospects. 2. Department of the Treasury. Internal Revenue Service. Statistics of Income
Division.
Konschnik, C.A., J.S. Johnson and J.N. Burton. 1998. The Use of Administrative Records in Current
Business Surveys and Censuses. Proceedings of the Section on Survey Research Methods.
American Statistical Association. 202-207.
Michaud, S., D. Dolson, D. Adams and M. Renaud. 1995. Combining Administrative and Survey Data to
Reduce Respondent Burden in Longitudinal Surveys. Proceedings of the Section on Survey
Research Methods. American Statistical Association. 11-20.
Monty, A. and H. Finlay. 1994. Strengths and Weaknesses of Administrative Data Sources: Experiences
of the Canadian Business Register. Statistical Journal of the United Nations, ECE 11: 205-210.
Singh, M.P., J. Gambino and H.J. Mantel. 1994. Issues and Strategies for Small Area Data. Survey
Methodology, 20(1): 3-22.
Statistics Canada 1996. Policy on Informing Survey Respondents. Policy Manual. 1.1
Statistics Canada 1996. Policy on Record Linkage. Policy Manual. 4.1
Statistics Canada. 1998. Quality Guidelines. Third Edition. 12-539-XIE/F.
Sweet, E.M. 1997. Using Administrative Record Persons in the 1996 Community Census. Proceedings of
the Section on Survey Research Methods. American Statistical Association. 416-421.
319.
APPENDIX A -ADMINISTRATIVE DATA
STATISTICS CANADA
307
Wolfson, M., S. Gribble, M. Bordt, B. Murphy and G. Rowe. 1987. The Social Policy Simulation
Database: An example of Survey and Administrative Data Integration. Proceedings of the
International Symposium on the Statistical Uses of Administrative Data. Statistics Canada. 201-
229.
320.
E L EC T R O N I C P U B L I C A T I O N S
A V A I L A B L E A T
www.statcan.gc.ca
321.
STATISTICS CANADA
309
Appendix B- Quality Control and Quality Assurance
1.0 Introduction
There are a host of problems that, if not anticipated and controlled during implementation of the survey,
can introduce non-sampling errors to the point of rendering survey results useless. In order to minimise
and control errors that can be introduced at various stages of a survey, it is good practice to devote a part
of the overall survey budget to quality control and quality assurance programs.
Quality control is a technique used to ensure that quality is above an established level by measuring the
quality characteristic of interest, comparing it to a standard and taking corrective action if the standard
is not achieved.
Quality assurance includes all activities that are aimed at ensuring quality. The goal of quality
assurance is to prevent, reduce or limit the occurrence of errors in a survey – to get it right the first
time. Quality assurance follows a comprehensive approach to ensuring quality whereby all processes and
systems are well-planned, tested and monitored to ensure that they are performing as expected. Thus,
quality assurance anticipates problems while quality control responds to observed problems.
Before explaining quality control and quality assurance procedures in more detail, a definition of quality
is required. At Statistics Canada, quality is defined as ‘fitness for use’ of the data. Fitness for use
encompasses not only the statistical quality concepts of variance and bias, but also other characteristics
such as relevance and timeliness that determine how effectively statistical information can be used.
Statistics Canada defines quality or ‘fitness for use’ of statistical information in terms of six constituent
elements or dimensions: relevance, accuracy, timeliness, accessibility, interpretability and coherence
(Statistics Canada, 2002).
The relevance of statistical information reflects the degree to which it meets the real needs of clients. It is
concerned with whether the available information sheds light on the issues of most importance to users.
Assessing relevance is a subjective matter dependent upon the varying needs of users. The statistical
agency’s challenge is to weigh and balance the conflicting needs of current and potential users to produce
a program that goes as far as possible in satisfying the most important needs within given resource
constraints.
The accuracy of statistical information is the degree to which the information correctly describes the
phenomena it was designed to measure. It is usually characterized in terms of error in statistical estimates
and is traditionally decomposed into bias (systematic error) and variance (random error) components. It
may also be described in terms of the major sources of error that potentially cause inaccuracy (e.g.,
sampling, coverage, measurement, nonresponse, processing).
The timeliness of statistical information refers to the delay between the reference point (or the end of the
reference period) to which the information pertains, and the date on which the information becomes
available. It is typically involved in a trade-off against accuracy. The timeliness of information will
influence its relevance.
The accessibility of statistical information refers to the ease with which it can be obtained from the
statistical agency. This includes the ease with which the existence of information can be ascertained, as
well as the suitability of the form or medium through which the information can be accessed. The cost of
the information may also be an aspect of accessibility for some users.
322.
SURVEY METHODS ANDPRACTICES
STATISTICS CANADA
310
The interpretability of statistical information reflects the availability of the supplementary information
and metadata necessary to interpret and utilize it appropriately. This information normally covers the
underlying concepts, variables and classifications used, the methodology of data collection and
processing, and indications of the accuracy of the statistical information.
The coherence of statistical information reflects the degree to which it can be successfully brought
together with other statistical information within a broad analytic framework and over time. The use of
standard concepts, classifications and target populations promotes coherence, as does the use of common
methodology across surveys. Coherence does not necessarily imply full numerical consistency.
These elements of quality are overlapping and interrelated. It is very difficult to build an effective
statistical model bringing them all together in a single indicator. There have been but few attempts (see
Linacre and Trewin, 1993), except in simple or one-dimensional cases, at developing a general statistical
model for determining whether any particular set of the quality characteristics achieved would provide
higher overall quality than another set.
Achieving an acceptable level of quality is ultimately the result of addressing, managing and balancing
over time the various elements that constitute quality, with due attention to the program objectives, the
major uses of the data, costs, and the conditions and circumstances that affect quality and user
expectations. As the elements of quality form a complex relationship, an action taken to address or
modify one aspect of quality will tend to affect other elements of quality. Thus the balance of these
factors may be altered in ways that cannot be readily modelled or adequately quantified in advance. The
decisions and actions which achieve this balance are based on knowledge, experience, reviews, feedback
and consultation, and inevitably on judgement.
2.0 Quality Control
Quality control is used to measure actual performance, compare it to standards and act on the difference.
Thus it focuses on one element of quality: accuracy. Quality control is most commonly applied at the
processing stage of a survey to work that is typically performed by persons with various levels of training
and ability, and where the task is repetitive and manual. It therefore applies to activities such as coding,
data capture and editing.
Quality control is directed only at what can be measured and judged acceptable or not; if measurement is
not possible, then quality control cannot be performed. Sometimes, where measurement is possible,
quality control may be too expensive and time-consuming to implement (e.g., assessing whether the
answer to an open question was properly coded).
Usually, the amount and significance of error varies between activities and between individuals working
on the same activity. Quality control can be used to identify significant contributors to error and to ensure
acceptable outgoing quality levels.
Statistical quality control is the application of statistical techniques for measuring against standards and
achieving a given level of quality. Statistical quality control programs ensure that error levels, introduced
as a result of survey operations, are controlled to within specified levels, with minimum inspection.
The outputs of work activity can be viewed from two different quality perspectives. On the one hand, the
outputs represent individual products (or services) that either conform to standards or not. On the other
hand, the work may be viewed as a sequence of tasks that are performed under relatively stable conditions
to produce the required outputs (i.e., a process perspective). Both views are valid and are required
323.
APPENDIX B -QUALITY CONTROL AND QUALITY ASSURANCE
STATISTICS CANADA
311
depending on the process assumptions and the purpose of the quality control procedure. These two views
give rise to two fundamental methods of quality control: statistical product control and statistical process
control.
2.1 Statistical Product Control
Statistical product control uses sampling and decision rules to determine which batches of work are
acceptable and which are not. With product control, the focus is on the individual batch, not the process.
The purpose of quality control here is to determine which individual units or batches of units conform to
established quality requirements. Product control is corrective since batches that are identified as not
meeting the quality standard are improved (re-worked). Also, any errors found in the sample used to
measure the quality of the work are usually corrected. (Errors in ‘accepted’ samples may not always be
corrected, for example errors occurring during data collection that would require follow-up with the
respondent.) Although it is good practice to determine and correct if possible the causes of poor quality,
this is not necessary. Acceptance sampling is the main tool.
2.1.1 Acceptance Sampling
Acceptance Sampling is a quality control technique that establishes the sample design and the decision
rules to determine which batches are acceptable or unacceptable. In its simplest form, acceptance
sampling involves dividing the work into batches, selecting and checking a probability sample from each
batch and accepting or rejecting the batch depending on the extent of errors encountered in the sample.
The remainder of rejected batches is usually completely inspected and rectified as required.
Specifically:
- production is grouped into batches of units of size N;
- a sample of size n is selected from each of the batches;
- the units of work in the sample are inspected;
- the total error count, d, in the sample is compared with a predetermined limit, the acceptance number,
c;
- if d > c then the batch is rejected and the remainder of the batch is inspected; if d <= c then the batch
is accepted and no further inspection is done.
Batching of work is generally done to create batches which are as homogeneous (in terms of quality) as
possible. Batches usually contain the work of only one person, over a relatively short time period. If the
person is working on different types of cases (for example, coding two different variables at the same
time), batches should only contain one type of case. However, larger batches tend to result in less
inspection, so a compromise must be found.
The sampling plan is specified by the two numbers n and c. The method of determining these two
parameters depends on the goals of quality control. There are many different forms of acceptance
sampling. In survey processing applications, the values of n and c are selected to provide an outgoing
error rate below a certain value, called the average outgoing quality limit (AOQL), while minimising the
total amount of inspection required. This method aims to ensure that the overall quality of the work (over
all batches combined) is above a certain quality level. Thus, it ensures that once quality control is finished
the overall proportion of units still in error is below the AOQL.
The values of n and c depend on:
- the expected incoming quality (before inspection);
- the desired overall outgoing quality;
324.
SURVEY METHODS ANDPRACTICES
STATISTICS CANADA
312
- the batch size, N;
- the probability of a good batch being rejected (Type I error);
- the probability of a bad batch being accepted (Type II error).
Other considerations affecting the quality control methodology include:
- the definition of the sampling unit (e.g., part of the questionnaire, all of the questionnaire);
- batch formation (e.g., one day’s work);
- the quality measure (e.g., percent defective or defects per hundred units);
- definition and classification of errors;
- the sample selection method (e.g., simple random sample (SRS), systematic, cluster sampling);
- feedback procedures.
For more information on Acceptance Sampling and how to calculate sampling plans see, Smith and
Mudryk (1989), Duncan (1986), Dodge and Romig (1959) or Hald (1981).
Wherever a formal quality control program has been put into place, feedback is usually an integral part of
the program. Verbal or written feedback is normally provided through reports, tables or graphs of the
quality results and assessments compiled during the inspection process. These results are then fed back
regularly to various levels of staff associated with the survey operation. Feedback can help to reduce
error, which may enable a relaxation of sampling rates (reduction of n) thus reducing costs.
Some examples of feedback include:
i. Providing operators (e.g., processing clerks) with information on group performance and their
personal performance (current and historical) and the most frequent causes of their errors. They
are then able to track their own progress, compare their performance with that of their peers and
identify explicitly where they are making errors. Such feedback improves their ability, morale
and productivity.
ii. Providing supervisors with feedback on operator performance. This information includes error
rates, inspection and rejection rates and estimates of outgoing quality. This provides the
supervisors with information to effectively manage staff, allocate resources and distribute work,
identify problem operators and areas and determine training needs.
iii. Providing management with summaries of key quality indicators. This helps management track
the progress of the application in terms of quality and costs, recommend changes to operational
objectives and obtain an assurance of quality for the survey process. Over a sustained period, it
may lead to changes in methodology, changes in procedures or modified sampling plans resulting
in reduced inspection.
2.2 Statistical Process Control
A process is a planned sequence of activities directed toward a desired outcome or goal, for example,
manufacturing an automobile component. Each step in conducting a survey can be thought of as a
process, for example, selecting a sampling frame, selecting the sample, collecting the data, processing the
data, etc. There are inputs and outputs to any process. The inputs can include: people, material, methods,
equipment, environment, management. The outputs of the process are the product or service.
With statistical process control, the work outputs must be the result of a well-defined and consistent
process which is fairly predictable in terms of its outputs and which consistently produces output that
325.
APPENDIX B -QUALITY CONTROL AND QUALITY ASSURANCE
STATISTICS CANADA
313
meets or exceeds the quality standard. Such a process is said to be ‘in control’. Under this approach, the
purpose of quality control is to sample the well-behaved process at specific intervals of time to determine
if anything in the process has changed (i.e., deteriorated).
Statistical process control is the application of statistical techniques for measuring and analysing
variation in processes. Variation always exists since outputs produced by the same process vary
somewhat. Sampling (via SRS, systematic, cluster sampling, etc.) and decision rules are used to monitor
process quality and trigger action when there is evidence that the process is no longer in control (i.e., out
of control). This procedure does not react to minor fluctuations in the measurements that may be due to
sampling variability. However, when measurements deviate significantly, the reasons for the deviations
are determined and corrections to the process are made to bring it back in control.
Process control is a preventative measure since the causes of error are identified and removed thus
preventing large amounts of defective output. No effort is made to directly improve quality by correcting
errors. The focus is on identifying the causes of errors and removing them. If operationally feasible, the
process is halted when it goes out of control until the causes of the increase in errors are found and
removed.
While it is usually possible to identify the root cause of most problems, sometimes this may be difficult.
Several tools are available to help accomplish this including control charts, Pareto analysis, cause and
effect diagrams, brainstorming, etc. For more on Pareto analysis and cause and effect diagrams, see Juran
and Godfrey (1998).
As with product control, feedback on process control should be provided to operators, their supervisors
and management.
2.2.1 Control Charts
The control chart is the main tool for statistical process control. A control chart plots consecutive sample
measurements collected periodically from a process and examines whether they are within the limits set
by the process variation. The limits set are called control limits. The upper and lower limits may be
assigned based on an expert’s knowledge of the process or, more commonly, they are set to three standard
deviations from the centre line, where the centre line represents the average value and is referred to as the
process average. This is equivalent to calculating the boundaries of a confidence interval (see Chapter 8 -
Sample Size Determination and Allocation). The control lines are values outside of which the process
is considered to be out of control. The vertical axis represents the quality measure (such as the percent
defective) and the horizontal axis shows the value of each sample observation in time sequence.
In general, if all sample observations fall within the control limits, the process is considered to be in
control. If one or more observations fall outside the control limits, an investigation should be conducted.
Even if no observation falls outside the control limits, but certain trends are observed, such as several
samples in a row falling above the centre line, or a steadily increasing error rate, an investigation should
be performed.
Different control charts are available depending on the quality measure used and whether the sample size
is fixed or variable. The most common attribute control chart is the p chart, illustrated below.
326.
SURVEY METHODS ANDPRACTICES
STATISTICS CANADA
314
Note that the graph above does not include the lower control limit; typically, in survey operations where
the measure of interest is the error rate, the lower control limit is not of interest since there is no cause for
concern if the error rate drops.
For details on other control charts as well as, on how to calculate their centreline and control limits see,
Duncan (1986), Schilling (1982) or Wheeler (1986).
2.3 Statistical Product Control versus Statistical Process Control
In Statistical product control (usually acceptance sampling), the focus is on the output of the process – the
product. The goal in survey applications is to find and correct enough errors in the product to ensure that
the quality meets the standard. Quality control plans may be set up to minimise the probability of a batch
of poor quality getting through (i.e., minimise the probability of a type II error), or they may be set up to
ensure that the overall quality, over all batches, is acceptable. With Statistical process control, the focus is
not on finding and correcting errors, but to assume that the quality is already acceptable – no correction of
errors is needed – and to simply take samples of the work and measure the quality periodically to make
sure that this assumption is still correct. If the data indicate that the assumption is false, then rather than
correct errors to ensure quality, the cause of the problem in the process is determined and corrected.
Statistical process control is used less frequently in survey operations since it requires an operation that
has been demonstrated to be consistently and reliably producing the required quality. In survey operations
involving manual processing, this is rarely the case. As operators become more reliable, they tend to get
promoted or switch to another project. Furthermore, if a clerk suddenly starts producing work with a
significantly higher error rate, it may be difficult to bring the error rate back down quickly, as the cause
may be due to fatigue, boredom, attitude, etc.
However, statistical process control is always preferable to acceptance sampling because it costs less;
statistical process control samples tend to be much smaller than the amount of sampling required to do
Process Control Chart
0,00
0,01
0,02
0,03
0,04
0,05
0,06
0,07
0,08
1 2 3 4 5 6 7 8 9 10
Sample
Percentdefective
UCL
CL
327.
APPENDIX B -QUALITY CONTROL AND QUALITY ASSURANCE
STATISTICS CANADA
315
acceptance sampling.
One area where statistical process control has proven useful is in automated data capture operations
(Intelligent Character Recognition). Statistical process control was used for the capture of the 2001
Canadian Census of Agriculture. Since the work was done by a machine, once it could produce the
required quality, it could be trusted to continue to do so. If the error rate suddenly went up, simple
adjustments or replacement of a work part usually corrected the problem. Another place where statistical
process control is used is in monitoring of CATI operations. In this case, calls are sampled and errors
tabulated (e.g., questions not asked properly, a rude operator, etc.). Because such errors cannot be
corrected, a statistical process control is taken.
2.4 Acceptance Control
An important question that needs to be addressed in survey operations is when to apply which method of
statistical quality control, specifically acceptance sampling or statistical process control. As explained
above, many survey processes start out being highly unpredictable since they involve a large staff with
high turnover. However, with training, experience and ongoing feedback, these processes often become
more stable over time. Therefore it is often good practice to take advantage of this stabilisation and
modify the inspection procedures so that the rates of inspection and associated costs can be reduced.
Various inspection strategies are available to address the changing stability of an operation, including:
reduced inspection (i.e., taking smaller samples with a greater risk of accepting poor quality), tightened
inspection (i.e., taking larger samples with a lower risk of accepting poor quality), normal inspection,
100% inspection, statistical process control and spot checks. It may also require relaxing the quality target
if it is too costly or time-consuming to achieve.
The method that should be used depends on the amount of process stability that is evident in the process
and the quality of the process. Generally speaking, the more stable and predictable that a process is and
the higher its quality, the less inspection that is required (i.e., more sampling risk can be justified).
Schilling (1982) postulated the acceptance control approach which involves a continuing strategy of
selection, application and modification of acceptance sampling procedures to a changing inspection
environment. The inspection procedures are periodically modified as a function of the quality level that is
achieved and the quality history that is available. The overriding principle in acceptance control is to
continually adapt the acceptance procedures to existing conditions (which generally change over time).
The framework of when to switch inspection procedures is shown in the following table. This table is
discussed in greater detail in Chapter 19 of Schilling (1982).
It can be seen in Table 1 that the inspection process under acceptance control becomes dynamic and
changes as the process improves or degrades. In general, as the quality improves and the quality history to
support this becomes extensive, sampling plans are modified from normal plans to reduced plans to skip-
lot plans (acceptance sampling where some batches are skipped – not inspected – if the quality in
previously inspected batches is high enough), to statistical process control plans to periodic spot checks.
The ultimate aim of the acceptance control strategy is to reduce inspection and its associated costs
continually, while at the same time maintaining the specified quality levels.
328.
SURVEY METHODS ANDPRACTICES
STATISTICS CANADA
316
Table 1: Acceptance Control - Inspection Procedure by Quality History and Past Results
Past Results
Relative Quality History
Little Moderate Extensive
< 10 Lots 10 to 50 Lots > 50 Lots
Excellent Normal Plan Reduced / Skip-Lot Statistical Process Control /
Spot Checks
Average Normal Plan Normal Plan Reduced / Skip-Lot
Poor 100% 100% / Tightened 100% / Tightened
3.0 Quality Assurance
Since errors can be expensive and difficult to resolve, emphasis should be placed on error prevention in
the early stages of the survey. Quality assurance encompasses all elements of quality; its goal is to prevent
problems from occurring in the first place.
For example, a general quality assurance strategy for the control of non-sampling errors is to anticipate
problems before they happen and take steps to prevent or minimise them, ideally at the planning and
design phases of the survey. The survey must also be designed and implemented to ensure, for example,
that the data are relevant to users and produced in a timely manner and that users are made aware the data
are available in a medium they can access.
Examples of quality assurance include:
- intensive planning;
- conducting a feasibility study;
- conducting a pilot survey (i.e., testing entire survey system from start to finish on a small scale);
- training for interviewers, supervisors, data capture operators, coders, etc.;
- debriefing exercises;
- improving the sampling frame;
- improving the sample design;
- improving the questionnaire design;
- modifying the data collection methodology (e.g., moving from paper-based to computer-assisted
collection);
- better follow-up routines;
- clearer processing procedures;
- thoroughly testing all processing systems before they are used;
- spot-checking data collection and outputs of other major survey activities.
Statistics Canada’s Quality Guidelines (1998) recommends the following quality assurance activities
during the design and implementation phase of a survey:
i. Use of a project management and steering committee regime to ensure that statistical programs
are carried out according to their mandate. This provides a mechanism to review, monitor and
report on progress, problems and issues; and to ensure the proper interpretation of the mandate
and objective and that appropriate judgements are being made.
329.
APPENDIX B -QUALITY CONTROL AND QUALITY ASSURANCE
STATISTICS CANADA
317
ii. Use of an interdisciplinary project team/project management approach for the design and
implementation to ensure that quality considerations receive appropriate attention.
iii. Whenever specific methods are applied, they should be within the realm of commonly accepted
and defensible statistical practices under the given circumstances. The use of new technologies
and innovations to improve quality and efficiency should be encouraged, but well tested to
minimise risk. Questionnaires should be tested to ensure that respondents understand the
questions and can provide the desired responses with an acceptable level of quality. It is
important to monitor quality, react effectively to unanticipated problems and verify or support the
credibility of the results, as well as understand their limitations.
iv. At the design or redesign phase and as part of ongoing reviews, there should be technical
assessments of methods proposed or in place, as well as evaluations of operational effectiveness
and cost performance. These will serve as a test of the suitability of the technical proposals or
practices. They will also serve to improve and guide implementation of specific components of
methodology and operations, within and across programs.
v. Besides being used to inform and to describe statistical phenomena and to recognize data gaps,
data analysis should also be a means to assess or to measure the accuracy and coherence of the
data. In this context, the results of analysis may lead to, for example, additional or modified
editing procedures, questionnaire design changes, supplementary data collection procedures,
additional staff training, the adoption of new methods, procedures or systems, or to a redesign.
With respect to the working environment, it is important to foster an environment that encourages a
concern for quality and the production of the best quality possible within operational and budgetary
constraints. This includes:
- the recruitment of talented staff and their development to appreciate quality issues;
- an open and effective network of internal communications;
- explicit measures to develop partnerships and understanding with the agency’s suppliers (especially
respondents);
- the development and maintenance of standard definitions, classifications, frameworks and
methodological tools to support interpretability and coherence.
Finally, all quality control and quality assurance procedures should be documented. This documentation
should include:
i. Options, eventual choice and justification: The particular choice of quality control and quality
assurance procedures for any operation is not obvious and the factors that were taken into
consideration should be discussed.
ii. Procedures: A set of instructions and/or a manual for supervisors and those performing the
verification should be produced.
iii. Reports: Periodic reports on the results of the quality control procedures and the performance of
individual operators should be produced so that the quality can be reported or individual operators
identified for retraining.
330.
SURVEY METHODS ANDPRACTICES
STATISTICS CANADA
318
Bibliography
Brackstone, G. 1999. Managing Data Quality in a Statistical Agency. Survey Methodology. 25(2): 139-
149.
Dodge, H.F. and H.G. Romig. 1959. Sampling Inspection Tables: Single and Double Sampling. Second
edition. John Wiley and Sons, New York.
Dufour, J. 1996. Labour Force Survey Data Quality. Statistics Canada. HSMD-96-002E/F.
Duncan, A.J. 1986. Quality Control and Industrial Statistics. Fifth edition. R.D. Irwin Inc., Illinois
Fellegi, I.P. 1996. Characteristics of an Effective Statistical System. International Statistical Review.
64(2).
Groves, R.M. 1989. Survey Errors and Survey Costs. John Wiley and Sons, New York.
Hald, A. 1981. Statistical Theory of Sampling Inspection by Attributes. Academic Press, New York.
Juran, J.M. and A.B. Godfrey. 1998. Juran’s Quality Handbook. Fifth Edition. McGraw-Hill, New York.
Linacre, S.J. and D.J. Trewin. 1989. Evaluation of Errors and Appropriate Resource Allocation in
Economic Collections. Proceedings of the Annual Research Conference. U.S. Bureau of the
Census. 197-209.
Linacre, S.J. and D.J. Trewin. 1993. Total Survey Design – An Application to a Collection of the
Construction Industry. Journal of Official Statistics. 9(3): 611-621.
Lyberg, L. 1997. Survey Measurement and Process Quality. John Wiley and Sons, New York.
Mudryk, W. 2000. Course Reference Manual for Statistical Methods for Quality Control – Course 0446.
Statistics Canada.
Mudryk, W., M.J. Burgess and P. Xiao. 1996. Quality Control of CATI Operations in Statistics Canada.
Proceedings of the Section on Survey Research Methods. American Statistical Association. 150-
159.
Schilling, E.G., 1982. Acceptance Sampling in Quality Control. Marcel Dekker, New York.
Smith, J., W. Mudryk and R. Stankewich. 1989. Standardization of QC Sampling Plans for Survey
Operations, Part 1: Guidelines and Rationale, Quality Control Section, Business Survey
Methods Division, Statistics Canada.
Statistics Canada. 1998. Statistics Canada Quality Guidelines. Third Edition. 12-539-X1E.
Statistics Canada. 2002. Statistics Canada’s Quality Assurance Framework – 2002. 12-586.
Wheeler, D.J. and D.S. Chambers. 1986. Understanding Statistical Process Control. SPC Press,
Knoxville, TN.
331.
APPENDIX B -QUALITY CONTROL AND QUALITY ASSURANCE
STATISTICS CANADA
319
Williams, K, C. Denyes, M. March and W. Mudryk. 1996. Quality Measurement in Survey Processing.
Proceedings of Symposium 96: Nonsampling Errors. Statistics Canada. 119-128.
332.
E L EC T R O N I C P U B L I C A T I O N S
A V A I L A B L E A T
www.statcan.gc.ca
E L EC T R O N I C P U B L I C A T I O N S
A V A I L A B L E A T
www.statcan.gc.ca
335.
CASE STUDY
STATISTICS CANADA
Preface
TheCase Study is a fictitious survey designed to illustrate the steps in the development of a general
household survey, according to the methods and principles presented in the corresponding chapter of the
Survey Methods and Practices. In this way, a common example is used for the entire manual. The Case
Study survey development process is described from the point of view of the project team.
336.
SURVEY METHODS ANDPRACTICES
STATISTICS CANADA
Table of Contents
1. Introduction to Surveys……………………………………………………………………….……….... 325
2. Formulation of the Statement of Objectives………………………..……………………….….……..… 328
3. Introduction to Survey Design.…………………………...………………………………………….…. 338
4. Data Collection Methods...……………………………….....………………………………..………... 341
5. Questionnaire Design...…...………………………………………………………………………….… 343
6. Sample Designs….…...…………………………………...…………………….…...…………………. 350
7. Estimation………………...………………………………....…………………………………….…… 353
8. Sample Size Determination and Allocation………………………………………………………….… 358
9. Data Collection Operations..……………………………...………………………………………….… 364
10. Processing…………….....………………………………....……………………………………….… 369
11. Analysis of Survey Data ...………………………………………………………………………….… 373
12. Data Dissemination……...………………………………………………………………………….… 377
13. Survey Planning and Management……………………...……………………………………….…… 380
337.
CASE STUDY
STATISTICS CANADA
325
Chapter1 - Introduction to Surveys
1.0 Introduction
In recent years, the country of Belleterre has been undergoing rapid economic change as the country goes
through the process of economic reform. The Belleterre Bureau of Statistics (BBS) is fully aware of the
increasingly urgent need for up-to-date information on the state of the economy and the socio-economic
situation of its population, and has begun efforts aimed at modernising several aspects of its statistical
program.
In particular, the BBS recognises the need to obtain relevant, objective and accurate information on the
situation of households in both the urban and the rural areas. To this end, it has been seeking resources to
conduct an ongoing household survey, to be tentatively known as the General Household Survey (GHS).
The national government has indicated its support for the survey, and is currently determining the
resources to be dedicated to this effort.
Preliminary studies of information demands from various user departments indicate that the GHS should
be conducted at least once a year, and should be representative of the population both nationally and at
the level of important urban centres and sub-national economic regions. Broad topics to be covered by the
survey would include:
- socio-demographic characteristics;
- labour market activity;
- income and expenditure patterns;
- indicators of living conditions.
A number of important national ministries would also like to obtain information from the GHS. The
Ministry of Health would like detailed information on the population’s health status, while the Ministry of
Agriculture has requested data on household agricultural activities in both rural and urban areas. Several
economic ministries would like information on small businesses. All these additional activities are being
considered, but no firm decision has yet been made on which, if any, will be included in the GHS.
In the context of these broad objectives, a project team is to be formed to design and implement the new
survey. You have been selected as a member of the project team and will soon begin to participate in the
survey’s development. The team’s first meeting will be held soon, so you start by spending some time
reviewing the available information on Belleterre from the last census and from other household surveys.
You soon realise that most of that information is not only out-of-date but also insufficient since the
existing data do not reflect the new economic realities. See Annex 1.1 for an overview of Belleterre.
Review questions:
Why has a survey been proposed?
What are the basic issues to be addressed by the survey?
338.
SURVEY METHODS ANDPRACTICES
STATISTICS CANADA
326
Annex 1.1: Statistical Profile of Belleterre
The following notes summarise the available information on the demographic and economic situation of
Belleterre. Data are taken from censuses held in 1980 and 2000. The notes include some preliminary
estimates and projections based on the 2000 census.
The population of Belleterre is estimated to be about 44 million persons in 2005, up from about 30
million in 1980 and just under 41 million at the time of the 2000 census. The rate of population growth
continues to be moderate, and the population is expected to reach 55 million by 2025. This population
growth, combined with a high level of rural-to-urban migration, has accelerated the recent changes in the
nation’s economic structure.
Over the past two decades, Belleterre has seen increasing urbanisation, with substantial migration from the
countryside to urban centres, especially to the three largest cities. As a result, only about 40% of the
population now live in urban areas.
The capital city, City A, is found in the central-valley region. Its rapidly growing population is expected to
approach four million by 2005. The other two major urban centres are City B, in the south of the country, and
City C, in the north, each growing at a similar pace and smaller than City A. These three cities, which
accounted for just under one twelfth of Belleterre’s population in 1980, now contain almost one fifth of a
larger total, and continue to attract a steady flow of migrants from the surrounding countryside.
The nation’s economy is still largely agrarian and natural resource based, the principal agricultural products
being rice and coffee. Mining, particularly of coal and copper, contributes foreign exchange to the economy.
There is a rapidly growing manufacturing base, especially in textiles and electronic components, much of
which is also exported overseas. Overall, per capita income is estimated to have grown by an average of 6.4%
annually since 1990.
The following tables give a brief summary of important demographic and economic indicators.
Table 1.1: Population of Belleterre
Year Population (at mid-year) Source
1980 30,110,000 Census
2000 40,850,000 Census
2005 43,840,000 BBS estimate
2010 47,200,000 BBS demographic projection
2015 50,000,000 BBS demographic projection
2020 52,800,000 BBS demographic projection
2025 55,300,000 BBS demographic projection
339.
CASE STUDY
STATISTICS CANADA
327
Table1.2: Belleterre: Population (in thousands of persons), by Region
SourceRegion
1980 Census 2000 Census 2005 BBS estimate
City A 1,760 3,250 4,080
City B 925 1,675 2,060
City C 2,145 3,189 3,625
District D 1,885 2,467 2,600
District E 3,400 4,450 4,690
District F 3,670 4,800 5,045
District G 3,085 3,975 4,160
District H 2,300 2,965 3,080
District I 3,200 4,120 4,320
District J 4,260 5,480 5,640
District K 3,480 4,470 4,540
Total 30,110 40,850 43,840
Table 1.3: Belleterre: Gross Domestic Product per capita
Year GDP per capita (1990 prices) Source
1990 5150 Intercensal estimate (BBS)
2000 6175 Adjusted Census data
2005 9600 Preliminary estimate
340.
SURVEY METHODS ANDPRACTICES
STATISTICS CANADA
328
Chapter 2 - Formulation of the Statement of
Objectives
2.0 Formulating the Statement of Objectives
The project team responsible for developing the new General Household Survey (GHS) has been
officially named, and holds its first meeting to begin its work. The team will report to a Steering
Committee composed of senior professionals and management representatives, and must quickly prepare
a detailed work plan for presentation to that Steering Committee.
Knowing that the GHS is to cover a wide range of topics, and must provide timely information several
times per year, and recognising that the country has many millions of people, the team immediately sees
that it will not be feasible, or necessary, to attempt a census. A sample survey will be sufficient and likely
preferable to a census (see Case Study Chapter 3), although what type of sample, and how large, is not yet
clear.
The team decides that the first few meetings will have to be devoted to preparing a Statement of
Objectives for approval by the Steering Committee before detailed development of the survey can be
begun.
2.1 Determining the Information Needs
At its second meeting, the project team begins working on the Statement of Objectives. Considering the
long list of information requests known to exist, the overall purpose of the GHS might be loosely stated as
‘to study the social and economic conditions of the population.’ This statement is much too vague to be
put directly into practice, and certainly you cannot expect to obtain useful information by simply asking
people about their ‘social and economic conditions.’
The team therefore faces two challenges. The first is to convert the vague general statement of needs into
specific topics for study, while the second is to identify which of those topics can and should be covered
by the survey.
The four broad themes of socio-demographic information, labour market activity, income and expenditure
patterns, and living conditions have already been identified as being of high priority. Various ministries
have also requested data on health, agricultural production and small business activity.
The team must consider whether it is possible, or necessary, to incorporate such a variety of topics into a
single survey and is expected to make recommendations to the Steering Committee on the feasibility,
benefits and risks of including each major subject area.
To determine the specific information needs, the team must attempt to identify and consult the principal
data users, and to inform themselves about the relevant subject matter concepts and definitions.
341.
CASE STUDY
STATISTICS CANADA
329
2.2Users and Uses of the Data
With some guidance from the Steering Committee, a list of key data users is drawn up. Some of them are
within the BBS, working in specialised subject-matter areas such as the national accounts, demographic
analysis and manufacturing statistics divisions. Many others are policy analysts in the central program
ministries, concerned with such areas as employment and industrial policy, housing construction policy,
transportation development and the education sector.
For each of the proposed survey themes, a team member is assigned to consult with as many as possible
of the key data users in that area and prepare a summary of those discussions for the next meeting. After
the preliminary discussions with the data users, the project team meets to study the reports on each
consultation. In fact, so much has been learned that three more meetings are needed.
The team member assigned to look into socio-demographic characteristics reports first, saying that the
main users are subject-matter specialists primarily interested in basic demographic events in the family
such as births, deaths, marriages, family composition and migration (e.g., region-to-region or urban-to-
rural migration, emigration, immigration). After some discussion, it is agreed that the team member will
seek out more detailed information on each of these subjects, particularly regarding the availability of
suitable information from existing sources such as vital registers.
The second team member informs the team that the main topics relevant to labour market activity include
labour force status (employed, unemployed, not in labour force), working as an employee or on one’s
own account, whether work is full-time or part-time, industry, occupation, hours worked, etc. Several
users, particularly planners in the ministries of employment, education and construction, insist that none
of the existing surveys adequately meets the need for labour market information in the context of the
rapid and ongoing changes in the nation’s economic structure. Thus, for example, they require accurate
and objective estimates of how many people are working in particular activities, such as building
construction, in each region or city of the country. Similarly, the analysts need to know how many
workers are working at more than one job, and their actual hours of work and earnings. Again, the
responsible team member is assigned to take the next step of finding out more detailed information on
data needs, as well as investigating possible existing data, such as those provided by any existing surveys.
Your own report concerns household income and expenditures. You have learned that household income
can be defined to include all income (gross or net) in cash or in kind received by all household members
during a reference period, such as the previous month or year. Expenditures may include monies paid for
food, clothing, shelter, transportation, education, health care and so forth, as well as goods or services
exchanged directly (bartered) for other goods and services received. The household’s assets and debts
may also be considered relevant for the survey’s analytic purposes.
You have also found that there are many potential users of data on these subjects. The BBS would like
more detailed data on income and expenditures to strengthen certain components of the national accounts.
In particular, the existing accounts are less complete in the area of private-sector income, both labour
income and business income. Those concerned with measuring retail trade, purchasing power and
expected residential construction are interested in the evolution of family incomes and changes in
spending patterns, to strengthen their reports to the economic policy-makers. It was also found that
estimates of disposable income are of great interest to the manufacturing industry as well as to the tourism
authorities. Much work still must be done to arrive at the appropriate level of detail, and you agree to
undertake the second round of investigation in this area. Once again, you will have a closer look at the
availability of relevant existing data.
342.
SURVEY METHODS ANDPRACTICES
STATISTICS CANADA
330
Finally, the fourth team member reports that the most important indicators of living conditions appear to
refer to housing conditions, transportation access and use, and access to educational services, all of which
are very important for national and city infrastructure planners. Once again, a second round of research is
initiated into this subject.
Meanwhile, the project manager has held some preliminary discussions on the possible additional themes,
and also makes a brief report:
i. The household’s use of health care services during the past year could range from the purchase of
pharmaceutical products, to visits to local doctors or clinics, or to in-patient care such as surgery
in hospitals. These topics are of particular interest to the Ministry of Health, which wants to
measure the rate of change in demand for the different types of health care services.
ii. Interest in household agricultural activity may be defined in terms of production of crops or
livestock on land owned or rented by the household or on communal land, whether that
production is for market sale or for own consumption. The analysts from the Ministry of
Agriculture want updated information on the types and quantities of agricultural production being
sent into the urban markets, to help in their planning and policy making.
iii. Home business activity (other than the sale of agricultural products) could include small-scale
manufacturing, informal restaurants, hairdressing and a large number of other activities ranging
from baking to shoe making. Economic planning analysts are interested in obtaining this
information to understand the structure of the economy and track the rate of movement toward
small, private-sector business.
The ministries interested in additional themes have been given a rough estimate of the cost of including
their subjects in a large multi-purpose survey, and the latest news available suggests that they are
reluctant to provide the necessary resources, at least for this year. In addition, the team is worried about
tackling such a large number of topics in the first round of the GHS because of the large response burden
and the possible negative effects on the quality of the data. After sharing what they have learned with the
Steering Committee, the team is advised to concentrate its efforts on defining the Statement of Objectives
in terms of the four core themes, leaving the possible additions until subsequent survey occasions.
Therefore, for each of the four core topic areas (socio-demographic characteristics, labour market activity,
income and expenditure and living conditions), the team will continue to refine the Statement of
Objectives while also considering the usefulness of existing data sources.
In light of the lengthy discussions at the recent team meetings, you continue your research into your
assigned topic area – household income and expenditures. Several users and a variety of uses of the data
have already been identified. In addition, central ministries need more up-to-date information on family
income and particularly on food expenditures, to enable them to determine whether state subsidies are
required to protect low-income families. Other users would like to have data to build econometric models
to estimate increases in demand for consumer goods, as well as non-basic foodstuffs and improved
housing. These estimates would provide information to the manufacturing and construction industries,
allowing them to plan new projects and make decisions on hiring additional workers.
However, before you have advanced very far in this second level of definition, the team is called to an
unexpected meeting with the Steering Committee. The team is informed that the expected budget for the
first round (first year) of the GHS has been sharply cut (by over 50%). The team is instructed to
concentrate on the most important of the core themes, while still preparing a survey infrastructure that can
be readily expanded in the second year when, it is hoped, the required resources will be made available.
343.
CASE STUDY
STATISTICS CANADA
331
TheSteering Committee and the project team consider what has been learned to date, and come to the
following conclusions:
i. While not perfect, almost all the demographic measures required can be produced satisfactorily
from existing data such as vital statistics and housing registers, either directly or using indirect
methods, for one more year at least.
ii. Several ministries insist that none of the existing sources provide adequate labour market
information in the context of the changing economic circumstances.
iii. Several members of the Steering Committee argue that the income and expenditure information
from present surveys can continue to be used for the medium term, especially if it can be
strengthened by better information on the evolution of the labour market from the GHS.
iv. With respect to the desired information on living conditions, the main immediate need is for
better labour market data to improve projections of housing, transportation and education
requirements.
Given all this, it becomes clear that the initial design of the GHS will have to concentrate on the labour
market component, and leave aside the remainder of the initial broader list of subjects for this year.
2.3 Concepts and Operational Definitions
Now that the scope of the GHS has been much more narrowly defined, the team’s next task is to specify
clear subject-matter concepts and working definitions for the survey topics, and then to proceed to the
determination of detailed survey content. The workload is again distributed among the team members.
The team begins tackling some of the concepts crucial to describing the labour market activity of
Belleterre – labour force, employed, unemployed. The team members think about the concepts, but come
up with more questions than answers. For example:
i. Labour Force
Who should be included? Does the concept of labour force apply equally in the urban and in the rural
areas? What is to be done about those workers who work or reside in one region but whose permanent
home is in another region? For practical purposes, should such a person be considered part of the labour
force for his/her place of permanent residence, or in the region where he/she is currently working? How
should persons be classified if they are able to work, are not yet retired, but are not working or seeking
work?
ii. Employed
Does the definition of employment include only working for monetary pay, or should provision of labour
in exchange for goods and services be included? How are full-time and part-time work to be defined? Can
a person have one full-time job and another part-time job, and if so, does the definition depend on the
number of hours worked, or some other criterion? Are there suitable definitions of employer, employee
and self-employment? Again, should the definitions of employment differ according to whether the
person lives in a rural or urban area? If a person is working in a place other than his/her place of
344.
SURVEY METHODS ANDPRACTICES
STATISTICS CANADA
332
permanent residence, should he/she be counted as employed there, and should he/she be counted as
employed, not employed or simply not present in the place of permanent residence?
iii. Unemployed
Is a person considered to be unemployed if he/she is simply not working? What if he/she does not want to
work? What if he/she has looked for work for so long that he/she has become discouraged and given up
on ever finding a job?
The team is having considerable difficulty in answering the questions that have arisen. Some members
research definitions used in other countries and discover the following standard definitions used by the
International Labour Organisation (ILO):
i. Labour Force: A person will be considered to be part of the Labour Force if he/she is employed
or unemployed (see below).
ii. Employed: Employed persons are those who, during the reference period:
a. did any work at all at a job or business, that is, paid work in the context of an employer-
employee relationship, or self-employment. It also includes unpaid family work, which is
defined as unpaid work contributing directly to the operation of a farm, business or
professional practice owned and operated by a related member of the same household;
or
b. had a job but were not at work due to factors such as own illness or disability, personal or
family responsibilities, vacation, labour dispute or other reasons (excluding persons on layoff,
between casual jobs, and those with a job to start at a future date).
iii. Unemployed: Unemployed persons are those who, during the reference period:
a. were on temporary layoff with an expectation of recall and were available for work;
or
b. were without work, had actively looked for work in the past four weeks, and were available
for work;
or
c. had a new job to start within four weeks from the reference period, and were available for
work.
iv. Not in the Labour Force: Persons not in the labour force are those who, during the reference
period, were unwilling or unable to offer or supply labour services under conditions existing in
their labour markets, that is, were neither employed not unemployed.
The team decides to design the questionnaire so that the resulting data can be used to estimate measures
conforming to the ILO concepts. This will allow comparability to international measures on labour
market activity. The team notes that the ILO definitions restrict analysis to persons 15 years of age and
over. The team decides to use this standard throughout.
345.
CASE STUDY
STATISTICS CANADA
333
Theteam also notes the difficulty in defining certain key concepts such as dwelling, household and
family. After some research, the team decides to adopt the following standard definitions:
v. Dwelling: any set of living quarters that is structurally separate and has a private entrance outside
the building or from a common hall or stairway inside the building.
vi. Household: any person or group of persons living in a dwelling. A household may consist of any
combination of: one person living alone, one or more families, a group of people who are not
related but who share the same dwelling.
vii. Family: a group of two or more persons who live in the same dwelling and who are related by
blood, marriage (including common-law) or adoption. A person living alone or who is related to
no one else in the dwelling where he or she lives is classified as an unattached individual.
The team notes that a survey strictly on labour force activity will not allow analysts to paint a very
detailed picture of the labour force in Belleterre. The team realises that, in addition to information on
labour market activity, additional data on demographics, education, income, etc. will have to be collected
for classification purposes.
2.4 Survey Content and Analysis Plan
To help clarify the survey content, the team begins to draft some preliminary output tables, at each step
asking what analytic questions they may help to answer. For example, it seems clear that the GHS will
have to be able to produce tables such as ‘Labour Force Status by Education level’ and ‘Employment by
Age and Sex’. So, information must obviously be collected on employment as well as the demographic
characteristics of the household.
You set up a dummy table for the first heading:
Table 2.1: Labour Force Status by Education
Labour Force StatusEducation
Level Employed Unemployed Labour Force Not in Labour Force
Below average
Above average
Total
This is clearly inadequate. As far as ‘below average’ and ‘above average’ education go, does this refer to
the average education level to be calculated from the survey data, or to some exogenous concept of
‘average level of education’. And what values go into the cells of the table? Will they be counts
(estimated numbers of persons), proportions, percentages?
Keeping in mind that greater detail in the questions (therefore on the datafile) can always be grouped for
tabulation, you consider the other extreme:
346.
SURVEY METHODS ANDPRACTICES
STATISTICS CANADA
334
Table 2.2: Labour Force Status, by Years of Education (Number of Persons)
Labour Force StatusYears of
Education Employed Unemployed Labour Force Not in Labour Force Total
1
2
3
…
99
Total
This level of detail would be difficult to collect and interpret sensibly. You decide that education levels
should be grouped in a meaningful way for tabulation, even if the exact number of years of schooling is
asked to permit detailed analysis of the education variable. For the above table, perhaps education could
be grouped as primary school, junior high school, senior high school, technical college, and university
(the question could refer to highest level completed or attended).
It has been suggested that reliable estimates are required for each of the eleven regions of Belleterre (3
cities and 8 districts). For the moment you leave aside the possible need for finer detail, and contemplate
tabulations that will show the eleven specified regions separately.
Table 2.3: Labour Force Status by Region for Belleterre’s Adult Population (Weighted)
Labour Force StatusRegion
Employed Unemployed Labour Force Not in Labour Force Total
City A
City B
City C
District D
District E
District F
District G
District H
District I
District J
District K
Total
You are unsure of the most effective way to present this table, but that decision can be postponed, as it
will not affect the questions to be asked.
You work out several similar tables, in each case trying to decide on an appropriate level of detail. Finally
you are ready for the next team meeting, at which the suggestions of each member are discussed and
compared. The team has nearly 20 tables, for example:
- labour force status by age and sex;
- labour force status by education;
- employment by industry;
- labour force status by region;
- average usual hours of work of employees by selected characteristics;
- average wages of employees by selected characteristics.
347.
CASE STUDY
STATISTICS CANADA
335
Bythis time, the detailed list of topics is taking shape, and the team begins writing up the Statement of
Objectives, covering the project team’s interpretation of the survey’s information needs, identifying the
main known users, giving provisional definitions of key concepts, and proposing a number of tables for
preliminary descriptive analysis. At this point, the team does not feel in a position to comment on
precision, as neither the sample design, indeed not even the survey’s frequency, have been decided.
The team sends Annex 2.1 to the Steering Committee members for discussion at the next meeting. (It is
agreed to present it with the explanation that it is still a draft.) This will allow the Steering Committee
members time to prepare detailed comments, while at the same time the project team will continue to
work on the details of the proposed survey content.
Review questions:
Provide definitions for the target population and the survey population.
Explain in your own words why the GHS will cover a much more restricted content than initially thought.
Attempt to make a more explicit statement of the data needs and uses for the Demography Division and
the Ministry of Economic Planning.
Propose five tables to be included.
What definitions of labour force, employed and unemployed would you propose to the Steering
Committee? Would these alter the proposed topics?
348.
SURVEY METHODS ANDPRACTICES
STATISTICS CANADA
336
Annex 2.1: Draft Statement of Objectives for the Belleterre General Household Survey
Introduction
At the request and under the direction of the GHS Steering Committee, the GHS Project Team has
prepared the following Draft Statement of Objectives for the initial round of the General Household
Survey (GHS), to be conducted next year.
The survey will cover labour market activities (employment and other income-producing activities, job
search, hours of work, wages, etc.), as well as some socio-demographic characteristics. By way of
background, it should be mentioned that the original goal was to develop a survey with a much broader
thematic coverage, including numerous indicators related to demography, household income and
expenditure, business activities, and possibly supplements on health and agriculture. Such a survey
remains the BBS’ medium-term goal. However, the initial project will be less ambitious and more
narrowly focussed.
Preliminary research has shown that the demographic and income-expenditure subject areas can be
covered adequately from existing sources (vital registers, and the urban and rural household surveys,
respectively) for at least one more year. Information on high-priority areas within the other topics of
importance can at least be strengthened through the data to be collected in this version of the GHS. This is
the reason that the stated objectives refer principally to labour market activities.
Principal Data Users
The main users of the GHS data have been identified as the Labour Analysis Division of the BBS and
economic planners in the ministries of employment, education and household-sector construction. Other
users will include the Demography Division of the BBS, the Ministry of Economic Planning, and the
National Labour Commission. Selected communications with those users concerning their data needs are
attached as Annex A (not shown here).
Key Concepts and Definitions
To ensure consistency with other statistical products of the BBS, standardised definitions of concepts
such as dwelling, household and family will be used.
In order to facilitate international comparison, the project team recommends adopting the widely used
International Labour Organisation (ILO) definitions of labour force, employed, unemployed and not in
labour force.
Proposed Survey Content
The following topics will be included in the survey:
Dwelling/Household
Tenure (owned or rented)
Household composition
Age
Sex
Education completed (level and years of schooling)
349.
CASE STUDY
STATISTICS CANADA
337
LabourForce Activity
Labour force status (employed, unemployed, not in labour force)
Industry (primary, manufacturing, sales, services, etc.),
Occupation (director, supervisor, professional, labourer, etc.)
Hours worked
Employment income
Other economic activity
Self-employment
Formal sector
Informal sector (i.e., ‘underground economy’).
Preliminary Analysis Plan
The initial analysis will consist of tables of estimated numbers and percentages for each of the major
items listed above, along with a number of cross-tabulations. Approximately twenty proposed key
tabulations are included in Annex B (not shown here).
Further details of analysis have yet to be worked out, but will likely include production of tables for more
detailed regional and industry breakdowns.
350.
SURVEY METHODS ANDPRACTICES
STATISTICS CANADA
338
Chapter 3 - Introduction to Survey Design
3.0 Introduction
Having received approval from the Steering Committee of its draft Statement of Objectives, the project
team now meets to begin the substantive work of designing the GHS.
The first question, whether to do a census or a sample survey, has already been resolved. A census would
be unthinkably costly, even if it were conducted only once a year. Also, even if the money were available,
the operation would be so huge and unwieldy that it would inevitably suffer from so many logistical and
management problems that the nonsampling errors (such as processing errors) would overwhelm the
gains from avoiding sampling error (that would be incurred from a properly designed sample survey).
Only a sample survey can collect annual or sub-annual information from a population of nearly 44 million
people. In fact, you have been informed that the survey should be designed to be conducted four times a
year, that is, in such a way that useful estimates are obtained once for each calendar quarter. Therefore,
the team will prepare a sample design that is manageable under such time constraints, and with a large
enough sample to give reliable results for each quarter.
3.1 Target and Survey Population
At first glance, the target population seems easily defined and they tentatively define it to be the adult
population of Belleterre. However, the project team identifies several problems:
i. Temporary residents
Should persons who have moved into the country temporarily be included in the labour force? They are
not part of the economy in the official sense, but they do occupy jobs and produce products. Conversely,
persons who have moved to another country are occupying jobs and producing products in that country.
They may be impossible to reach and it is not clear that they should be counted as part of Belleterre’s
economic activity although many may send part of their income home.
Where should persons who have moved from the rural to the urban part of the country be counted? (Such
people usually live in temporary dwellings.) They have a large and increasing impact on the social and
economic dynamics of the urban areas of the country with respect to unplanned increases or decreases in
availability of labour in one urban area versus another (and, it might be added, an impact on rural areas in
terms of the decrease in the available agricultural workforce).
The team decides to include as household members all people who usually live in the dwelling, in other
words, anyone who regards the dwelling as his/her usual place of residence. The team realises that this
concept will have to be defined much more clearly to be implemented, but at least this is a starting point.
ii. Collective dwellings
Should the survey cover only residents of individual dwellings or should it also cover collective dwellings
(that is, dwellings that contain multiple households)? Collective dwellings can encompass everything
from small rooming or boarding houses to hospitals and prisons. Obviously, these are very different
situations. In large institutional collectives, such as hospitals, prisons, military bases, etc., even if it were
351.
CASE STUDY
STATISTICS CANADA
339
decidedthat the residents should be covered by the survey, would it be feasible to conduct interviews with
the residents? On the other hand, small collectives closely resemble private dwellings and the team
wonders if they could be treated like private dwellings for the sake of data collection.
iii. Remote areas
Finally, the team considers those persons living in certain remote and inaccessible areas that would be
unreasonably costly to survey. (However, this group is very small in Belleterre, less than 1% of the
population.)
The team will tentatively define the target population to be the adult population whose usual place of
residence is in Belleterre. People living in remote areas will be excluded, as will residents of collective
institutions such as hospitals, prisons, military bases, etc. The team realises that the final definition of the
target population will depend on the sampling frame that is used, which will influence the reference
period, what portions of the population should be excluded for practical reasons (e.g., too remote, too
costly, too difficult to survey), etc.
3.2 Sampling Frame
Household surveys in Belleterre have traditionally been done using population and household registry
lists as frames. Given the degree of administrative documentation of the population’s movements, these
lists have generally been considered quite complete and up-to-date. However, the recent increases in
emigration and migration within and between regions mean that this may no longer be true.
Since available registry lists are largely maintained by local town and city public offices, it is not clear
that they do not overlap to some degree, or that all the lists are updated with the same frequency or
accuracy. To remove overlap between these frames, it would be necessary to join all these lists into a
single big frame. Then, of course, there would be the problem of keeping that frame up-to-date, which
would require continuous updating information from several hundred different offices on at least a
quarterly basis. On the other hand, the team notes that it would be very costly to construct new lists for
the entire country.
Considering these factors, the team recognises that it must study other possible sources of information for
building the GHS frame.
Some countries without good population registers use area-based sampling frames for their household
surveys. The team undertakes some research into the documentation available from other countries to
judge whether this approach would be likely to allow them to cover a more fully representative
population.
The team members know that, in theory, an area frame can offer almost complete coverage, but that it can
also be costly to prepare. Also, given that they would need to start from the beginning, they are not sure
that they can develop a good area frame and related sample design in time for the first round of the
survey. However, during their discussions with representatives of the several other BBS survey teams, the
GHS team learns of their recent decision to attempt to move to the use of area frames. In fact, they have
already done substantial research into the issue. Since the results from this preliminary research look very
promising, the GHS team proposes to the other survey teams and to the Steering Committee that they
combine efforts in order to produce and implement an area frame. Given that the costs of creating and
updating the frame would be shared with the other surveys, the Steering Committee approves the idea.
352.
SURVEY METHODS ANDPRACTICES
STATISTICS CANADA
340
Given the decision to follow this approach, the team starts to evaluate the current state of the necessary
maps and other cartographic information to begin preparing the area frame and to arrive at a reasonable
estimate of the resources needed to complete that task in time for the survey.
The higher levels of the area frame (i.e., defining the primary sampling units) will depend on up-to-date
large-scale topographic maps, which are generally in very good condition. The lower levels (i.e., defining
secondary and tertiary stage sampling units) will have to be based on the identification of streets and
eventually of dwellings in the urban areas, and villages and dwellings in the rural areas. The team notes
that maintaining the frame will require a permanent effort on some sort of rotating basis, with extra
attention to the high-growth areas.
This requires the team to begin developing a series of steps for delineation of sampling units at the
various levels of the geographic hierarchy, ranging from identification of large-scale natural boundaries
such as major rivers, to plans for doing the inevitable listing of dwellings in selected areas. Of course, the
team cannot yet carry out the details of these steps, as that will depend on the decisions regarding the
actual sample design.
Review questions:
Why is a sample survey the only practical solution to the data requirements?
Explain whether individuals living in collective dwellings should or should not be included in the target
population. Include consideration of their accessibility as well as the likely pertinence and quality of their
responses.
Explain any other differences that may exist between the target population and the final survey
population.
If the list frame approach had been kept, what would have been the possible sources and impacts of
nonsampling error?
What do you think are the three most important likely sources of nonsampling error associated with the
use of an area frame? Suggest one or two ways to reduce or control each of them.
How many distinct scales of maps and sketches do you think will be needed to carry out the area frame
sample design?
353.
CASE STUDY
STATISTICS CANADA
341
Chapter4 - Data Collection Methods
4.0 Data Collection Method
The project team meets to decide on a method of data collection. Team members discuss the advantages
and disadvantages of the three basic methods: personal interviewing, telephone interviewing and self-
enumeration (e.g., mail-out / mail-back of a questionnaire).
Telephone interviewing does not seem very practical, since the percentage of households without a
telephone is very high, particularly in the rural areas. There is also the fact that the population is not used
to dealing with government authorities over the telephone, and many people would be very reluctant to
respond to a survey in that form. Furthermore, some of the concepts to be addressed in the survey are
complex, and people may not easily understand the explanations over the telephone. Finally, there is no
up-to-date and complete telephone directory covering the household subscribers, since telephone
coverage is increasing quite quickly in some areas. For these reasons, the team decides not to pursue the
telephone option any further.
Since the area frame approach will of necessity be based on dwelling address information, the team does
briefly consider the possibility of using a mail-out survey. However, the team has learned that the few
market surveys that have been conducted by mail encountered very low response rates, and those returned
had many incomplete or inconsistent responses. These problems become worse if the survey forms are
simply sent to the dwelling addressed to ‘Householder’ rather than to a specific person. Since the GHS
will have a much greater number of questions and some of the topics are quite complex, the mail-out
option does not appear capable of providing data of suitable quality.
There seems to be no alternative but to use personal interviewing, despite the high cost of employing a
large number of interviewers. The team begins to discuss the logistics of hiring and training a sufficient
number of interviewers, to plan the preparation of the necessary supporting manuals, and to study the
requirements for vehicles and other equipment.
Although the sample design is not yet very advanced, the survey methodologist recommends that selected
households be interviewed over several quarters in order to get good estimates of change in labour force
status. The team considers the possibility of doing the first interview face-to-face, but using telephone or
mail-out for the subsequent interviews. However, the problem of undercoverage remains for telephone
interviewing, and it is feared that mail-back response rates will be rather low, even after the personal
contact of the first interview. Nevertheless, the team continues to consider the mail-out, mail-back option
as a possible strategy for subsequent interviews.
Another factor that makes the team reconsider the self-enumeration option is the fear that certain
questions may be seen by respondents as quite personal or sensitive, and thus they may be reluctant to
provide an answer to an interviewer. A mail questionnaire might encourage them to respond to these
questions. On the other hand, much of the questionnaire is expected to be better answered in a personal
interview. One team member suggests using a mixed-mode approach – conducting a personal interview
for most of the questionnaire, but asking the respondent to fill in a separate page to answer the sensitive
questions, in private, and either place it in a sealed box held by the interviewer, or return it by mail. The
team decides that testing of the questionnaire and the collection method will be needed to resolve the
issue.
354.
SURVEY METHODS ANDPRACTICES
STATISTICS CANADA
342
One important decision still needs to be made, and that is whether to use a paper questionnaire (pencil-
and-paper, or PAPI interviewing), or to go to a computer-based approach (i.e., computer-assisted personal
interview, CAPI). The main advantages of the PAPI method is that it does not require investment in as
much expensive equipment, and that it is a well-understood approach since all the BBS’ surveys have so
far used this method. On the other hand, the GHS team members realise that, for the price of hand-held
computers for the interviewers, plus some programming investment, they could eliminate a separate data
capture stage and ensure that a large part of the data editing is done at the time of interview (when
corrections are easiest).
The team members decide to calculate the probable cost of each of these approaches, and at the same
time, they try to evaluate the likely improvements in data quality if CAPI is chosen, and weigh them
against the additional complexity of developing the CAPI computer application. Of course, solid
information on the data quality will only be available once the survey has been conducted. Still, some
approximations can be made now, to help in making the required decision.
After reviewing the available information (the cost and time of set-up, the likelihood of changing the
questionnaire after the first cycle, etc.), the team decides to conduct the first round of the GHS using
PAPI and to revisit the issue in the future.
Review questions:
Should the team have considered the possibility of using a mixed-mode approach, with telephone
interviewing in those areas of the major cities where telephone ownership is quite high? Discuss the
advantages and disadvantages of such an approach.
Discuss the advantages and disadvantages of the different possibilities that have been suggested for
dealing with the problem of sensitive questions.
Consider the security measures that will be needed to protect the equipment if CAPI is used.
Consider the measures needed in either case to protect the security and confidentiality of the data
(questionnaires, or electronic files).
355.
CASE STUDY
STATISTICS CANADA
343
Chapter5 - Questionnaire Design
5.0 Questionnaire Design
Knowing that designing the questionnaire will require a lot of work, the GHS project team meets to
divide up responsibilities for writing the first draft of the various sections.
They begin by reviewing the Statement of Objectives since it already contains the nucleus of each
question or block of questions. It now remains to convert each point into a clearly worded question that
will have the best possible chance of eliciting the desired information from the respondents.
The first block of questions will deal with characteristics of the household and required demographic
information. One team member (A) is assigned to prepare a first draft of this section, relying quite heavily
on the sorts of questions used in existing household surveys
The core of the questionnaire will deal with labour force activities of eligible household members, defined
as all persons aged 15 years or older. The content for this part is extensive so responsibility is divided
among several team members:
i. One team member (B) will deal with the questions to determine labour force status (as employed,
unemployed or not in the labour force). It is clear that more than a single question will be needed.
ii. Another team member (C) is given the task of drafting a series of questions on the type of
activities engaged in by employed persons.
iii. Team member D will prepare questions on other economic activities such as self-employment
(including agriculture) and working in the informal sector of the economy.
iv. Team member E will look at the secondary labour force activity questions dealing with hours
worked and earnings.
5.1 Questionnaire Structure
Before much work is done on the questionnaire, team member A calls a meeting of the project team to
discuss some issues encountered while developing the demographic questions. Team member A points
out that, before the actual questions can be drafted, the team must decide how the questionnaire is to be
structured. Should there be one questionnaire for everyone in the dwelling? Who should answer the
questions? Should there be a different questionnaire for collective dwellings?
One member of the team suggests that there should be two different questionnaires: one for the dwelling
and one for the individual respondents within the dwelling. Another person says that there should be
three: one for the dwelling, another for each family, and the third one each individual.
There is some debate about these approaches. On the one hand, it is felt important to understand the
family structure within the dwelling, as this information is relevant for determining how many people
depend on the income of each worker. On the other hand, it is vital to identify all individuals living in the
dwelling, and some team members fear that identifying families may lead to omission of individuals
living in the dwelling who are not a member of a family.
356.
SURVEY METHODS ANDPRACTICES
STATISTICS CANADA
344
It is eventually decided to try using two forms: one for the dwelling (to be called Form F1) and one for
each individual aged 15+ (F2).
Form F1 will collect dwelling level information, a complete list of all people living in the dwelling, which
family unit they belong to and their demographic information. This information will be used to decide
which people should receive the individual level questionnaire. Form F2 will collect the individual level
labour force activity information desired for the survey. The team decides that one person who is
knowledgeable about the household will be asked all of the form F1 questions, while Form F2 will be
asked of the individual concerned. The team notes that there must be a dwelling identifier on the
individual forms so that the dwelling information can be linked to the individual information after
collection.
One of the team members points out that, in a large household (or in a collective dwelling), the person
responding to Form F1 may not know the demographic information of everyone in the household. The
team discusses this issue and decides that if the person responding to Form F1 does not know the
demographic information for the entire household, one person from each family unit will be consulted to
complete this information.
The team members discuss whether proxy responses should be allowed for the individual questionnaires –
they decide that the interviewers should first attempt to contact each individual for whom an F2 form
must be completed, but if unable to, they can use proxy interviewing (asking the questions of a family
member).
Next, the team considers creating separate questionnaires for collective dwellings and private dwellings.
It has already been decided that large collective dwellings (military establishments, hospitals, prisons,
etc.) will not be covered by the survey. Therefore, the team feels that the smaller collectives that they will
encounter can be adequately covered by the same questionnaire as will be used for private dwellings. In
addition, if the information is necessary, a private/collective derived variable can be created after
collection based on the number of families or unrelated persons living in the dwelling.
5.2 Drafting the Questionnaire
Each team member continues with the consultation and research employed in the preparation of the
Statement of Objectives, talking to key data users and consulting existing questionnaires. The team plans
to prepare a reasonably complete draft of the entire questionnaire before undertaking extensive testing or
cognitive research on any of the sections. This is because, until the majority of the questions are present in
at least preliminary form, the order of the questions is not clear. Nevertheless, they feel that they may
need to test individual questions earlier if it turns out to be difficult to decide how they should be worded.
The team soon meets to begin reviewing the draft questions of Form F2.
Team members B and D, believing that their questions would be very easy, had volunteered to do several
time-consuming tasks related to the sampling frame and the sample design. Consequently, their drafts are
quite incomplete. Discussion of their sections will be postponed until the next meeting.
The team turns to member C’s questions on the type of labour market activity that people engage in:
357.
CASE STUDY
STATISTICS CANADA
345
Forpersons identified as being employed
C1 Is your employer (please indicate only one option)?
a state corporation
a public institution (e.g., hospital, school, ect.)
a non-family private enterprise
a family member
other (please specify)________________________
C2 What is your job title (e.g., sweeper, engineer, sales manager, driver)?
_______________________________
C3 In which sector does your employer conduct its principal economic activity?
Agriculture, fisheries and forestry
Extractive industires
Transportation
Construction
Retail trade
Wholesale trade
Tourism
Arts and cultural industries
Other services
Public administration (including security)
It is clear that team member C is an expert in industry and occupation classification. Fortunately for the
draft questionnaire, the other team members are not, and they quickly begin to ask questions. Almost all
team members raise questions or objections about question C3, saying that respondents will not
understand ‘sector’ or ‘principal economic activity’, though they agree that ‘what does your employer do’
is too vague. In addition, it is pointed out that the listed activities are the cornerstone of a classification
system that only a few specialists are familiar with, after years of work. What is an extractive industry?
Some people might think of dentists, while it really means mining and petroleum exploration and
development. Similarly, a newspaper reporter might identify his employer as belonging to the arts and
cultural industries, while a printing press operator working for the same company would likely indicate
manufacturing. Several team members argue for asking this as an open question, and having it coded in
the office. Team member C is not opposed to this, but is unsure how to word the question to provide
enough detail for the coders to be able to do their job accurately. The debate on how to ask the question or
questions lasts for several hours.
Next, the questions drafted by team member E for hours of work and wages are reviewed.
E1 Do you work
full time (35 hours per week or more)
part time (fewer than 35 hours per week)
seasonal work
E2 How much are you paid?
__________
358.
SURVEY METHODS ANDPRACTICES
STATISTICS CANADA
346
E3 Does your employer provide the following benefits?
a. Health insurance or health care Yes No
b. Rent subsidy Yes No
c. Retirement pension Yes No
Several objections are raised to question E2. ‘How much are you paid’ is not only imprecise, but sounds
intrusive – and this is a topic which many people will be reluctant to answer even if it is well phrased.
Team members recall the examples they have seen before, and insist that more precision is required. The
question should refer to the person’s total income from employment, in money terms, before deductions
for participation in any shared-cost programs (for example, contributory pension plans). But how can that
be asked in a single question? Clearly testing is required for this question.
One team member also feels that the very topic of income is too sensitive and thus requires a lead-in, such
as ‘the next question is one that we ask of all respondents to this survey, to better understand the
country’s employment situation.’ He also suggests moving it to the end of the questionnaire.
Another member feels that question E1 as stated is too vague, but is not able to suggest an improvement.
Yet another member says that the category ‘seasonal work’ does not belong with the distinction between
full-time and part-time employment, and should be asked as a separate question.
5.3 Internal Review
It is now time for the next meeting with the Steering Committee, and the discussions to date are
presented. The Steering Committee agrees with the general approach of using Forms F1 and F2. The
Steering Committee also provides some detailed comments at the question level that are consistent with
the feedback already provided by the project team.
Based on the comments of the project team and the Steering Committee, the team revises the
questionnaire as follows. (Note that, only the sections for team members C and E will be followed
through the review process.)
For persons identified as being employed
C1 What is your job title (e.g., sweeper, engineer, sales manager, driver)?
_______________________________
C2 What kind of business, industry or service was this?
_____________________________
E1 How many hours do you usually work in a week?
__________
Now I'd like to ask a few short questions about your earnings.
E2 What is your hourly rate of pay (before taxes and other deductions)?
__________
359.
CASE STUDY
STATISTICS CANADA
347
E3Does your employer provide the following benefits?
a. Health insurance or health care Yes No
b. Rent subsidy Yes No
c. Retirement pension Yes No
5.4 Questionnaire Testing
The team decides to conduct focus group testing of the current questionnaire to see whether it is easily
understood by respondents and whether they are likely to provide the correct responses.
Since the BBS does not employ qualified focus group facilitators, the project team decides to bring in an
expert in focus group testing – Mr. F. He has taken specialised training in conducting focus groups and
should be able to fit the testing into his schedule.
For the focus group, several senior interviewers are brought in from the regional statistical offices in order
to administer the questionnaire to respondents. Several dozen ‘typical’ respondents are selected by the
project team, and several focus group sessions will be conducted over the course of a week. The team
selects respondents who will represent the full range of respondents – some urban, some rural, some
working, some students, some retired.
Before the focus group discussions take place, the interviewers administer the questionnaire to the
respondents. Then, Mr. F leads separate discussions with the interviewers and the respondents to ask them
about the questionnaire and any problems encountered.
Through the focus group discussions the team discovers the following problems with the questions on
hours of work:
i. Several respondents report that they find it difficult to answer the question about the number of
hours they usually work in a week because their hours of work vary from week to week.
ii. Many respondents ask whether their overtime hours should be included in their usual hours of
work.
iii. The questions are confusing for respondents with multiple jobs.
The following problems with the earnings questions come to light:
i. Many respondents are not paid hourly, so they often say they do not know their hourly wages but
instead provide their wages for a different time frame. Usually, the interviewers record this in the
margins of the questionnaire.
ii. Many respondents are unsure of whether their employer provides benefits. In addition, this
question does not make much sense for self-employed individuals.
However, the team is very happy that there do not seem to be any problems for respondents or
interviewers with the industry and occupation questions. Just to be cautious, team member C decides to
send the responses to coders, trained in coding industry and occupation. After several hours, he finds out
that, because the responses are too general and do not provide enough information, the coders are unable
360.
SURVEY METHODS ANDPRACTICES
STATISTICS CANADA
348
to code them to a detailed level. It will be necessary to include several questions about industry and
occupation so the coders have enough information to make a decision about the correct code to assign.
The team obviously still has much work to do on the questionnaire.
5.5 Final Draft
After the comments resulting from the focus group testing have been incorporated into the questionnaire,
the final draft of the sections written by team members C and E is as follows (Note that, these questions
will only be asked of employed respondents):
JOB DESCRIPTION
The following questions refer to your main job (that is the job at which you work the most hours).
JD1 Are you an employee or self-employed?
Employed (go to JD5)
Self-employed
JD2 Do you have an incorporated business?
Yes
No
JD3 Do you have any employees?
Yes
No
JD4 What is the name of your business? (go to JD6)
______________________
JD5 For whom do you work?
______________________
JD6 What kind of business, industry or service is this? (e.g., road maintenance, primary school,
rice farm, retail shoe store, garage)
______________________
JD7 What is your work or occupation? (e.g., legal secretary, plumber, fishing guide, school
teacher)
______________________
JD8 In this work, what are your main activities or duties? (e.g., prepare legal documents, install
residential plumbing, guide fishing parties, teach mathematics)
______________________
WORK HOURS (MAIN JOB)
The following questions refer to your work hours at your main job (that is the job at which you work the
most hours).
361.
CASE STUDY
STATISTICS CANADA
349
WH1Does the number of hours you work vary from week to week?
Yes
No (go to WH3)
WH2 On average, how many hours do you usually work per week? (go to next section)
__________
WH3 How many hours did you work last week?
__________
WH4 Last week, how many hours of paid overtime did you work at this job?
__________
WH5 Last week, how many extra hours without pay did you work at this job?
__________
EARNINGS
Now I'd like to ask a few short questions about your earnings.
E1 Are you paid by the hour?
Yes (go to E2)
No (go to E3)
E2 What is your hourly rate of pay? (go to next section)
__________
E3 What is the easiest way for you to tell us your wage or salary, before taxes and other deductions?
Would it be yearly, monthly, weekly, or on some other basis? What are your wages or salary?
__________/Yearly
OR __________/Monthly
OR __________/Weekly
OR __________/Other (specify time frame ___________)
Review questions:
Since this is the first version of the GHS questionnaire intended for use in a full-scale survey, what sorts
of testing would you propose?
Propose other versions of the questions presented in section 5.5.
362.
SURVEY METHODS ANDPRACTICES
STATISTICS CANADA
350
Chapter 6 - Sample Designs
Note to the reader: Chapters 6, 7, and 8 deal with Sample Design, Estimation, and Sample Size
Determination and Allocation, respectively. Because each of these components of a survey design
depends heavily on the others, in reality their development is carried out as a single, quite complex
operation. To respect the order in which the material is presented in the corresponding chapters in the
Manual, the three topics are considered separately here.
6.0 Sample Design
Since there are no current lists of the population of Belleterre and it would be prohibitively expensive to
develop such a list, an area frame is chosen. In order to select members of households, the area frame
must ultimately sample dwellings (i.e., the ultimate sampling unit is the household and the interview will
be conducted with one member of the household who will report for everyone in the household.)
The exact form of the selection of dwellings is not immediately evident, but in order to avoid listing all
dwellings, it seems logical to use a two- or three-stage cluster design (and thus only list those dwellings in
areas sampled at the last stage). The team realises that three-stage sampling, while possibly more cost
efficient, may be complicated to carry out in practice, and so they make all efforts to identify suitable
units to permit a two-stage design.
The team agrees that the sample design will use geographic stratification at several levels of detail.
Belleterre is naturally divided into eleven regions, namely the three major cities and eight additional
districts. Within the districts, several more cities and large towns are considered as urban, and numerous
villages and outlying areas are considered as rural (see outline in Chapter 1 of the Case Study).
Because of the recent changes in the population and labour force dynamics of the country, and differences
between the major cities and the rest of the country, the Steering Committee has indicated that it wants
the GHS to provide the same level of precision (sampling variance) for each major city and for each
district. Given this requirement, it is more efficient to treat the three cities and eight districts as planned
domains – that is to design them as strata – to guarantee the required sample in each of them. This gives,
in effect, eleven first-level strata, where equal reliability must be obtained in each.
The team also wishes to make the sample as representative as possible for reasonably large areas within
each city and district, and so to further stratify. These secondary strata are constructed to have roughly
similar sized populations and to follow county or municipal boundaries.
This geographical stratification is also motivated by administrative convenience, as the proposed strata
correspond for the most part to the different levels of administrative units such as cities, districts and
counties.
While there are other desirable stratification variables, both demographic and economic, it does not seem
feasible to use them in this design, as they will not be available on the area frame before the sample is
selected. However, the possibility of post-stratification at the estimation stage will be considered later,
and due attention will be paid to ensuring that the desired variables are collected in the survey
questionnaire.
363.
CASE STUDY
STATISTICS CANADA
351
Consequently,a two-stage stratified cluster design is proposed in which each of the three major cities and
the eight districts is a stratum and within each of these strata, sub-strata are created. The identification of
relatively small sub-strata will make it much easier to adhere to a two-stage design.
To avoid confusion between the different levels, it is agreed to refer to the top-level strata (Cities A, B
and C and the remaining eight districts) by the term ‘region’, and to reserve the word ‘stratum’ for the
lower-level sub-strata. For ease of reference, the eleven regions are identified as follows:
Table 6.1: Regional Strata
Region
1 City A
2 City B
3 City C
4 District D
5 District E
6 District F
7 District G
8 District H
9 District J
10 District K
11 District L
Within each stratum, a number of primary sampling units (PSUs), or clusters, will be defined, and at the
first stage of sampling one or more PSUs will be selected in a stratum. For the sake of efficiency, the
PSUs should not be too big. In fact, it would be desirable for them to be of a suitable size to be covered
effectively by a team of interviewers in the amount of time planned for data collection. This would imply
that the PSUs should be of roughly equal size, containing several hundred dwellings.
At the second stage of sampling, all dwellings within the PSU will be listed and then sampled (and one
member of the household interviewed.) The number of dwellings sampled per PSU should be reasonable
for an interviewing team. In discussions with the regional offices, this has been determined to be 40
dwellings.
The team knows that it is desirable to select at least two clusters per stratum to allow correct estimation of
sampling variance, and that according to the classic texts, this estimation becomes more complex if more
than two clusters are selected using probability proportional to size (PPS) sampling, as they consider
necessary. Therefore they seek to arrange matters so that two clusters are selected in each stratum.
Subsequently, dwellings must be listed within selected clusters, and a sample of dwellings drawn at the
second stage. Once the lists have been compiled, dwellings could then be selected using simple random
sampling (SRS) or systematic random sampling (SYS). For practical reasons, such as attempting to
distribute the sample as well as possible throughout the selected clusters, the team decides to recommend
using SYS.
Although the details of the sampling fractions have not yet been worked out, it already seems clear that
they will be fairly low within selected clusters (perhaps 40 in 400 dwellings, or one in ten), so SYS is
quite practical. At the same time, although this spreads the sample out over a certain area, the territory
covered by a single cluster should not generally be very large, so that the costs of moving around within
the selected cluster will not be large compared to the costs of getting there in the first place.
364.
SURVEY METHODS ANDPRACTICES
STATISTICS CANADA
352
After some preliminary work, it becomes evident that the cluster sizes will vary quite noticeably, if
natural boundaries are to be respected. Yet those natural boundaries are quite important to the good
control of field operations and selection of the right clusters and dwellings as indicated by the maps and
lists.
It is eventually decided to select clusters using probability proportional to size sampling (PPS), using the
most recent population estimates for each cluster as a size measure. Within each selected cluster, a fixed
number of dwellings will be selected using SYS. (Chapter 7 shows that this means that all units in the
same stratum have the same probability of selection.)
Having established the general structure of the sample design, the team begins to work out the details of
the design for region 1 (City A) and region 4 (district D), planning to use the same approach in the
remaining regions.
Review questions:
Is there a realistic alternative to the two-level stratification (region and stratum) developed by the GHS
team?
Would a three-stage sample design, using larger PSUs and an intermediate stage of Second Stage Units
(SSUs) as clusters, have been more efficient? Would it have been feasible in practice?
The sampling plan will use the PPS method for cluster selection. Would PPS Random or PPS Systematic
be more appropriate? If you choose PPS Systematic, how would you suggest sorting the lists of clusters?
Considering the plan to use SYS for selection of dwellings in selected clusters, comment on the possible
disadvantages of this approach in the truly rural areas. Suggest an alternative strategy for these areas.
The design has been made self-weighting within each stratum. Is there a reasonable way to make the
sample self-weighting at the region level, i.e. to ensure that all selected dwellings in an entire region have
the same design weight? Is this a desirable goal?
365.
CASE STUDY
STATISTICS CANADA
353
Chapter7 - Estimation
7.0 Estimation
The GHS team now begins to work out the procedures needed to obtain survey estimates of the
characteristics collected via the questionnaire.
Although the sample will include many thousands of households (see Chapter 8 of the Case Study for
details), the information obtained by interviewing those households is intended to represent the country’s
entire population of nearly 11 million households.
Given the probability sample design developed in Chapter 6 of the Case Study, and with the sample size
and allocation described in Chapter 8, the sample results will indeed provide representative estimates for
the country’s population, and will have the desired small sampling variance, as long as there are no
serious problems with nonresponse.
7.1 Weighting
The GHS must produce estimates for a large number of variables, but all those estimates will be based on
a set of weights attached to each responding household’s data record, and determined by the product of
three straightforward calculations:
- the design weight, calculated from the dwelling’s probability of selection;
- an adjustment factor for nonresponse;
- a post-stratification adjustment to demographic benchmarks.
7.1.1 Design Weight
The first step is to calculate the design weight, which as its name suggests is derived directly from the
sample design, namely the design weight is the inverse of the probability of selection. The sample design
in this case is a stratified two-stage design with PSUs selected using PPS at the first stage and SSUs
(dwellings) selected using systematic sampling at the second stage.
The design weight is calculated for the selected dwelling. The household living in that dwelling, and each
person in that household, will have the same design weight. In a multi-stage probability design, the
selection probability of a final-stage unit is simply the product of the selection probabilities at each stage.
Equivalently, the design weight can be seen as the product of the weights at each stage, since each of
them is the inverse of the corresponding probability.
Hence, for the GHS design, the complete design weight is just the product of the first- and second-stage
weights. Thus every selected dwelling i in cluster j of stratum h has design weight equal to:
hjihj
hjidw
,2,1
,
11
ππ
×=
366.
SURVEY METHODS ANDPRACTICES
STATISTICS CANADA
354
where π1,hj is the probability of selecting cluster j in stratum h at the first stage, and π2,hji is the probability
of selecting dwelling i in cluster j of stratum h at the second stage (given that cluster j was selected at the
first stage).
It should be noted that the numbering of the strata actually has two levels. The first is the identification of
the city or district (first-level stratum) and the second is the stratum identification number within that city
or district. This is indicated for convenience by the single subscript h.
Since clusters are selected with probability proportional to size (PPS), those probabilities must be
calculated in terms of the size measures used at the time of the survey design. The size measure used is
the number of dwellings in the cluster; this measure will be denoted by z, and cluster j in stratum h has
size zhj. The total size measure for any stratum h is:
∑=
hm
j
hjh zz
where mh is the number of clusters in stratum h.
If kh clusters are selected in stratum h, the selection probability of cluster j is khzhj/zh and so the first-stage
design weight for that cluster is:
hjh
h
hj
hjd
zk
z
w
×
=
=
,1
,1
1
π
At the second stage, 40 dwellings are to be selected. This means that all dwellings in cluster j have
second-stage selection probability
hjz
40 . Consequently, the second-stage design weight for selected
dwellings is:
40
1
,1
,2
hj
hji
hjid
z
w
=
=
π
Note that the size measure zhj refers to the size – number of dwellings in the cluster – at the time the
sample is being designed. This could be different from the size measures obtained by the interviewer after
listing has been performed within the selected clusters. The amount
40
hjz
is the interval used for systematic
sampling at the last stage. Applying this fixed interval to the actual count of dwellings listed in the PSU
will yield a variable sample size per cluster that is expected to be close to 40.
The GHS team recognises that the clusters will have to be selected using estimated sizes since it
impossible to enumerate the entire country. They must then stick to those size measures for the second-
stage weight calculation. In effect this means that the stratum post-censal population estimates serve as an
anchor, which makes sense if the same figures are to be used for explicit post-stratification (see below).
367.
CASE STUDY
STATISTICS CANADA
355
Therefore,
40
40
11
,2,1
,
×
=
×
×
=
×=
h
h
hj
hjh
h
hjihj
hjid
k
z
z
zk
z
w
ππ
andthis may be denoted simply as wdh.
Note that all selected dwellings in the selected clusters in stratum h have the same design weight, and the
design is self-weighting at the stratum level.
7.1.2 Nonresponse Adjusted Weight
The next component of the weight is the adjustment for total nonresponse. Although a high level of
response is anticipated, it will surely not be 100%, and failure to make an adjustment for the actual
amount of nonresponse would lead to underestimates of totals.
There is also, of course, the risk that nonrespondents as a group are different from respondents, with
respect to some of the important survey variables, in which case adjusting the weights of respondents to
represent nonrespondents could lead to bias.
The GHS team considers this risk carefully. The team methodologist points out that the nonresponse bias
in any estimate is essentially the product of two factors: the amount of nonresponse, and the degree to
which the nonrespondents are different from the respondents.
The team anticipates a fairly low level of nonresponse, so it is hoped that one component of that product
will be reasonably small. They wonder whether the nonrespondents are really likely to be very different
from respondents with respect to most of the important survey variables. It seems quite likely that
nonrespondents may indeed have quite different characteristics from respondents. For example, the team
fears that persons who have been laid off, who are recent migrants or who are very mobile may be much
less likely to respond than persons with regular, stable employment in their place of permanent
registration. This would lead to a significant contribution to nonresponse bias.
However, the team has no hard evidence, and decides that for the moment it must plan to adjust the
weights as if nonresponse were random. At the same time, they agree to recommend follow-up studies of
a sub-sample of nonrespondents to attempt to obtain a measure of the size of the bias which, they feel
quite sure, should not simply be ignored. They also feel that another study should be put into place to
examine partial nonresponse (where only some questions were answered), to see if a profile of reluctant
respondents can be obtained in that way.
Given the sampling design used, there are several possible ways to make the weight adjustment for
nonresponse. It could be made at the level of the cluster, the stratum or the city/district. It seems
unreasonable to make a single adjustment for the entire country, since it is known that the population is
not homogeneous; in fact, even adjusting at the level of each district or major city seems inadvisable for
the same reason. Since the strata are usually counties, while clusters are quite small, the choice may be
important. Clusters may be more homogeneous than entire strata, but are small enough that the
368.
SURVEY METHODS ANDPRACTICES
STATISTICS CANADA
356
adjustments may not be too stable because of the small sample sizes and possibly quite variable response
rates at that level.
Since the stratum sample is several times that of each cluster, and since the design weight is the same for
both clusters in any case, the team feels that it is most sensible to apply the adjustment at the stratum
level.
If the number of respondent households in the stratum is nrh, the nonresponse adjusted weight will be
equal to
rh
h
hr
h
h
h
r
hdhnr
n
z
n
k
k
z
n
n
ww
=
×
×
×
=
=
,
,,
40
40
and all respondent households and persons in the stratum again have the same weight.
It may be noted that this will only be strictly true as long as all eligible persons in a responding household
are themselves respondents. For planning purposes, the GHS team has assumed that this will be true, but
they are prepared to propose a further adjustment to the weights of individuals if not all individuals
respond.
The team notes that the numerical values of the design weights will vary considerably from stratum to
stratum, since the stratum sizes vary, and k may not be the same in all strata. The range of values may not
be terribly wide, but is more than enough to prevent the design from being considered as self-weighting
above the stratum level.
7.1.3 Final Post-Stratified Weight
The team proposes to include an adjustment to the weights to make sure that the estimates reproduce
important known totals, and to improve the precision of the estimates by post-stratifying according to
homogenous groupings. The most important of these from the point of view of labour force participation
is the population size for each sex and for the major relevant age groups (15-24, 25-49, 50-64 and 65+
years of age), since these groups have markedly different labour force profiles.
The post-censal population estimates by age and sex are based on data from the most recent census,
updated using housing registers and vital statistics on births and deaths. These figures are thought to be
highly accurate for each major city or district, but because they take little account of internal migration
and have been projected for nearly ten years, the GHS team is not sure whether they are very good at the
stratum level.
They consult with officials of the BBS’ Demographic Studies Division, and come to the conclusion that
they should recommend adjusting only at the level of the district or city, but that the adjustment should be
made at the stratum level once the next census results are available.
369.
CASE STUDY
STATISTICS CANADA
357
Thefinal weight for each individual respondent will therefore be:
za
za
hnrhzaf
N
N
ww
ˆ,, ×=
where Nza is the post-censal population estimate for age-sex group a in city or district z, and zaNˆ is the
sum of the (nonresponse-adjusted) weights over all respondents in area z who belong to age-sex group a,
and corresponds to the direct survey estimate of the population in that age-sex group.
It may be noted that this now gives individuals in the same household different weights. However, the
sample is now self-weighted within age-sex group and stratum.
7.2 Estimation of Sampling Variance
Standard textbooks contain formulae for stratified two-stage designs that are self-weighting at the stratum
level, although these are somewhat complex. However, because of the adjustments being proposed for
nonresponse and age-sex totals, the algebraic expressions will become complex, and the team resolves to
undertake research into applying a computationally-intensive replication method such as the jackknife or
the bootstrap. So far, they have not done much work on this aspect.
Review questions:
Is the GHS team correct in assuming that there is little risk of nonresponse bias? Consider the probable
response rates for private households versus collective households, especially those containing many
transient workers or recent migrants. Would it be possible to stratify by type of household (dwelling)
before making the nonresponse adjustment within those strata?
Comment on the choice of level for making the nonresponse adjustment. In your opinion, did the team
make the right decision regarding weight adjustment for nonresponse? Would it be best to adjust the
weights at the level of the cluster, the stratum or the city/district? Give your reasons.
Do similarly with regard to the post-stratified adjustment for age and sex.
370.
SURVEY METHODS ANDPRACTICES
STATISTICS CANADA
358
Chapter 8 - Sample Size Determination and Allocation
8.0 Sample Size Determination and Allocation
Having established the general structure of the sample design, the team begins to work out the details of
the design, namely the sample size, the allocation of the sample across strata and the numbers of clusters
per stratum.
The team considers the most important variables to be measured: these are percentages or proportions,
such as the proportion of adults who are in the labour force, the proportion holding jobs, the proportion of
persons aged 55+ who are still economically active, and so forth.
The team, in consultation with the Steering Committee, considers what factors should be taken into
account in determining the sample size and its allocation among regions. The Steering Committee
indicates that, while a high degree of precision is required at the national level, it is very important to
control the precision for each region, since it is at the regional level that planning decisions will primarily
be made.
There is some discussion of using an optimal allocation function to take account of differential costs or
variances between regions. However, no good indication of relative differences in the variances is
available, and it is felt that the data collection costs, the largest single component of the survey’s total
cost, will not vary greatly from region to region. Also, optimum allocation may not ensure adequate
precision for regional estimates. Therefore, it is decided to aim for the same margin of error for all
regions.
The methodology representative on the Steering Committee points out that, if good precision is obtained
for each of the eleven regions, in terms of small margin of error for the most important estimates, then the
margin of error for the national estimates will be no more than about one third of the regional margins of
error, implying a very good degree of precision.
The stated precision requirements indicate that the margin of error (at the 95% level of confidence) should
be no more than 2.5% for the key variables, for each of the 11 regions. Since each region has a large
population, this means that the sample size should be the same in each region.
8.1 Sample Size Determination by Region
1. Initial Sample Size in Each Region
A preliminary estimate of the sample size, n1, is:
2
2
1
)ˆ1(ˆ
e
PPz
n
−
=
where e is the margin of error (.025) and Pˆ is the targeted proportion (assume P=.5).
371.
CASE STUDY
STATISTICS CANADA
359
537,1
)025(.
)5.1(5.)96.1(
2
2
1
=
−××
=n
2.The methodologist notes that there is probably no need to adjust the sample size for the size of the
population since the smallest region – City B – is very large (over 2 million people). Thus, n2=n1.
3. The best estimate of the overall design effect is deff=2 (based on similar surveys conducted in
other countries):
074,3
537,12
23
=
×=
×= ndeffn
4. The sample size is adjusted for the nonresponse rate, which is expected to be no more than 20%
(again based on similar surveys conducted elsewhere). This nonresponse also accounts for a
modest percentage of vacant or unoccupied dwellings and a reasonable level of nonresponse due
to families being temporarily absent or simply difficult to locate. The final sample size per
regions is estimated at:
843,3
8.
074,3
3
=
=
=
r
n
n
So, across all regions, the total sample size is 11 x 3,843 = 42,473 people to survey. Because the team has
assumed approximately two adults per household, this means 21,237 households across Belleterre (1,922
per region).
Several team members do not understand the significance of the assumption of two adults per household.
The methodologist explains that the sample unit for the survey is the dwelling, however, all estimation
will be done for the adult population of the country, since it is they, not dwellings, who comprise the
labour force. Therefore, since the precision requirements are related to adults, these calculations must first
be done based on the number of adults required then translated to the number of dwellings required in the
sample.
The methodologist confirms that there is no need to consider the finite population correction since for
City B (the smallest region) it is 3,843 divided 2 million, which is 0.0019.
The team is planning to monitor response rates for every selected cluster, noting the type of household
and other relevant information, in order to detect any differences in response rates by household type, or
by region or other variables that could be taken into account in developing a revised nonresponse weight
adjustment strategy in subsequent years.
372.
SURVEY METHODS ANDPRACTICES
STATISTICS CANADA
360
8.2 Definition of Second Stage Stratification and Clusters
The country’s population as of 2005 is estimated to be approximately 44 million people, and the team has
been advised to assume an average of 4 persons per dwelling (allowing for children, elderly relatives, and
a small percentage of multi-household dwellings other than collectives). This translates into a total of
about 11 million dwellings, taken for planning purposes to correspond to 11 million households.
With a sample size of 21,237 households, this would indicate an average sampling fraction of 1 in 518.
This may appear very low, but the sample size is still quite a large number. At the regional level, the
populations vary widely, and therefore so do the sampling fractions dictated by the targeted regional
sample size of 1,922 dwellings. Among the regions, the sampling fractions will range from about 1 in 268
in City B to 1 in 754 in the most populous region, District J.
The sample design has been set up to allow for the definition of a large number of strata, each of which
will have a substantial number of primary sampling units (PSUs) referred to as clusters. Two
(occasionally three) clusters will be selected per stratum to facilitate use of simple variance estimation
techniques.
Of course, there will be differences in strata and cluster sizes within each region, so that the sampling
fractions in each stratum within a region will vary somewhat. Also, the team keeps in mind that it is not
desirable for the within-cluster sampling fractions to become too small, as that would lead to undue
geographic dispersion, at least in the rural areas.
As mentioned earlier, the strata within each region were defined by administrative, municipal boundaries.
Table 8.1: Stratification
Region Counties Municipalities Strata
City A 3 21 21
City B 3 17 17
City C 3 16 19
District D 11 23 23
District E 11 26 26
District F 13 29 28
District G 10 26 26
District H 7 21 23
District I 11 26 26
District J 13 34 34
District K 11 28 30
Total 96 267 273
N-proportional Allocation Across Strata within each Region
The regional sample will be allocated across strata using N-proportional allocation. Recall that with N-
proportional allocation,
N
N
nn h
h ×=
where here n=1,922.
Within each stratum, clusters are created. Considerations related to the efficiency of field operations limit
the ranges of options in determining cluster sizes. A team of 3 interviewers and 1 supervisor should be
373.
CASE STUDY
STATISTICS CANADA
361
ableto do between 75 and 100 interviews in a week. To allow for unforeseen circumstances, it is decided
to make the sample size in each cluster 40, so that the team can cover the expected two clusters in a
stratum within a week’s work, for a total of 80 interviews if there is a 100% response rate. For strata with
three selected clusters, it is planned to have 4 interviewers on the team, and perhaps take one or two days
longer to cover the assignment.
The cluster creation and sample allocation for City A results in the following:
Table 8.2: Allocation of Sample Across Strata in City A
Stratum County Population
of
Dwellings
(Nh)
Number of
Clusters in
Stratum
Average
Cluster Size
(Dwellings)
Sample Size
Of
Dwellings
(nh)
1 1 39,836 52 766 75
2 1 42,481 50 849.6 80
3 2 58,411 43 1,358.4 110
4 2 52,039 45 1,156.4 98
5 3 55,800 48 1,162.5 105
… … … … … …
21 9 50,900 52 978.8 96
Total 1,020,600 1,092 934.6 1,922
Notice that the sampling fractions in each stratum are roughly equal (because the strata are roughly equal
in size). Within City A, sampling fractions vary from 1 in 529 to 1 in 535.
Because in each cluster we want to sample 40 dwellings and since we can only select an integer number
of clusters, the expected sample size in City A is 2,000 (i.e., 50 clusters with 40 households per cluster),
as shown in the table below.
Table 8.3: Number of Clusters to Sample In Order to Satisfy Above
Stratum Population
of
Dwellings
(Nh)
Number of
Clusters in
Stratum
Number of
Clusters
Sampled
Sample Size
Of
Dwellings
(nh)
1 39,836 52 2 80
2 42,481 50 2 80
3 58,411 43 3 120
4 52,039 45 3 120
5 55,800 48 3 120
… … … …
21 50,900 52 3 120
Total 1,020,600 1,092 50 2,000
District D has 11 counties, in which a total of 23 strata have been defined. The structure is somewhat
more complicated than City A, since the counties vary widely in population, and it is desirable that
stratum boundaries should not cross county lines. In one case, two small counties are merged to make a
single stratum, and in another the county is itself a stratum. In most cases, the county becomes two or
three strata (broken down by municipal boundaries).
374.
SURVEY METHODS ANDPRACTICES
STATISTICS CANADA
362
One team member, an economist, has pointed out that within any county, the economic and labour force
characteristics of the urban and rural parts are likely to be quite different and that cluster sampling may be
very inefficient. The methodologist considers this problem and suggests forming the two or three strata
within a county so that one contains the most urban areas and the other (or other two) contains the most
rural parts. Since then two or three clusters will be selected in each resulting stratum, the other team
members agree that the sample should be reasonably well balanced.
The resulting stratum sizes now range from 19,400 to 37,600 dwellings, averaging 28,300 dwellings per
stratum. The clusters are on average somewhat smaller than in City A, the number of clusters per stratum
from 24 to 44 with again 2 or 3 clusters to be selected per stratum to yield 80 or 120 dwellings per
stratum.
The following table shows the sample for District D allocated across its 23 strata using N-proportional
allocation.
Table 8.4: Allocation of Sample Across Strata in District D
Stratum County Population of
Dwellings
(Nh)
Number of
Clusters in
Stratum
Average
Cluster Size
(Dwellings)
Sample Size
Of
Dwellings
(nh)
1 Urban 1 22,400 25 896 66
2 Rural 1 26,200 32 818.8 77
3 Urban 2 30,200 25 1,208 89
4 Rural 2 24,400 28 871.4 72
5 Rural 2 30,600 38 805.3 90
… … …
9 Urban 4 21,800 26 838.5 64
10 Rural 4 28,900 32 903.1 85
11 Rural 4 32,200 36 894.4 95
12 Rural 5 19,400 24 808.3 57
13 Rural 6+7 24,200 26 930.8 72
14 Urban 8 28,900 34 850 85
15 Rural 8 29,400 41 717.1 87
….
22 Urban 11 30,800 44 700 91
23 Rural 11 22,900 29 789.7 68
Total 650,100 856 759.4 1,922
375.
CASE STUDY
STATISTICS CANADA
363
Table8.5: Allocation of Sample Across Strata in District D
Stratum Population
of
Dwellings
(Nh)
Number of
Clusters in
Stratum
Number of
Clusters
Sampled
Sample Size
Of
Dwellings
(nh)
1 22,400 25 2 80
2 26,200 32 2 80
3 30,200 25 3 120
4 24,400 28 2 80
5 30,600 38 3 120
… …
9 21,800 26 2 80
10 28,900 32
11 32,200 36 3 120
12 19,400 24 2 80
13 24,200 26 2 80
14 28,900 34 3 120
15 29,400 41 3 120
….
22 30,800 44 3 120
23 22,900 29 2 80
Total 650,100 856 50 2,000
So, the overall expected sample size of adults is 4,000 for City A and District D. Performing the
allocation for all cities and districts, the methodologist finds the expected overall sample size to be
22,000.
Review questions:
Discuss the GHS team’s assumption of ‘one household, two adults’. Can they do better than this, before
obtaining data from the first round of the GHS?
How will the inclusion of collective dwellings affect the assumption made in the previous point and your
response to it?
Can you give some practical arguments why the within-cluster sample size should be larger, or smaller,
than has been suggested by the GHS team? (Consider the field conditions in which the interviewing teams
will be working). Would it not be better to make smaller clusters and then smaller samples of dwellings
within clusters, combining several selected clusters to make an interviewing team’s assignment?
Comment on the advantages and disadvantages of such a modification.
Given that the sample size determination targets a margin of error of 2.5% for each of the 11 regions,
with widely varying populations, approximately what margin of error would you expect at the national
level?
Comment on the assumption of an average of 4 persons per household. How will this vary between rural
and urban areas?
376.
SURVEY METHODS ANDPRACTICES
STATISTICS CANADA
364
Chapter 9 - Data Collection Operations
9.0 Data Collection Operations
As soon as it was decided to use personal interviewing for data collection for the GHS, the project team
began to prepare for the data collection operations.
The use of a two-stage sample design requires that the definition of the clusters and the allocation of
sample size to strata and to clusters be statistically efficient, while at the same time being both cost-
effective and feasible from an operational point of view. Because of these considerations, much of the
preparatory work for the data collection operations was done in parallel with the development of the
sample design.
9.1 Regional Organisation of the GHS Project
The BBS is responsible for the overall design and management of the GHS. However, in order to conduct
data collection and processing, they require the active collaboration of the statistical organisations at the
district and sub-district levels.
In each of the three major cities there is a district statistical office. These offices will be intensively
involved in data collection and the first stages of data processing, working under the general direction of
the BBS. Each of the other 8 regions (Districts D-K) also has a district and in some cases sub-district
office(s). Each district has between 7 and 13 counties and most of these counties correspond to two or
three strata. Thus, it is still practical to organise the data collection teams at the level of the county, under
the co-ordination of the district office and, of course, the BBS. Data collection costs will be reduced since
members of the interviewing teams will likely reside in the areas in which they will be interviewing, or at
least live quite nearby.
The BBS, functioning as the survey’s head office, is primarily responsible for establishing the data
collection timetable and target response rates. As well, the BBS, in collaboration with the district
statistical offices, designs the reporting system and control forms required to guarantee the correct listing
and selection of sampling units, and the timely flow of completed questionnaires back to the statistical
offices.
In similar fashion, the BBS team prepares the training and operations manuals for interviewers and
supervisors, sharing the drafts of these documents with the district offices for comment and revision.
Training exercises and other materials are also designed by the BBS, although most of the training
sessions will be held and district or sub-district offices. Once finalised, the manuals and other forms will
be printed by the BBS, and distributed through the district and sub-district offices.
Because of the scope of the activities to be conducted and co-ordinated, each of the district offices has
named a GHS regional project manager. This person is responsible for much of the organisation of the
office’s work on the GHS, and is the principal point of contact for the main GHS team at the BBS. Since
it has been decided that the data capture will also be conducted in the district offices, the regional
manager is also responsible for co-ordinating these activities (see Case Study Chapter 10). The regional
managers will be responsible for the flow of materials from the BBS to the local offices, as well as the
return of completed questionnaires to their own offices for data capture, and of the electronic files to the
BBS for final processing (editing and imputation, outlier detection).
377.
CASE STUDY
STATISTICS CANADA
365
Usingthe guidelines developed in conjunction with the BBS team, the regional managers will work with
their local counterparts to identify suitable candidates for hiring and training as interviewers and
supervisors. To ensure consistency, these steps will be monitored and observed by the BBS team, who
will also receive regular progress reports from the regional managers.
In most cases, a team of one supervisor and three or four interviewers hired at the county level (or sub-
district office level) will be responsible for data collection in the clusters in its GHS stratum. In some
cases, an interviewing team will cover more than one stratum, but given the plan to conduct all
interviewing in little more than a week, this is not expected to happen in many cases. The team will work
together in a cluster until it has been completed and then move on to the next cluster.
The GHS project team notes that this requires a total of nearly 275 supervisors (one for each of the 25
strata in each of the 11 regions), and close to 900 interviewers altogether.
9.2 Public Relations
Because the GHS is an important new survey and the BBS intends to obtain the highest possible quality
of data, including data from population groups that may have reason to be wary of answering questions,
the team decides, with the approval of the GHS Steering Committee, to invest in an extensive public
relations campaign across the country.
For this purpose, a staff member of the BBS’ Communications Division is assigned to work with the GHS
project team to prepare suitable informative material. This will include an introductory letter explaining
the objectives and the importance of the GHS. The letter will be signed by the Director General of the
BBS, and a suitable public figure at the community level, either the manager of the district or sub-district
statistical office, or a well-known representative of the municipal administration.
The first draft of the letter follows:
Dear respondent,
Your household has been selected to participate in the Belleterre General Household Survey. This
important new public survey will provide essential information on the work activities of the population of
our country, and how families are doing in the current time of rapid economic change.
This survey is being conducted by the Belleterre Bureau of Statistics. The confidentiality of the
information gathered by this survey is protected by the law. Your answers to the survey questions will be
kept strictly confidential. All the data obtained from this survey will be used for statistical purposes only.
Your answers will be combined with those of many other citizens to provide a statistically reliable picture
of conditions in the country.
The interview will take approximately 20 minutes to complete. If it is not convenient for you to take that
much time when our interviewer first calls on you, he/she will be happy to make an appointment to
conduct the interview at a time more convenient to you.
The Belleterre Bureau of Statistics recognises the important contribution that you and other citizens make
in taking the time to provide your share of this vital information. We thank you in advance for your
valuable contribution.
378.
SURVEY METHODS ANDPRACTICES
STATISTICS CANADA
366
If you have any questions that the interviewer is unable to answer, please feel free to contact the local
GHS representative at the branch/county statistical office, located at --------------------------; or by
telephone at 1-23-456-7899.
J. Doe P. Smith
Director, BBS Responsible Officer
(Local Office Name)
A carefully worded press release is also prepared, to be sent to all local newspapers, radio stations and
police offices, as well as the offices of municipal administration, informing them of the upcoming GHS
activities and requesting collaboration in informing the general public. To facilitate this task, several key
paragraphs are written that can be read by news announcers or printed verbatim in newspaper reports. In
this way, the same message will be used throughout the country.
9.3 Preparing for Collection
The GHS survey team must develop three manuals: one for listing of dwellings, one for interviewing, and
one for the supervisors who will oversee both operations.
In order to write the interviewers’ and supervisors’ manuals, the GHS team consults manuals used for
other household surveys in the past and extracts whole sections to include in the GHS manuals. Much of
the listing manual, however, has to be developed from scratch since the BBS has not done listing before.
The team is able to refer to manuals from countries that frequently use area frames in order to help
develop the manual.
As mentioned above, the supervisors will be hired first and trained. Supervisors should preferably have
previous survey experience. They must also have the necessary personal qualities and skills to effectively
manage a team of several interviewers during the listing and interviewing activities and to deal with
difficult respondents, while at the same time ensuring that data and other information are transmitted
reliably and in timely fashion back to the responsible statistical office. All staff hired must be reliable and
trustworthy – to get the job done as prescribed and to preserve confidentiality of the data collected.
Approximately 275 supervisors are needed who will be trained by the regional project managers. The
GHS team plans to make an intensive effort to train the regional project managers thoroughly in the
survey objectives, concepts, collection procedures, etc., so that they can work with small groups of district
or sub-district representatives to interview candidates for supervisors’ positions, and then to train those
who are hired. Subsequently, those hired as supervisors will join with the district and sub-district office
representatives, under the direction of the GHS team and the regional managers, to interview and hire a
sufficient number of qualified interviewers.
If possible, the GHS would prefer to assign existing supervisory and interviewing staff to the project.
However, in case some positions cannot be filled from within the various regional offices, announcements
will be made on the radio, in the local newspaper and in community halls, inviting applications and
stating the essential qualifications for the work.
Thorough training will be conducted to prepare the interviewers for their tasks. In each case, they must
first study their manuals at home and do several written exercises. Next, they will undergo several days of
in-class training, during which they will study interviewing skills and techniques and will familiarise
379.
CASE STUDY
STATISTICS CANADA
367
themselveswith the questionnaire. During training, the supervisors will discuss and correct the written
exercises completed at home by the interviewers and practice interviews will be done, both with other
interviewers and with respondents who will not be in the GHS sample.
9.4 Listing
Because the sample design is based on clusters which have been delineated on maps, the first task for the
interviewing teams is to identify the selected clusters and go into the field to list the dwellings in them
with a sufficiently detailed description that they can be uniquely identified and easily found again if
selected for interviewing. The teams proceed on foot, by bicycle or by car, depending on the geographic
size of the cluster.
Once the lists are completed, the supervisor and the district or sub-district office representative (following
the instructions received from the GHS team through their regional managers) select the appropriate
number of dwellings, using systematic sampling from the lists, with sampling intervals and random starts
communicated to them by the regional managers.
9.5 Data Collection
Having identified the selected dwellings, data collection starts. Interviewers contact the households or
individuals living in those dwellings and, if possible, interview the eligible household members. When no
one eligible to be interviewed is home, the interviewer asks when he/she should call back; if no one at all
is there, he/she leaves a note saying that he/she will call again later. If someone is present but unable to
proceed with the interview, the interviewer attempts to arrange to do the interview within the next few
days, reiterating the importance of that person’s contribution to the survey. In the case that the
householder refuses the interview outright, the interviewer makes one more attempt at persuasion, but
then withdraws and brings the case to the attention of his/her supervisor, who is responsible for further
attempts at conversion to a complete response.
At the end of each day, the interviewer checks that all interview documents are complete, and that the
status of each interview is correctly entered on the control forms. Some field edits are applied and if any
errors are detected, the household is contacted the following day to resolve any inconsistencies or
omissions. Following their completion, the forms are returned to the office.
To ensure high-quality data collection, the supervisor observes a certain proportion of the interviews
conducted by each interviewer, particularly at the beginning of the data collection period. In addition,
members of the municipal office staff and of the GHS team from the BBS observe some interviews in
various areas of the district. Supervisors provide feedback to the interviewers so they can correct any
errors and improve their interviewing skills.
The GHS team also implements a reinterview program whereby a subsample of sampled units are
recontacted the week after data collection to verify critical information on the questionnaire. Any
discrepancies with the original information are clarified with the help of the respondent. The resulting
reinterview data will be used to estimate the extent of various types of nonsampling error (such as
coverage error, measurement error, nonresponse error or processing errors) in the data.
380.
SURVEY METHODS ANDPRACTICES
STATISTICS CANADA
368
The supervisors also check that the questionnaires have been completed properly and that the correct
status codes have been assigned. They must also ensure that all questionnaires and other forms are
accounted for and in order before being forwarded to the office for processing.
When interviewing is completed, the supervisor and municipal office staff debrief the interviewers to gain
valuable feedback both for processing the data and for revising the questionnaire and manuals for the next
round of the GHS.
Review questions:
Is it practical to hire such a large number of interviewers and supervisors to work for such a short period
of time each quarter? What would be the implications of using fewer teams, and spreading out the
interviewing over several weeks? (Consider aspects such as costs, data quality, and the other operations
associated with data collection such as listing and counting.)
Can you suggest any improvements to the draft letter to respondents, to help them understand how
important the survey is, and to reassure them that their answers will be kept confidential?
It was stated that data capture would be done at the district offices. Is this the most effective arrangement,
or would it be preferable to do the data capture at head office?
381.
CASE STUDY
STATISTICS CANADA
369
Chapter10 - Processing
10.0 Processing
After the questionnaires are returned to the sub-district or district branch offices, they are processed to
obtain a datafile so that tables may be produced and the survey results analysed. The steps to be carried
out at this stage of the survey include coding, data capture, editing and imputation, outlier detection and
treatment, and database creation. In addition, a variety of quality control and quality assurance procedures
are developed and put into effect.
10.1 Coding and Data Capture
The closed questions are pre-coded on the questionnaire, so that the data capture operators simply need to
key in the code numbers found beside the circles or boxes corresponding to the response. The open
questions dealing with quantities (respondent’s age in years, number of hours worked, wages, etc.) can
also be captured directly from the questionnaire.
On the other hand, the questionnaire contains several questions, such as type of work done, which have so
many possible answers that the categories and codes cannot be included on the questionnaire. In these
cases, the list of codes has been prepared and given to office personnel who write the appropriate code on
the questionnaire prior to data capture. For example, question JD6 asks the respondent in which industry
his/her employer conducts its principal economic activity. Therefore, a code list of economic sectors had
to be provided to the office staff to use to assign the most appropriate value to the response before data
capture.
There are also a few cases of ‘other, please specify’ questions that cannot be precoded. In these cases, the
GHS team has developed a preliminary list of the most likely topics that will appear in the responses and
assigned codes to them. A team member studies a number of questionnaires (perhaps about 100) to see if
any other topics appear often enough to warrant a code of their own. All responses that can be coded
using the revised list are. (Data capture personnel are instructed to key the actual response into a text field
for all responses that cannot be coded prior to data capture.) These cases are studied once the data have
been captured, and further attempts are made to develop a complete code list. Any cases that can still not
be coded will then be given a default code for ‘other’.
After coding is complete, batches of questionnaires are sent to the data capture operator who keys the
coded responses into the computer to create the preliminary datafile. This is done using data capture
screens prepared by the GHS team’s informatics support team.
Throughout the survey, from data collection to table production, the survey team implements a number of
procedures for quality control and quality assurance. A quality control program is put in place to verify a
percentage of the work of each data entry operator, and to re-check all his/her work if the number of
errors exceeds a predetermined limit. A similar procedure is used to verify coding. In both cases,
acceptance sampling is implemented, with each operator’s daily production being treated as a batch.
Feedback from the results of acceptance sampling are provided to each operator, and where necessary,
additional training is provided (or, if targets not reached, the operator released). The relevant indicators
are also shared with supervisors and survey managers.
382.
SURVEY METHODS ANDPRACTICES
STATISTICS CANADA
370
10.2 Editing
Editing began when the interviewers, and then their supervisors, groomed the questionnaires to check that
they were properly completed, and to see whether follow-up with the respondent was needed. Some
further grooming is done in the office prior to coding and data capture.
More editing occurs during data capture, since the capture screens were programmed to detect certain
errors at the time of keying. These edits include validity checks for out-of-range codes. For example,
keying of any value from 3 through 8 for sex of respondent causes the computer to ‘beep’ and wait for a
correction since that variable should only be coded as 1 for male, 2 for female or 9 for nonresponse.
The data capture programs also include consistency checks for invalid skip patterns. For example, in the
job description section, only self-employed workers are supposed to answer questions JD2-JD4. If the
person is not self-employed, questions JD2-JD4 should be skipped, and a code indicating inapplicability
(such as ‘8’) should be entered. If the data capture operator attempts to enter a response to one of these
questions for a person who is not self-employed, the data capture screen beeps so that the operator can
verify the data.
Once the data are in electronic format, more complete editing is done. As soon as the questionnaire was
finalised, the team began preparing edit rules to check for unreasonable combinations of codes for groups
of related questions (two, three or more questions). For example, a record would fail an edit rule, if the
wages seem too high or low given the number of hours worked. These edit rules are applied automatically
to the datafile. However, since the team has been warned of the dangers of over-editing and the need to
make only the minimum necessary changes to data provided by the respondent, edit failures will be
imputed only if the record has a significant impact on the estimate. For each question, therefore, special
‘flag’ fields are created to indicate whether the field failed an edit and whether it should enter into the
imputation system.
Because of the grooming and manual edit steps, very few records have so many remaining edit failures at
this stage that they will have to be declared unusable. Any such case is treated as a total nonresponse. As
in the case of refusals and other instances of total nonresponse at the data collection stage, these cases are
compensated for by adjustment to the survey weights.
10.3 Imputation
For useable questionnaire records, all fields failing an edit rule and all item nonresponses are analysed for
possible imputation. Depending on the type of question, the method of imputation varies.
For a few fields, there is redundancy in the questions that permits deterministic imputation. For example,
the section on household composition includes a field for total household size as well as the names, ages,
etc. of all household members. If, despite previous checking, there is still an inconsistency among these
fields, the total household size is flagged as being incorrect, and the value is imputed deterministically as
the number of persons named in the remaining fields.
On the other hand, if a respondent declares income from the sale of agricultural products but does not
provide an amount, the value is imputed by the random hot-deck method, using all other respondents in
the same stratum, having income from this activity, as potential donors. If there are no suitable donors,
the pool of potential donors is expanded to include all respondents in the same region.
383.
CASE STUDY
STATISTICS CANADA
371
Onceimputation has been completed, the datafiles may be again passed through the edit programs, to
ensure that the data are fully consistent. Imputation must be run again on the file, to eliminate the few
remaining records which fail the edit rules, and the file is then edited again to be sure of consistency.
At the same time, diagnostic indicators such as the number of cases imputed for each field, the type of
imputation used, the number of eligible donors and the frequency of their use, and other measures, are
recorded as input to the survey evaluation process. At the evaluation stage, these indicators will be used to
calculate edit failure rates and imputation rates for the key survey variables and those variables that
showed the greatest number of problems. The edit and imputation flags will also be maintained on the file
to aid in diagnosing the overall quality of the final database.
10.4 Outlier Detection and Treatment
Because of the nature of the questions, relatively few fields on the GHS datafile are outliers, that is
extreme or influential observations. However, there are several variables, such as earnings, and even
hours worked, for which extreme but possible values occur. For example, one person declared having
worked 96 hours last week, and indeed this could be true. Another respondent reported earning $75,000
last week and this too could be true, but would be a very rare case – especially since that same respondent
gave her occupation as elementary-school teacher. In this case, likely her true income was closer to
$750.00. Even if true, this response could have an undue influence on the survey estimates if, for some
reason, her household had an unusually high sampling weight (for example, due to nonresponse weight
adjustments).
To detect and deal with cases like the above, the GHS team developed systematic approaches to outlier
detection and treatment based on the sample quantiles (quartiles and median). They were unsure what to
use as the critical values, so they chose fairly low values (that is, likely to detect too many ‘outliers’). The
analysts then examine all the flagged values to get a better understanding of the data distributions, before
making any final decisions as to what cases should be defined as outliers and how they should be treated.
Using this experience, the team will then develop a more systematic approach to outlier detection and
treatment for the second round of the GHS.
10.5 Creating the Database
The last steps in processing are to create a flat file to serve as the basic survey datafile, and to compute the
weights and add them to the file. The GHS file then stores the file in a suitable format for the BBS’ main
statistical processing software (to speed up production of tables and other survey outputs).
Review questions:
It is stated above that questions with many possible answer categories needed to be coded manually
before data capture. Can you suggest another way of dealing with these cases? Would it likely be more or
less efficient than manual coding? Explain why.
Is it feasible to implement the suggested acceptance sampling for quality control of coding and data entry
as described above, given that the approximately 300 coders and data entry operators are scattered
across the various district offices? Can you suggest another approach to data processing and quality
control that would be more effective? What would be its disadvantages?
384.
SURVEY METHODS ANDPRACTICES
STATISTICS CANADA
372
Suggest other imputation approaches that could be used for the GHS.
What auxiliary variables should be considered in the creation of imputation classes?
385.
CASE STUDY
STATISTICS CANADA
373
Chapter11 - Data Analysis
11.0 Data Analysis
Having obtained a complete and clean database, the GHS team must analyse the data in order to provide
useful information to users to help them answer the questions that gave rise to the survey.
11.1 Summary Measures
The preliminary analysis is mainly descriptive including univariate frequency distributions, estimated
totals, averages and proportions for all the variables generated directly from the questionnaire, or derived
from them during processing. The estimates are accompanied by their estimated standard errors. There are
also a substantial number of cross-tabulations, many of them pre-planned but some developed as a result
of the preliminary data analysis. For example, as a result of the preliminary analysis, one analyst decided
to study the type of jobs that men and women are working in. An excerpt of his analysis follows:
What types of jobs are men and women working in?
There is a large difference in the occupation distributions for men and women. Despite a perceived
movement by women to management occupations and men to sales and service jobs, women and men
still retain traditional occupation structures:
i. Women are more likely than men to be working in: sales and service; business, finance and
administrative; social science, education, government service and religion; art, culture,
recreation and sport; and health jobs.
ii. Employed men, on the other hand, are more likely than women to be working in blue collar
and management and natural and applied science jobs.
Table 11.1a: Employment by Occupation and Sex
Distribution across
Occupations (%)
Occupation
Men Women
Management 11.9 8.6
Business, finance and administrative 9.5 26.9
Natural and applied sciences 8.6 2.4
Health 2.0 9.1
Social science, education, government service and religion 4.8 8.9
Art, culture, recreation and sport 2.4 3.2
Sales and service 19.6 31.5
Trades, transport and equipment operators 24.5 2.2
Primary industry 6.0 2.0
Processing, manufacturing and utilities 10.5 5.2
Total 100.0 100.0
386.
SURVEY METHODS ANDPRACTICES
STATISTICS CANADA
374
Table 11.1b: Employment by Occupation and Sex
Disribution across Men and
Women
Occupation
Men Women
Management 62.6 37.4
Business, finance and administrative 29.8 70.2
Natural and applied sciences 81.4 18.6
Health 20.7 79.3
Social science, education, government service and religion 39.5 60.5
Art, culture, recreation and sport 47.4 52.6
Sales and service 42.6 57.4
Trades, transport and equipment operators 93.0 7.0
Primary industry 78.1 21.9
Processing, manufacturing and utilities 70.7 29.3
Total 54.5 45.5
11.2 Testing Hypotheses About the Population
Although summary measures are necessary as a starting point for analysis, most users and analysts wish
to test certain hypotheses about the population. For example, one analyst wants to analyse the difference
in wages by sex for employees between 15 and 65. Her hypothesis is that men are paid more than women.
She initially examines the estimate of average hourly wages for both and notices a substantial difference –
$19 for men and $15 for women. In addition, by graphing the data, she can see that the distributions are
quite skewed – the median for men being $17 and the median for women being $13. For more
information see Figure 11.1.
Figure 11.1: Hourly Wages for Men (1) and Women (2)
1 2
0
20
40
60
80
w
a
g
e
s
sex
387.
CASE STUDY
STATISTICS CANADA
375
Theanalyst tests the null hypothesis that the mean wages for men and women are the same versus the
alternative hypothesis that they are different. She finds that at the 95% confidence level, they are
different.
However, after thinking about the relationship between sex and wages, the analyst wonders whether other
variables might also have an impact. She suspects that age, education, industry and occupation may also
be related to earnings. She decides to conduct an analysis of variance using wages as the outcome
variable but first she must decide how to handle some of the independent variables.
First, age is of the wrong data type to use in an analysis of variance; therefore, before she can run the
analysis of variance, she must first group the age variable. She decides to group the age variable into 10-
year age groups and create a derived variable on the database called age group which will contain the
value 1 for someone less than 25, 2 for someone between 25 and 34, etc.
Next, she must decide what to do with the industry and occupation variables. Both industry and
occupation are based on standard classification systems that consist of a 4-digit code. The first digit
indicates the broad industry or occupation group and each subsequent digit offers more detail. In total
there are thousands of groups for each coding system – too many to use in an analysis of variance. Also,
there are too few respondents in some groups to provide meaningful results. Also, the coding systems are
quite subjective and it is felt that the error rates are quite high at the 4-digit level. As a result of all these
issues, the analyst decides to truncate the codes to a single digit for analysis.
After creating the necessary derived variables, the analyst runs an analysis of variance using wages as the
dependent variable and age group, sex, education, industry and occupation as the independent variables.
The model turns out to be significant, meaning it explains a significant amount of the variation in wages
and each of the independent variables also turns out to be significant contributors to the variation of
wages.
However, the analyst suspects that there may be some interaction between independent variables. For
example, what if the effect that sex has on wages depends on the age of the person? In order to examine
this issue, the analyst decides to add all the interaction effect into the model to examine their effect on
wages. She finds that all the interaction effects are significant except for age group by industry. This
means that, not only do wages depend on age group, sex, education, industry and occupation but wages
also depend on most combinations of these variables.
The analyst realises that this is a very complicated issue and it deserves much more research.
11.3 Other Analysis
In addition, to the analysis already done, the GHS analysts wish to analyse certain characteristics over
time and to eventually do seasonal adjustments once enough data are available.
Review questions:
What type of data are the variables age and age group?
What other variables could be used in an analysis of variance?
What other types of analyses would you suggest?
388.
E L EC T R O N I C P U B L I C A T I O N S
A V A I L A B L E A T
www.statcan.gc.ca
389.
CASE STUDY
STATISTICS CANADA
377
Chapter12 - Data Dissemination
12.0 Data Dissemination
Having analysed the data, the GHS team must now report the results to users to help them answer the
questions that gave rise to the survey. At the same time, the team will evaluate the data in terms of the
survey’s objectives.
12.1 Main Survey Report
The body of the report begins with an introduction giving a brief description of the GHS’s objectives, the
various organisations involved in its design and execution, the principal expected users, and an overview
of the methodology adopted.
The bulk of the main survey report consists of the pre-planned tables derived directly from the database of
questionnaire responses. In order for these tables to be most useful for the users, however, the team
prepares a textual report summarising the most important results with discussion of their meaning in
terms of the survey’s original objectives, and commentary on the data’s strengths and weaknesses. The
text of the report includes a number of graphs and tables to illustrate the main points. This report also
includes comments on points other than the data in the main database; for example, it mentions particular
problems encountered during the fieldwork, or items requiring unusually high rates of imputation.
Mention is also made of other planned reports to be released at a later date (Section 12.3).
The last main section of the report draws conclusions about the overall labour market situation in
Belleterre and includes recommendations for further study of several key points not covered thoroughly in
this first GHS round.
The tables in the appendices present the univariate frequency distributions as well as the relevant
estimated totals, averages and proportions for all the variables generated directly from the questionnaire,
or derived from them during processing. The estimates are accompanied by their estimated standard
errors.
12.2 Data Quality Report
The GHS project team is also in the process of producing a comprehensive report on the quality of the
data from the first survey round, to help with survey development for subsequent years. The report will
include measures of sampling variability such as coefficients of variation or design effects. It will also
include vacancy rates, response rates (both total and item) and many of the measures and indices
generated by the quality control steps put in place for coding, data capture and other survey phases. It will
also describe the editing and imputation process and discuss the imputation rates and any other problems
found in the data during this process. Finally, it will comment on the advisability of comparing GHS
results with other available data sources, emphasising the comparability or differences in the concepts and
measurement tools used and whether any calibration to more reliable source has been used for some of
the data.
The following is a list of some of the values examined in the report:
- coefficients of variation by region;
390.
SURVEY METHODS ANDPRACTICES
STATISTICS CANADA
378
- design effects by region;
- vacancy rates by urban/rural;
- nonresponse rates by region and urban/rural within region;
- nonresponse rates by type of nonresponse;
- data used for poststratification;
- edit failure rates by question;
- imputation rates by question;
- coding error rates;
- data capture error rates;
- average number of contacts to finalise a response case;
- average number of contacts to finalise a nonresponse case;
- average interview time for response cases.
12.3 Other Reports
The GHS team will likely produce several additional reports including:
i. Survey Evaluation Report. It will provide the team’s recommendations for improvements to the
survey process so that the next GHS round will function even more smoothly and efficiently.
ii. Detailed Analysis Reports. The GHS team plans to produce a series of analytical reports to be
written in collaboration with various user agencies.
iii. Technical Reports. These reports will provide details on the survey methodology, sampling plan,
estimation method, data collection and processing procedures, etc.
12.4 Confidentiality and Disclosure Control
As far as the final survey results are concerned, disclosure control is an important issue. Since there will
be no public-use microdatafiles, disclosure control focuses on the published tables and other summary
measures. (However, the BBS will likely grant microdata access to certain authorised analysts after they
have been sworn in as if they were BBS employees. They would then be subject to all the penalties for
breach of confidentiality.)
With respect to the data published in the main survey report, the team is studying the available restriction-
based methods for tabular data. Much of the GHS data are categorical, but some variables are continuous,
and therefore harder to deal with. Several methods are under study, but no conclusion has yet been
reached as to which will be adopted. However, since one of the main purposes of the first GHS round is to
obtain improved information for fine-tuning the ongoing GHS, the general strategy adopted is to be very
conservative. Thus, the team is willing to suppress too much information if necessary, while doing
detailed evaluations of the data quality and disclosure risk for subsequent implementation of disclosure
rules that will maximise the amount of publishable information in the future.
For this reason, the team has established a preliminary cut-off rule that there must be a minimum of ten
respondents in any cell of a table before it is published. This, together with the associated residual
suppression, is felt to be sufficient for most cases, and probably quite conservative overall. When
possible, the team prefers to collapse sensitive cells with neighbouring cells, rather than simply
391.
CASE STUDY
STATISTICS CANADA
379
suppressingthem, as this will help to minimise the otherwise large amounts of complementary cell
suppression.
Review questions:
Should the main survey report be made available to the general public, as part of the BBS’ regular series
of publications, or should the report on this first round be restricted to BBS personnel and the known data
users in other ministries?
Recommend other possible disclosure control methods that could be considered for the GHS.
392.
SURVEY METHODS ANDPRACTICES
STATISTICS CANADA
380
Chapter 13 - Survey Planning and Management
Belleterre’s General Household Survey (GHS)
Project Manager’s Personal Evaluation of Planning and Management Practices
13.0 Introduction
The goal of this report is to describe and evaluate the planning and management practices used to conduct
Belleterre’s General Household Survey (GHS) in order to learn from the experience. These are personal
notes that will not be circulated to the project team or the Steering Committee. As project manager, I will
however, include some of the points that are covered in this report in the official survey evaluation report
so that the questionnaire and procedures can be improved for the next round of the GHS.
13.1 Background
The Belleterre Bureau of Statistics (BBS), fully aware of the increasingly urgent need for up-to-date
information on the state of the economy and the socio-economic situation of its population, has begun
efforts to modernise its statistical program. In particular, the BBS recognises the need to obtain relevant
data on the situation of households in both the urban and the rural areas of the country.
Support was received from the national government to proceed with a proposal for a survey on the socio-
economic conditions of households in the urban and rural areas of the country. Broad topics to be covered
by the survey were socio-demographic characteristics, labour market activity, income and expenditure
patterns, as well as indicators of living conditions. A number of important national ministries requested
that additional information be collected by the GHS on the population’s health status, household
agricultural activities in both rural and urban areas and small business.
In the context of these objectives, a Steering Committee was appointed to oversee the management of the
survey. The Steering Committee was composed of directors representing the fields of labour and
household statistics, methodology, informatics, and data collection. The goal of the Steering Committee
was to represent the information needs of the BBS as well as to approve important decisions such as the
statement of objectives, budget, schedule, etc.
One of the first steps in the planning process was the identification of an information gap and the
preparation of a survey proposal. An interim project manager was appointed who provided initial
information on alternatives to a survey (e.g., data available from another survey or administrative source),
and on cost and feasibility of a survey. This preliminary examination was based on consultation with
experts from the various disciplines that were expected to be involved in the survey team (although these
experts were not, in the end, members of the actual survey team). As a result of the survey proposal, the
Steering Committee decided to proceed with more substantive development towards a statement of
objectives and a survey plan.
13.2 Planning the GHS
The next decision made by the Steering Committee was my appointment as the project manager of the
GHS. I was provided with the broad objectives of the survey and with contact names for the external
393.
CASE STUDY
STATISTICS CANADA
381
agenciesinterested in information (e.g., the Ministry of Health). Finally, I was told to form a project team
and quickly develop a rough statement of objectives and survey plan.
The formation of the project team was an important consideration. Like any manager, my goal was to find
experienced people with whom I had worked successfully on previous occasions. I contacted the director
of the methodology division to request the services of Mr. X who had served as the methodologist on a
previous project team that I had managed. I was informed, not only that Mr. X had left the BBS, but that
due to the changing market conditions, the division was understaffed and was particularly lacking in
experienced personnel. I was assigned a methodologist (Mr. M) who had only a few years experience.
However, I was assured that all decisions made by the methodologist would be reviewed by his
supervisor. I had more success recruiting the other members of the team:
- a subject matter co-ordinator (Ms. S) and a team of subject matter experts in the fields of economics,
labour statistics, etc.;
- a computer systems expert (Mr. P) who was said to be an extremely capable programmer;
- a data collection and operations officer (Ms. D) with whom I had worked before.
Once established, the survey team began to develop the statement of objectives and to confirm feasibility
of the survey. The first project team meeting was convened, the goal being to introduce the members of
the project team to each other, explain the roles of the team members, the reporting structure and to
discuss the goals of the project. For the benefit of the inexperienced members of the project team, I made
it clear that it was expected that their work would be reviewed by their line supervisors.
The goal of the second project team meeting was to begin work on the statement of objectives. After
some discussion, it became clear to me that detailed information could not be collected on so many
diverse topics in one survey. To do so, would place too much of a burden on respondents and possibly
compromise the quality of the data. I returned to the Steering Committee with the suggestion that they
consider scaling back the scope of the survey and/or conduct a formal feasibility study to test the
collection procedures before proceeding with a full-scale survey. I was told they would consider my
suggestions.
Meanwhile, the team began to identify the specific information needs of the various users. I contacted the
Ministry of Health, the Ministry of Agriculture and the economic ministries that had requested
information to define their information needs. In addition, I began refining the draft budget and schedule
that had been prepared for the survey proposal. Using my previous experience, and after consulting with
various members of the project team, I estimated the resource requirements to plan, develop, implement
and evaluate the survey. The estimated resource requirements were quite high given the scope of the
survey. However, since the survey was to be ongoing, the costs of planning and development could be
thought of as being spread over several years (even though the resources would be spent up-front). Only
the costs of survey implementation and evaluation (and occasional redesigns) would occur regularly. I
met again with the interested ministries to inform them of the estimated costs. Given the high start-up
costs, the ministries’ enthusiasm for the project was much more subdued than in previous meetings.
On behalf of the project team, I met with the Steering Committee again to present the draft budget,
schedule (Table 13.1) and statement of objectives. The Steering Committee decided that planning should
continue only on the four core themes and the other interested ministries could be approached again after
the first cycle of the survey. Even though the budget, schedule and statement of objectives were only in
rough draft form, the Steering Committee approved the budget and gave its formal approval to design and
develop the survey.
Having been through the planning process on numerous occasions, I knew that substantial work was still
needed on the statement of objectives (as well as the budget and schedule) before beginning the design of
394.
SURVEY METHODS ANDPRACTICES
STATISTICS CANADA
382
the actual survey. Therefore, the project team continued to develop the statement of objectives. I met with
the interested ministries to inform them that the GHS would be narrowing its focus during the first cycle,
but that in subsequent years, they would be invited to propose additions to the survey.
Shortly thereafter, the Steering Committee informed the project team that the budget had been cut in half
and that the team should focus its efforts on one of the core themes while preparing a survey
infrastructure that could be readily expanded in the second year. The Steering Committee and the project
team considered what had been learned to date and decided to concentrate on the labour market
component, leaving aside the remainder of the list of subjects until the following year. Although this
announcement was initially disappointing to the project team members (especially those who had worked
on the themes that were cut), they quickly came to realise that, in the long run, this was for the best. It
would allow time to concentrate effort on producing a quality product to collect quality data. The
statement of objectives was quickly finalised and submitted to the Steering Committee for approval.
The project team then began writing a draft planning report to present and discuss options for the frame,
sample design, data collection, processing, analysis, dissemination, etc. This planning report was
presented to the Steering Committee and the project team requested advice on several issues, including
defining the target and survey populations, what sampling frame to use, collection methodologies, etc.
Little substantive advice was provided by the Steering Committee and, for the most part, the project team
was told to make these decisions.
13.3 Design and Development
Once the major decisions had been made, each team member began preparing component plans
associated with his/her responsibility within the team.
i. Subject matter
Having developed the concepts and definitions for the Statement of Objectives, Ms. S began developing
the questionnaire. Ms. S, supervising a group of new recruits, understandably wanted them to experience
the project team environment. Her subject matter team, having no previous survey experience, were
enthusiastic although sometimes unrealistic in their expectations. Many project team meetings were spent
(and substantial time was wasted) discussing proposals brought forth by the junior members of the subject
matter team. A more effective procedure would have been for the subject matter team to discuss the
proposals among themselves, come to a consensus on their preferred option and present that to the project
team. Ultimately, I did suggest this procedure and the questionnaire design, and subsequent steps,
proceeded much more smoothly and quickly.
ii. Methodology
The survey methodologist, although inexperienced, completed his work quickly and effectively. The
methodologist was also responsible for the design of the quality control systems for data capture and
coding. Initially, Mr. M was quite inflexible in compromising on the amount of quality control inspection
to be done. He insisted that the outgoing error rates for both data capture and coding be almost 0%.
However after several discussions, I was able to convince him that a compromise between cost and
quality was necessary.
395.
CASE STUDY
STATISTICS CANADA
383
iii.Programming
Even though the systems analyst received all specifications on time, the systems were not ready to go to
testing on time. I am still unclear as to the exact problem. I believe that the programmer was overloaded
with other work and was unable to effectively manage his time. This had major consequences on the
implementation phase (discussed in the next section).
iv. Data collection and operations
The data collection and operations officer effectively managed the recruitment, training, monitoring and
control of data collection staff such as interviewers and supervisors, as well as data capture and coding
staff. All manuals were produced on time and were of high quality. The data collection and operations
officer visited several of the regional statistical offices to observe recruitment and training.
During the design and development phase of the survey, project team meetings were held less frequently
to allow more time for the project team members to work on their component plans and to review the
plans of other team members. The Steering Committee was informed of all decisions made by the project
team. However, we rarely received feedback.
13.4 Implementation
During implementation, the focus shifted from deciding what to do to doing it. The questionnaire was
printed, the sample was selected, training was conducted in the regions, clusters were listed and
interviewing took place. Once the data returned, they were captured, coded, edited and imputed.
Estimation and analysis followed. The frequency of project team meetings was increased again in order to
deal with any problems arising during implementation.
Several problems occurred during the implementation stage.
i. The achieved response rate was lower than expected. The planned response rate was 80% but the
achieved rate was only 68%. This caused two concerns.
a. First, the higher level of nonresponse could introduce bias into the survey results. To examine
this issue, a nonresponse follow-up study is planned to examine the characteristics of
nonrespondents compared to respondents. This study will be used to plan nonresponse
follow-up procedures for subsequent survey occasions.
b. Secondly, the precision of regional estimates was less than targeted during the sample size
determination. Therefore, it was necessary to recalculate the achievable precision, given the
response rate and present this to the Steering Committee and the users. It was decided that
more resources would be put into nonresponse follow-up and refusal conversion in an attempt
to increase the response rate, and, where necessary, data would be published at a more
aggregate level.
ii. As a result of the late delivery of the computer applications (mentioned above), specifically that
for data capture, a group of clerical staff sat idle while the project team tested the computer
programs. I must admit that, because I was aware of the clerks sitting idle (yet being paid), I
placed pressure on the project team to cut corners during the application testing. Unfortunately, as
a result, the application still contained errors when it was finally implemented. The resulting
396.
SURVEY METHODS ANDPRACTICES
STATISTICS CANADA
384
delays and shutdowns caused by critical program errors likely cost more time and money than if
we had spent sufficient time testing the program before its implementation.
iii. It became evident from review of the comments in the ‘Other (specify)’ portion of Question E3
that either respondents or interviewers did not understand the answer categories. Since these
comments were reviewed during collection, it was possible to send instructions to the
interviewers to clarify the question and answer categories so that the data collected from that
point forward would be correct. For the questionnaires already received, the data for the question
were reviewed by the subject matter experts and recoded when necessary.
13.5 Evaluation
In evaluating the planning and management of the GHS survey, I have several observations:
i. It became evident early on that the Steering Committee was not involved enough in the decision
making process. They seemed content to allow the project team to make all the decisions, even
those having far-reaching consequences. I should have expressed my concern in this regard to the
Steering Committee. Instead, I took those decisions back to the project team, some of whom were
too inexperienced to provide useful input.
ii. In retrospect, there are several things that I could have done to remedy the situation involving the
late delivery of the data capture system. I should have more closely monitored the schedule in
order to identify earlier that there was a problem. Once I realised that there was a problem, I
should have taken action immediately to replace the programmer or acquire additional
programming resources. At the time, I was reluctant to do so because I believed it would waste
too much additional time to familiarise a new programmer with the specifications and the existing
programs. Also, I should have allowed sufficient time for proper testing.
iii. The original schedule was too strict – more time should have been allowed between deliverables
to avoid problems. Given the inexperience and heavy workload of several project team members,
I should have created a more conservative schedule. Alternatively, I could have left the schedule
constant and instead increased the number of persons working on certain key tasks, notably
programming.
iv. Nonresponse is an issue that must be dealt with in the GHS. For the current GHS survey, the
potential for nonresponse bias (particularly for certain subgroups of the population) should be
assessed. For subsequent implementations of the GHS, I would recommend that improved
nonresponse follow-up procedures be implemented to ensure a high response rate. Currently, only
very aggregate information is available to the users. The data would be much more useful if they
could be provided at a more detailed level.
v. There were a large number of temporary dwellings occupied by recent migrants. These may cause
some problems if the same dwellings are to be included in more than one phase of the survey.
397.
CASE STUDY
STATISTICS CANADA
385
Table13.1: GHS Schedule
Milestones Responsible Start Date End Date
Statement of Objectives Management, Subject Matter January 1 January 31
Survey Plan All February 1 February 28
Budget Management January 1 January 31
Questionnaire Design Subject Matter March 1 March 31
Analysis Plan Subject Matter April 1 April 30
Specifications – Sample Design Methodology March 1 April 30
Specifications – Data Collection Method Data Collection March 1 March 31
Specifications – Edit and Imputation Methodology, Subject Matter April 1 April 30
Specifications – Quality Control Methodology May 1 May 31
Specifications – Data Capture Data Collection April 1 April 30
Specifications – Estimation, Variance Methodology June 1 June 30
Computer System Development Programming June 1 August 15
Computer System Testing All July 15 August 31
Field Manuals Data Collection June 1 July 31
Public Relations Management, Data Collection August 1 August 31
Interviewer training Data Collection August 15 August 31
Listing Data Collection September 1 September 12
Data Collection Data Collection September 15 September 30
Training – Coding Data Collection September 26 September 30
Coding Data Collection October 1 October 14
Training – Data Capture Data Collection October 10 October 14
Data Capture Data Collection October 15 October 31
Editing and Imputation Data Collection November 1 November 14
Estimation Methodology, Subject Matter November 15 November 30
Analysis Subject Matter December 1 December 14
Data Quality Evaluation Methodology, Subject Matter December 1 December 25
Disclosure Control Methodology December 15 December 25
Dissemination Management, Subject Matter December 31 December 31
Documentation All January 1 December 31
398.
E L EC T R O N I C P U B L I C A T I O N S
A V A I L A B L E A T
www.statcan.gc.ca
399.
STATISTICS CANADA
387
Index
- acceptancecontrol: see quality – quality control – acceptance control
- acceptance sampling: see quality – quality control – statistical product control –
acceptance sampling
- accuracy: see estimator – accurate estimator
- administrative data: 4.3.3 and Appendix A; see also data collection- other methods of
data collection – administrative data
o sources of administrative data: Appendix A
o usefulness of administrative data: Appendix A
o uses of administrative data: Appendix A
- analysis of variance (ANOVA): see data analysis – hypothesis testing for continuous
variables – simple survey data – testing many means- ANOVA
- area frame: see frames (survey frame/ sampling frame) – area frame
- bias: see also estimator – unbiased estimator; see also estimation – estimating the
sampling variance – estimating confidence intervals – in the presence of bias.
- bootstrap: see estimation –estimating the sampling variance - estimating variance using
replicated sampling / jackknife / bootstrap
- calibration and generalised regression: see weights – using auxiliary information to
adjust weights – calibration and generalised regression
- CAPI/CASI/CATI: see data collection – computer assisted.
- census: see sample design - sample versus census
- chi-square test statistic: 11.4.1; 11.5.1.1; 11.5.1.2; 11.5.1.3; 11.5.2. See also data
analysis - hypothesis testing for discrete/categorical variables.
- cluster sampling: see sample design – probability sampling – cluster sampling
- coding: see processing – coding
- coefficient of variation (CV): See estimation - estimating a coefficient of variation (CV)
- confidentiality: see data dissemination – disclosure control; see also data dissemination
- other confidentiality considerations; see also 5.1.3; 5.5.1; 9.2.2; 9.3.1.1; 9.4; 9.4.2.
- contingency tables: see data analysis – hypothesis testing for discrete/categorical
variables – testing for independence
- control charts: see quality - quality control - statistical process control - control charts
400.
SURVEY METHODS ANDPRACTICES
STATISTICS CANADA
388
- data analysis: 1.1.9, 11.0 and Chapter 11. See also estimation.
o summary measures: 11.3
simple survey data: 11.3.1
• estimation and presentation of frequency distributions:
11.3.1.1
o charts and diagrams: 11.3.1.1.1. See also data
dissemination – tables/charts.
• location (mean, median, mode, quartiles, percentiles):
11.3.1.2
• spread (population and sampling variance, range,
interquartile range): 11.3.1.3. See also estimation – estimating
the population variance and estimation – estimating the
sampling variance.
complex survey data: 11.3.2
• median: 11.3.2.1
• spread (population and sampling variance, range,
interquartile range): 11.3.2.2
o hypothesis testing for continuous variables:11.4
simple survey data: 11.4.2
• testing for a single mean: 11.4.2.1
• testing for two means: 11.4.2.2
• testing many means: 11.4.2.3
o linear regression: 11.4.2.3; 11.4.2.3.2
o analysis of variance (ANOVA): 11.4.2.3.1
complex survey data: 11.4.3
• testing for a single mean: 11.4.3.1
• testing many means (adapting the ANOVA and regression):
11.4.3.2
o hypothesis testing for discrete/categorical variables: 11.5
simple survey data: 11.5.1
• testing for independence/contingency tables: 11.5.1.1
• testing for homogeneity: 11.5.1.2
• log-linear models: 11.5.1.3.
complex data: 11.5.2
• tests of independence and tests of homogeneity: 11.5.2
o data analysis report: see data dissemination – data analysis report
- data capture: see processing – data capture
- data collection: 1.1.5; 4.0
o self-enumeration: 4.1; 4.1.1
o interviewer-assisted: 4.1; 4.1.2
personal interviews: 4.1; 4.1.2.1
telephone interviews: 4.1; 4.1.2.2
o choosing between self-enumeration versus interviewer-assisted: 4.1.3
o other methods of data collection:
administrative data: 4.3.3 see also Administrative data
combined methods: 4.3.4
direct observation: 4.3.1
electronic data reporting (EDR): 4.3.2
401.
INDEX
STATISTICS CANADA
389
supplementary oromnibus surveys: 4.3.5
o paper-based: 4.1
paper and pencil interviewing (PAPI): 4.1
o computer-assisted: 4.1; 4.2
computer-assisted personal interviewing (CAPI): 4.1
computer-assisted self-interviewing (CASI): 4.1
computer-assisted telephone interviewing (CATI): 4.1
o comparison of data collection methods: Table 2 in Chapter 4.
o data collection operations: Chapter 9
organisation of data collection: 9.1
public relations: 9.2
respondent relations: 9.2.2
preparation of data collection procedures: 9.3
• hiring and training interviewers: 9.3.2
• interviewers’ manual: 9.3.1.1
• listing: 9.3.3; see also survey frame – area frame.
• supervisors’ manual: 9.3.1.2
• tracing: 9.3.4
conducting interviews: 9.4
• preparing and scheduling interviews: 9.4.1
• introductory techniques: 9.4.2
• using the questionnaire: 9.4.3; see also questionnaire.
• probing: 9.4.4
• ending the interview: 9.4.5
• refusals and other delicate situations: 9.4.6
• proxy interviewing: 9.4.7
• keys to effective interviewing: 9.4.8
monitoring the quality of data collection: 9.5.1; see also quality.
• interviewer assignment management: 9.5.2
• monitoring by supervisors: 9.5.3
- data dissemination: 1.1.10; 12.1 and Chapter 12.
o main survey report: 12.2
guidelines for writing: 12.2.1
o tables/charts: 12.2.2; 12.2.3; see also data analysis - summary measures - simple
survey data - estimation and presentation of frequency distributions - charts and
diagrams.
o data analysis report: 12.3
o data quality report: 12.4
o disclosure control: 1.1.10; 12.5.1
protection of tabular data: 12.5.2.1
• identifying sensitive cells (cut-off rules / the (n,k) rule / the p-
percentage rule): 12.5.2.1
• handling sensitive cells (data reduction / data perturbation):
12.5.2.1
protection of public-use microdata files: 12.5.2.2
• identifying sensitive records: 12.5.2.2
• handling sensitive records (data reduction / data
perturbation): 12.5.2.2
o other confidentiality considerations: 12.5.3; see also confidentiality.
402.
SURVEY METHODS ANDPRACTICES
STATISTICS CANADA
390
- design effect (deff): see estimation –estimating the sampling variance – estimating
design effect.
- disclosure control: see data dissemination – disclosure control
- documentation: 1.1.11; see also data dissemination
- double sampling / two-phase sampling: see sample design – probability sampling –
multi-phase sampling.
- dwelling: 2.1.3
- editing: see processing – editing
- errors in a survey:
o sampling error: 3.1; see also estimation – sampling variance.
o nonsampling errors: 3.1
systematic versus random: 3.4.2
coverage: 3.4.2.1
measurement / response error: 3.4.2.2; 5.4
• sources of response error: 5.4.1
• techniques to reduce response error: 5.4.2
nonresponse: 3.4.2.3
processing: 3.4.2.4
- estimation: 1.1.8; 7.0; see also weights
o estimating a population total: 7.2.1
o estimating a population average: 7.2.1
o estimating a population proportion: 7.2.1
o estimating the population variance: 7.3.1; 7.3.1.1; 7.3.2.3
o estimating the sampling variance: 3.4.1; 7.3.1; 7.3.2.3; 7.3.2.4; 7.3.4; see also
estimator – precise estimator; see also sample size determination; see also
processing – imputation – variance estimation for imputed data; see also data
analysis.
estimating a coefficient of variation (CV): 7.3.2.1; 7.3.2.3
estimating confidence intervals: 7.3.2.2; 7.3.2.3
• in the presence of bias: 11.3.2.2.1
estimating design effect (deff): 7.3.3, Chapter 8 and 11.5.2; see also
statistical efficiency.
estimating margin of error: 7.3.2.2; 7.3.2.3 and Chapter 8.
estimating standard error: 7.3.2.1; 7.3.2.3; 7.3.2.4
estimating variance using replicated sampling / jackknife /
bootstrap: 7.3.4
factors affecting precision: 3.4.1; 8.1.2; see also sample size
determination
o estimation examples for SRS: estimating the population mean and its sampling
variance, standard error, CV, margin of error, confidence interval: 7.3.2.3
o estimation examples for stratified SRS: estimating the population mean and its
sampling variance, standard error: 7.3.2.4
o estimation example for replicated sampling: estimating the population mean
and its sampling variance, standard error: 7.3.4
403.
INDEX
STATISTICS CANADA
391
o forsmall domains: 7.2.3.1
- estimator: 6.2.1; 11.1; see also estimation.
o accurate estimator: 6.2.1
o precise estimator: 6.2.1; see also estimation – estimating the sampling variance.
o robust estimators: see processing – outliers – robust estimators
o sampling distribution of an estimator: 6.2.1; 11.1.
o unbiased estimator: 6.2.1; see also bias.
- family: 2.1.3
- focus group: see questionnaire – testing the questionnaire – focus groups
- frames (survey frame/ sampling frame): 3.3
o area frame: 3.3.1.2; see also data collection operations – preparation of data
collection procedures – listing.
o list frame: 3.3.1.1
o multiple frame: 3.3.1.3
o frame defects: 3.3.2
o qualities of a good frame: 3.3.3
- household: 2.1.3
- hypothesis testing: see data analysis
- imputation: see processing – imputation
- inference: see data analysis – hypothesis testing.
- interviewer-assisted: see data collection – data collection operations - interviewer-
assisted.
- interviewing: see data collection – data collection operations - conducting interviews.
- jackknife: see estimation – estimating the sampling variance - estimating variance using
replicated sampling / jackknife / bootstrap
- life cycle of a survey: 1.2
o survey planning: see planning and management of a survey
o design and development:1.2.2
o implementation: 1.2.3
o survey evaluation: 1.2.4
- linear regression: see data analysis – hypothesis testing for continuous variables –
simple survey data – testing many means- linear regression
- list frame: see frames (survey frame/ sampling frame) – list frame
- listing: see data collection – data collection operations – preparation of data collection
procedures - listing
404.
SURVEY METHODS ANDPRACTICES
STATISTICS CANADA
392
- log-linear models: see data analysis – hypothesis testing for discrete/categorical
variables – log-linear models.
- longitudinal surveys: see sample design – probability sampling – repeated surveys/
longitudinal surveys
- mean square error (MSE): see estimation – estimating the sampling variance –
estimating confidence intervals – in the presence of bias.
- multi-phase sampling: see sample design – probability sampling – multi-phase sampling
- multiple frame: see frames (survey frame/ sampling frame) – multiple frame
- multi-stage sampling: see sample design – probability sampling – multi-stage sampling
- Neyman allocation: see sample allocation for Stratified SRS designs – disproportional
allocation – Neyman
- (n,k) rule: see data dissemination – disclosure control – identifying sensitive cells.
- non-probability sampling: see sample design – non-probability sampling
- non-sampling errors: see errors in a survey – non-sampling errors
- objectives of a survey
o formulation of the Statement of Objectives: Chapter 2
information needs
users and uses of the data
main concepts and operational definitions
survey content
analysis plan
- optimum allocation: see sample allocation for Stratified SRS designs – disproportional
allocation – Optimum
- outliers: see processing – outliers
- parameter: 6.2.1; 11.1; see also estimator
- planning and management of a survey: 1.2.1; Chapter 13
o approaches to survey planning: 13.1
o survey planning / stages of survey planning: 13.2
o estimating costs, resource and time requirements: 13.2.2
o management of a survey (organize/direct/monitor, control/communicate, co-
ordinate and review): 13.3
o role of the survey manager: 13.3.1
o why things go wrong: 13.3.2
o planning checklist: Chapter 13
o cost checklist: Chapter 13
405.
INDEX
STATISTICS CANADA
393
- population:
otarget versus survey: 3.2
- post-stratification: see weights – using auxiliary information to adjust weights – post-
stratification
- power allocation: see sample allocation for Stratified SRS designs – disproportional
allocation – power allocation
- p-percentage rule: see data dissemination – disclosure control – identifying sensitive
cells
- precision: see estimator – precise estimator
- probability-proportional-to-size sampling (PPS): see sample design – probability
sampling – probability-proportional-to-size (PPS)
- probability sampling: see sample design – probability sampling
- processing: 3.4.2.4; 10.0; Chapter 10; see also questionnaire – processing considerations
o coding: 1.1.6; 3.4.2.4;10.1
closed questions: 10.1.1; see also questionnaire – types of questions –
closed questions
open questions: 10.1.2; 10.1.3; see also questionnaire – types of
questions – open questions
o data capture: 1.1.5; 3.4.2.4; 10.2
o editing: 1.1.7; 3.4.2.4; 10.3
edits during data collection: 10.3.1
edits after data collection: 10.3.2
selective editing: 10.3.3
constraints to editing: 10.3.5
guidelines for editing: 10.3.6
o imputation: 1.1.7; 3.4.2.4; 10.4
deductive imputation: 10.4.1.1
mean value imputation: 10.4.1.2
ratio/regression imputation: 10.4.1.3
hot-deck imputation: 10.4.1.4
cold-deck imputation: 10.4.1.5
nearest-neighbour imputation: 10.4.1.6
deterministic imputation with random residuals: 10.4.1.7
determining which values to impute: 10.4.2
donor imputation issues: 10.4.3
variance estimation for imputed data: 10.4.4; see also estimation –
estimating the sampling variance
guidelines for imputation: 10.4.5
evaluation of imputation procedures: 10.4.6
o outliers: 7.2.3.2; 10.5
identification of outliers: 10.5.1
treatment of outliers: 10.5.2
robust estimators: 10.5.2
406.
SURVEY METHODS ANDPRACTICES
STATISTICS CANADA
394
- proportional allocation/ N-proportional allocation: see sample allocation for Stratified
SRS designs – proportional allocation (N-Proportional)
- quality: Appendix B
o quality assurance: Appendix B, 3.0
o quality control: Appendix B
statistical product control: Appendix B 2.1; 2.3
• acceptance sampling: Appendix B 2.1.1
statistical process control: Appendix B 2.2; 2.3
• control charts: Appendix B 2.2.1
acceptance control: Appendix B 2.4
- questionnaire: 1.1.4; 5.0; see also data collection procedures – conducting interviews –
using the questionnaire
o questionnaire design process: 5.1
o testing the questionnaire: 5.1.5
informal testing (pretesting): 5.1.5.1
cognitive methods: 5.1.5.2
focus groups: 5.1.5.3
interviewer debriefings: 5.1.5.4
behaviour coding of interviewer/respondent interactions: 5.1.5.5
split sample tests: 5.1.5.6
pilot test: 5.1.5.7
o types of questions
open questions: 5.2; see also processing – coding – open questions
closed questions: 5.2; see also processing – coding – closed questions
• two-choice questions: 5.2.1
• multiple-choice and checklist questions: 5.2.2
• rating questions: 5.2.4
• ranking questions: 5.2.3
o guidelines for wording survey questions: 5.3
o response error: see measurement error
o questionnaire layout: 5.5
o processing considerations: 5.6
- quota sampling: see sample design – non-probability sampling – quota sampling
- random digit dialling (RDD): see telephone sampling - random digit dialling (RDD)
- ratio estimation: see weights – using auxiliary information to adjust weights – ratio
estimation
- replicated sampling: see sample design – probability sampling – replicated sampling
- robust estimators: see processing – outliers – robust estimators
- sample allocation for stratified SRS designs:
o fixed sample size: 8.2.1.1
o fixed coefficient of variation (CV): 8.2.1.2
o proportional allocation (N- proportional): 8.2.2.1; 8.2.2.2.2
407.
INDEX
STATISTICS CANADA
395
o disproportionalallocation: 8.2.2.2
N - proportional: 8.2.2.2.2
Neyman: 8.2.2.2.5
optimum: 8.2.2.2.4
optimum when variances are equal: 8.2.2.2.6
power allocation: 8.2.2.2.3
Y-proportional: definition 8.2.2.2.1
Y - proportional: 8.2.2.2.3
o special considerations during allocation: 8.2.3
- sample design: 1.1.3; Chapter 6
o sample versus census: 1.1.3; 3.1.
o probability versus non-probability sampling: 1.1.3
o non-probability sampling: 6.1
haphazard: 6.1.1
judgement sampling: 6.1.3
modified probability sampling: 6.1.5
volunteer sampling: 6.1.2
quota sampling: 6.1.4
snowball sampling/ network sampling: 6.3.3
o probability sampling: 6.2
cluster sampling: 6.2.5
entry/exit surveys: 6.3.2
multi-phase sampling: 6.2.8
multi-stage sampling: 6.2.7
probability-proportional-to-size (PPS): 6.2.4
repeated surveys/ longitudinal surveys: 6.3.1
replicated sampling: 6.2.9; see also estimation - estimation example for
replicated sampling; see also estimation – estimating the sampling
variance – estimating variance using replicated sampling/ jackknife/
bootstrap
simple random sampling (SRS): 6.2.2; see also estimation- estimation
examples for SRSWOR
statistical efficiency of one sample design vs another: 6.2.1; see also
estimation - estimating design effect.
stratified sampling: 6.2.6; see also estimation- estimation examples for
Stratified SRSWOR
systematic sampling (SYS): 6.2.3
- sample size determination: Chapter 8
o precision requirement considerations: 8.1.1; see also estimation – estimating
the sampling variance - factors affecting precision
o sample size formulas: 8.1.3; 8.1.3.1
o cost, time and operational constraints: 8.1.4
- sampling: 6.0
- sampling errors: see errors in a survey – sampling errors
- sampling frame: see frames (survey frame/ sampling frame)
408.
SURVEY METHODS ANDPRACTICES
STATISTICS CANADA
396
- sampling strategy: 6.2.1
- self-enumeration: see data collection – self-enumeration
- simple random sampling (SRS): see sample design – probability sampling – simple
random sampling (SRS)
- statistical process control: see quality – quality control – statistical process control
- statistical product control: see quality – quality control – statistical product control
- steps of a survey: 1.1
- stratified sampling (STR): see sample design – probability sampling –stratified
sampling (STR)
- systematic sampling (SYS): see sample design – probability sampling –systematic
sampling (SYS)
- telephone sampling: 4.1.2.2.1
o random digit dialling (RDD): 4.1.2.2.1
- tracing: see data collection – data collection operations – preparation of data collection
procedures - tracing
- two-phase sampling/ double sampling: see sample design – probability sampling –
multi-phase sampling
- units in a survey:
o sampling unit versus unit of reference versus reporting unit: definition 3.3
- weights: see also estimation
o design weight: 7.1
for equal probability sample designs: 7.1.1
for unequal probability sample designs: 7.1.2
o weight adjustment for nonresponse: 7.1.3
o using auxiliary information to adjust weights: 7.1.4
post-stratification: 7.1.4.1
ratio estimation: 7.1.4.2
calibration and generalised regression: 7.1.4.3


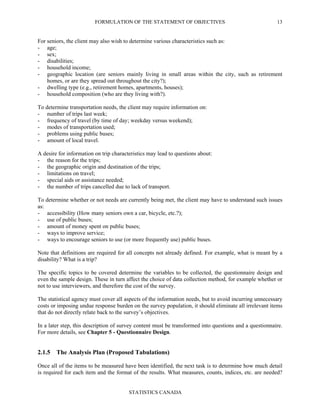

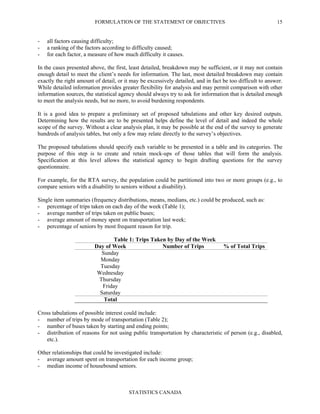


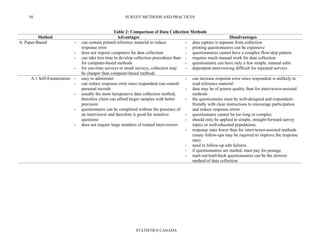

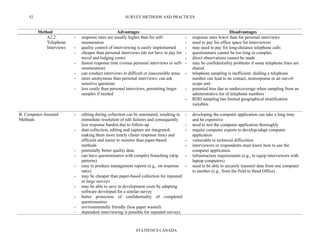
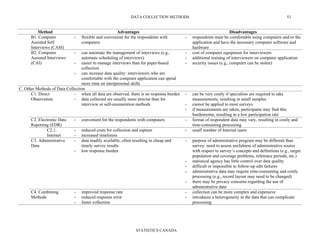
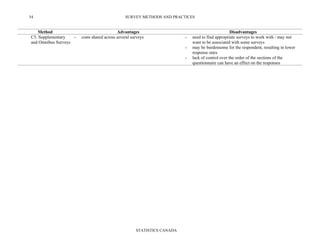
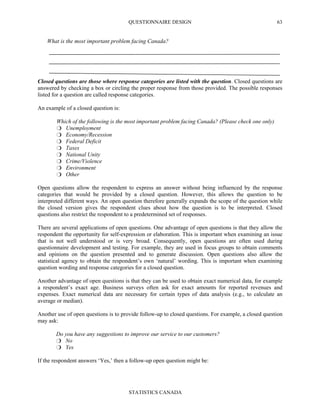
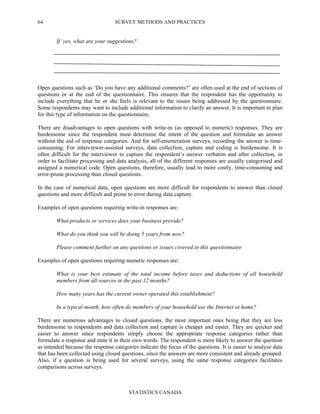
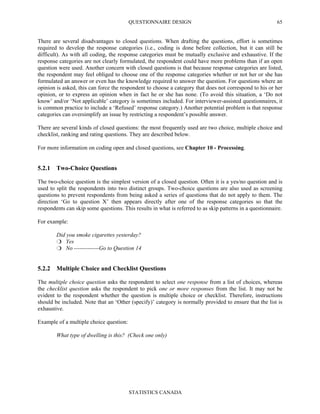
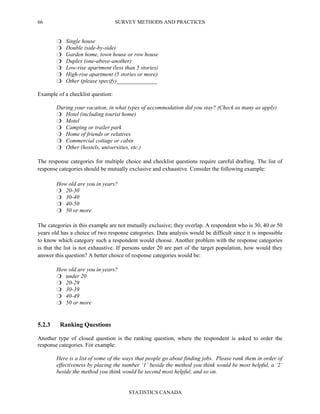
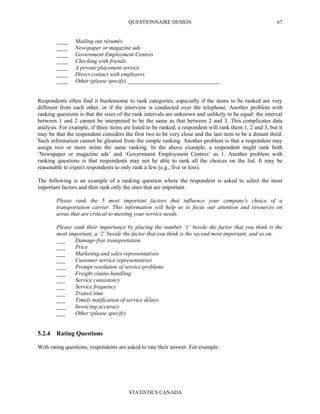
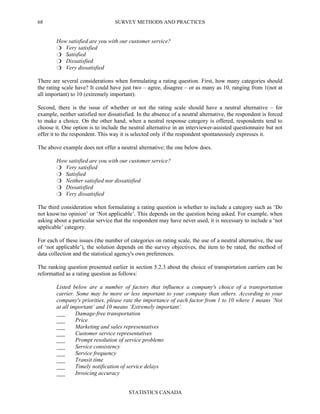

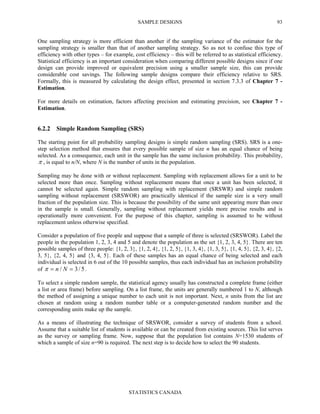
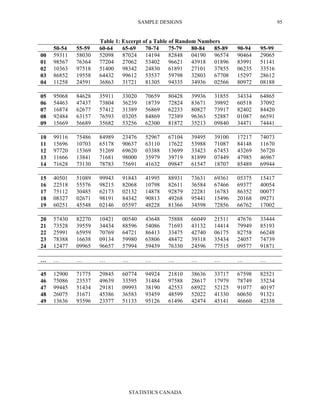
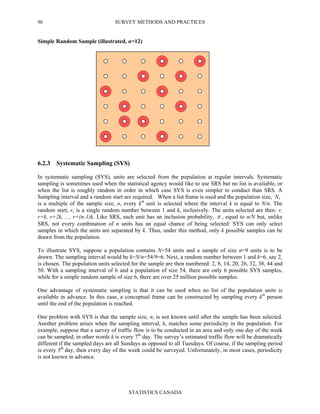
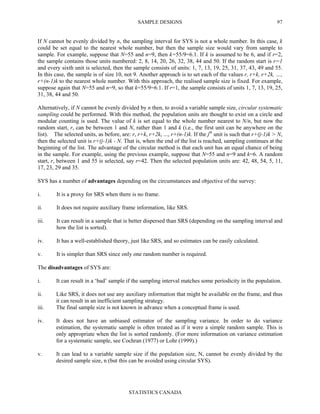
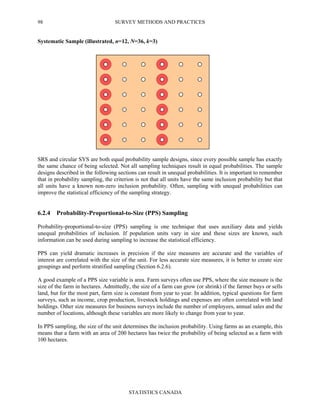
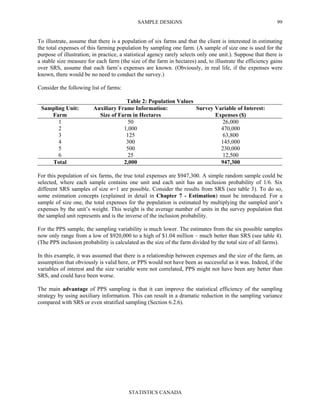
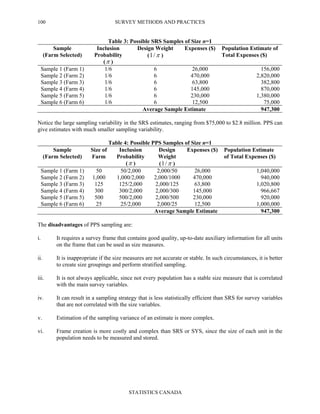
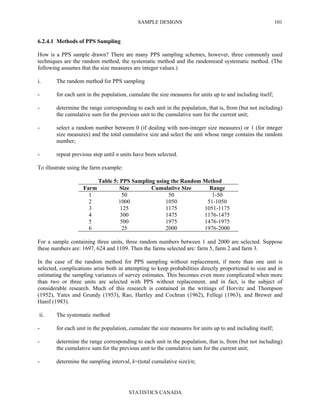
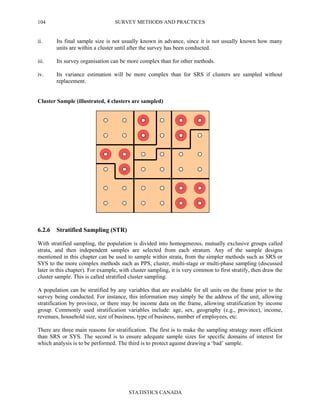
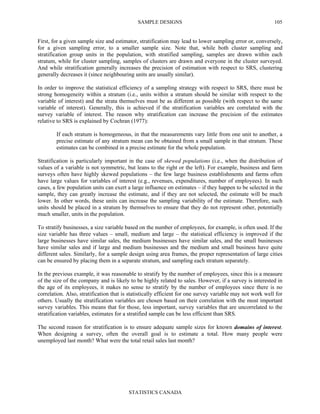
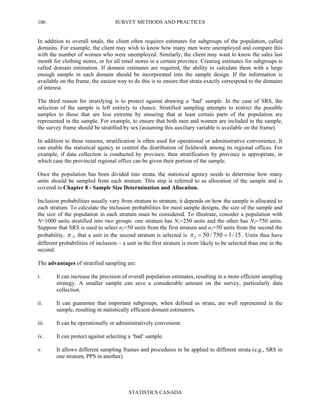
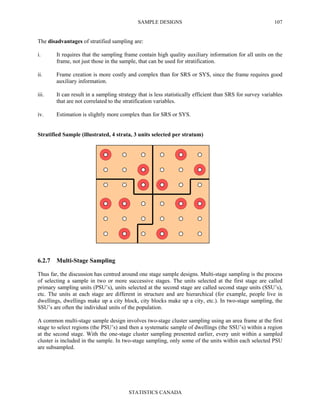

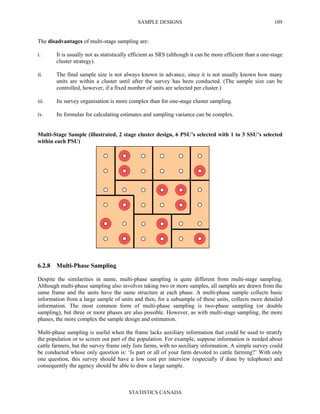
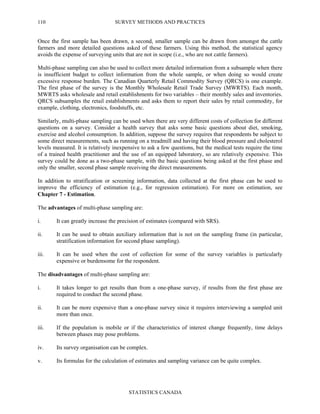
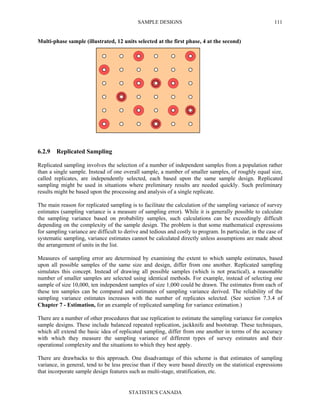
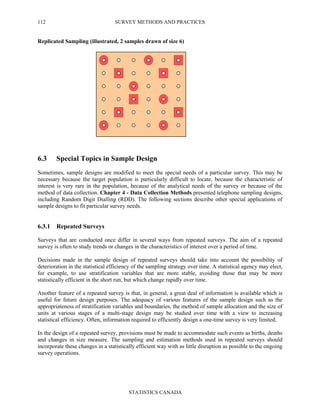
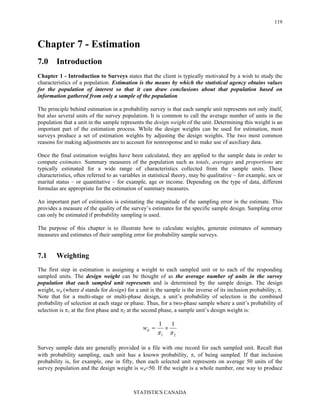
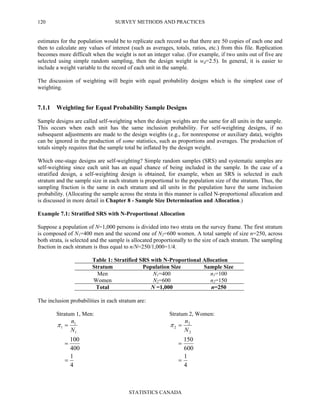
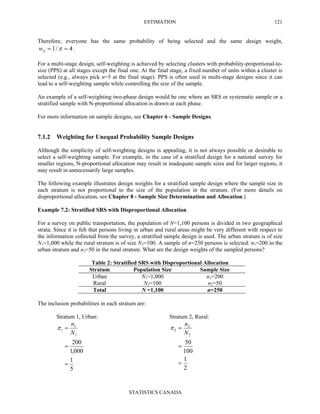
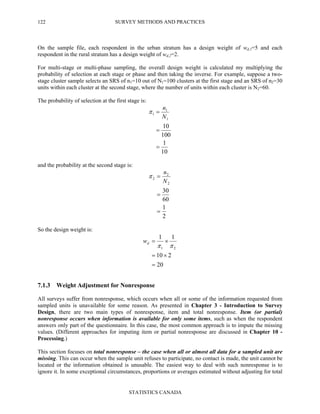
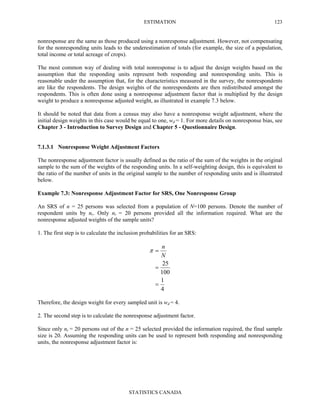
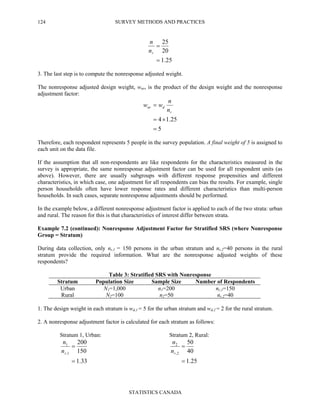
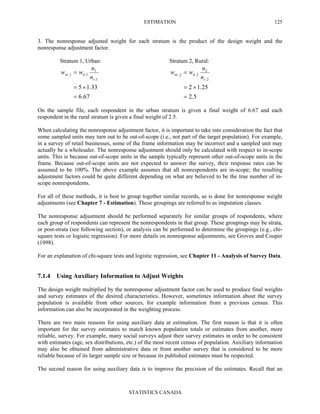
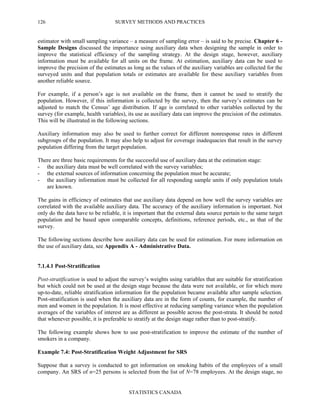
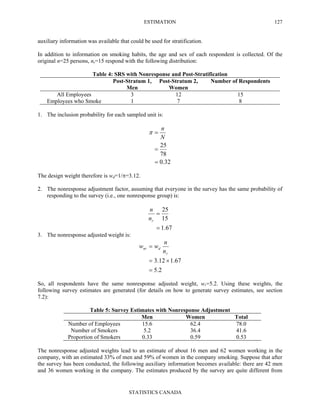
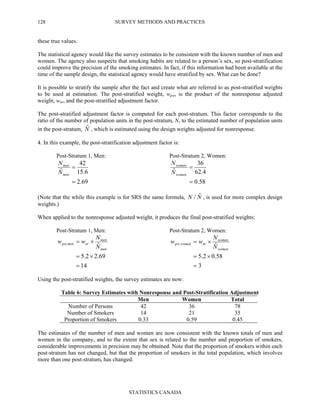
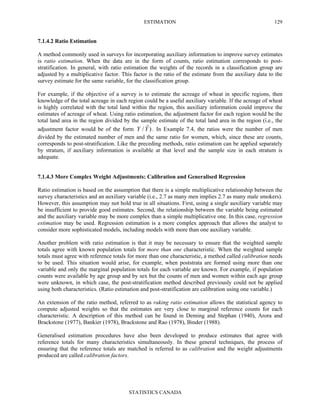
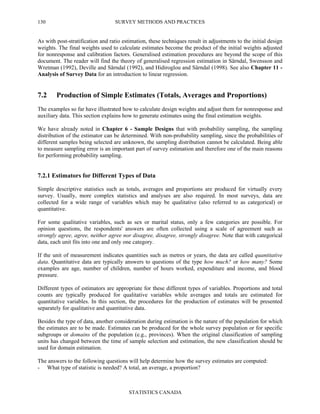
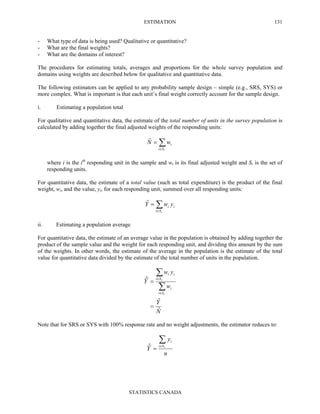
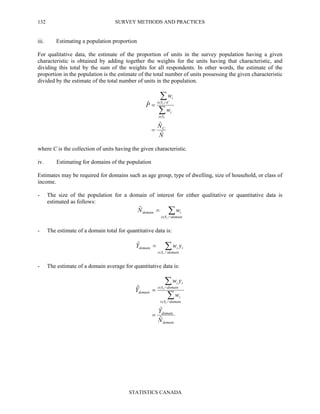
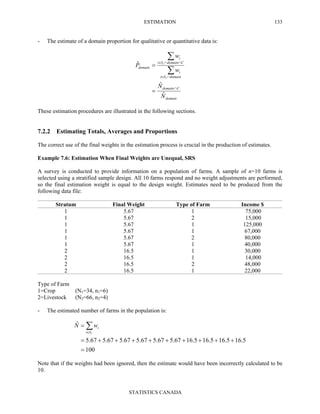
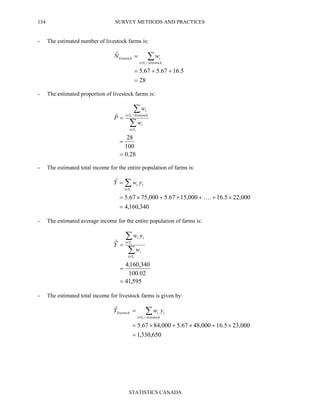
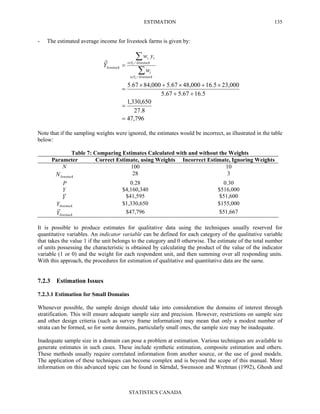
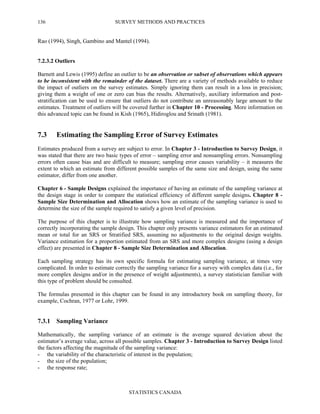
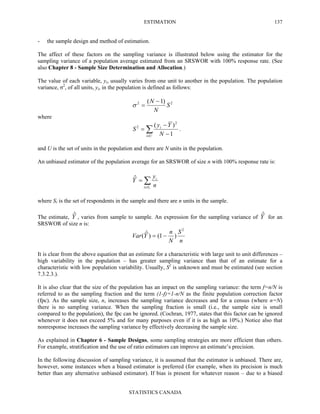
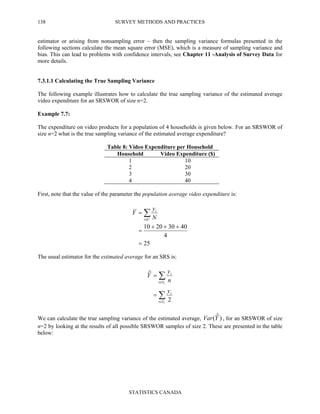
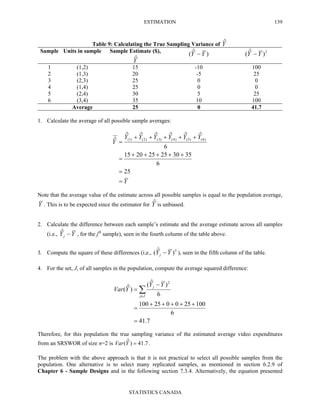
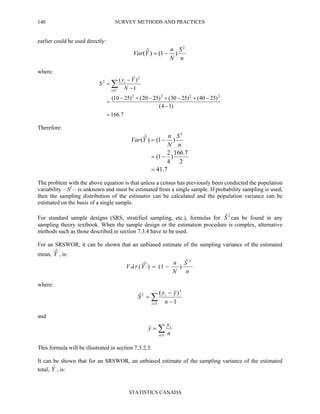
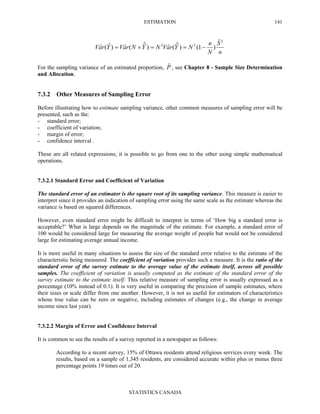
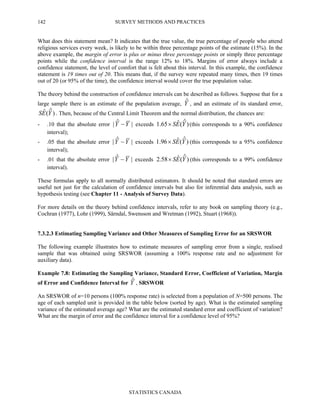
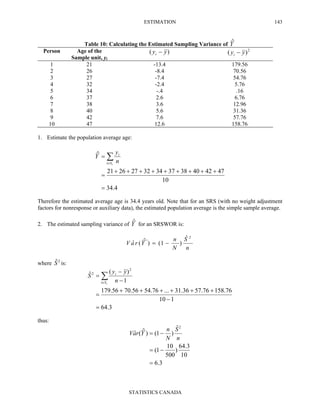
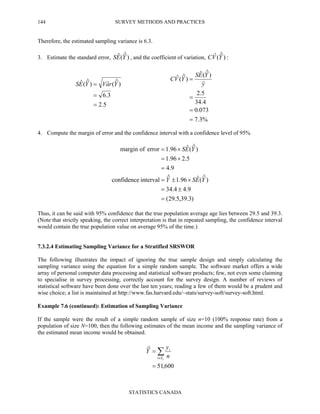
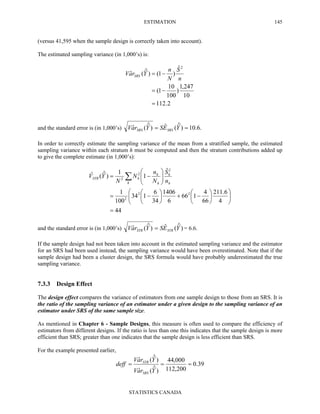
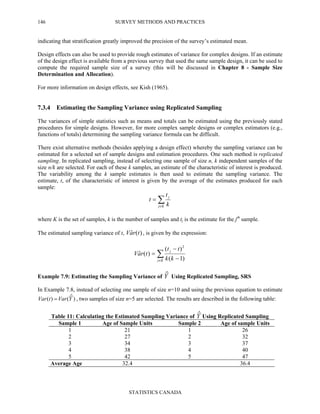
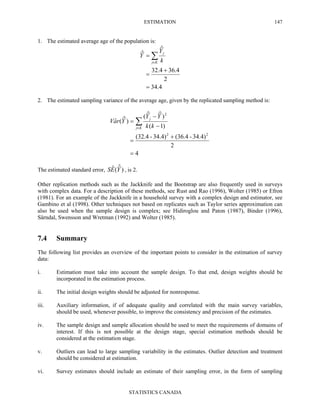
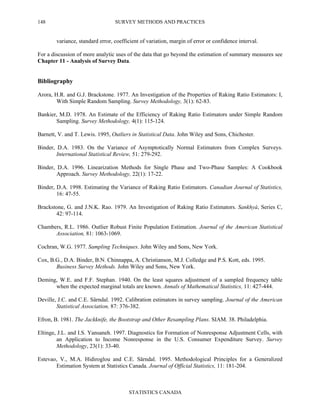
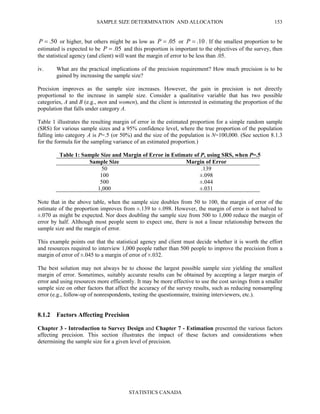
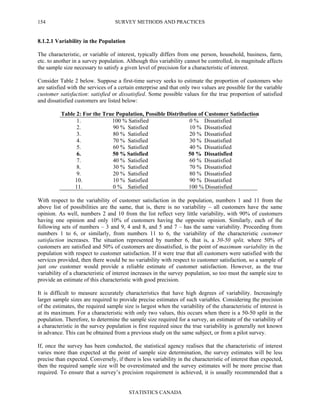
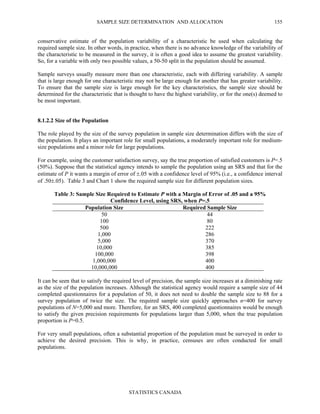
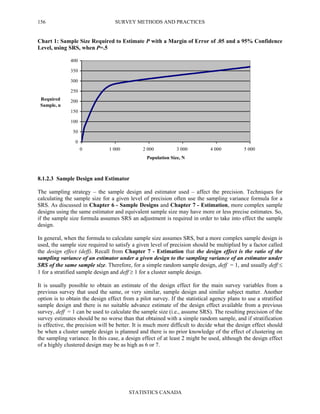
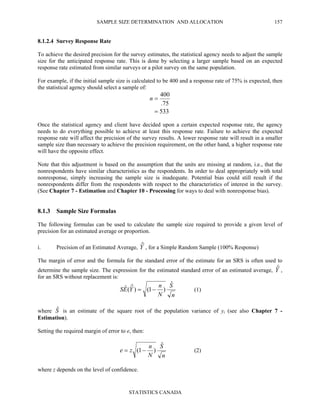
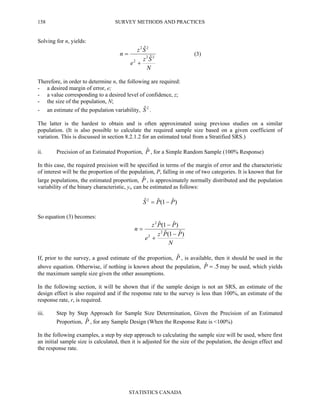
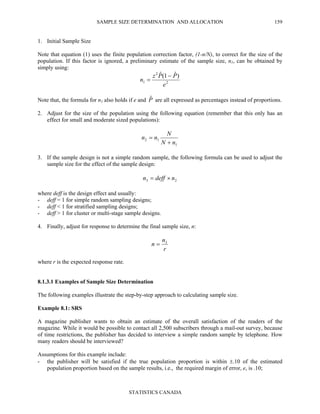
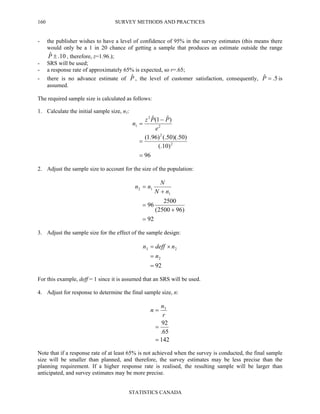
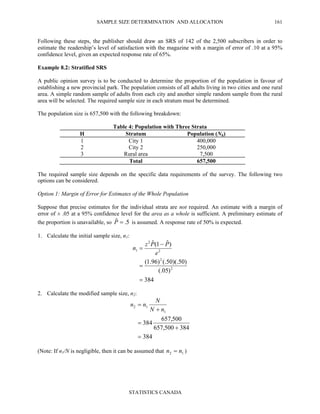
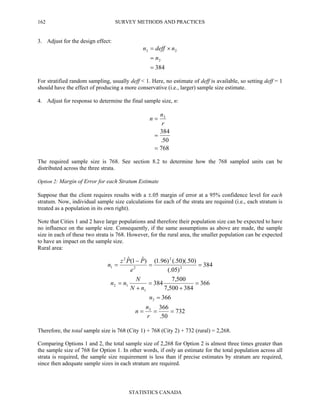
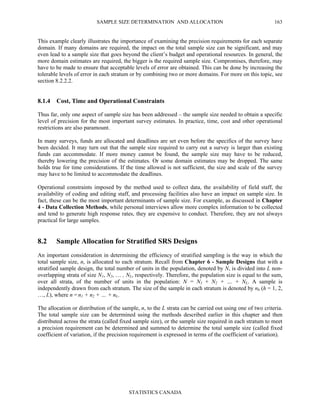
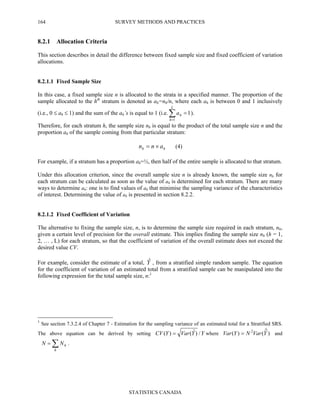
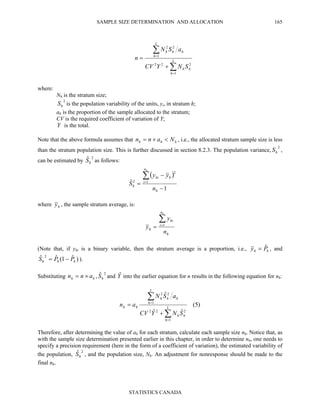
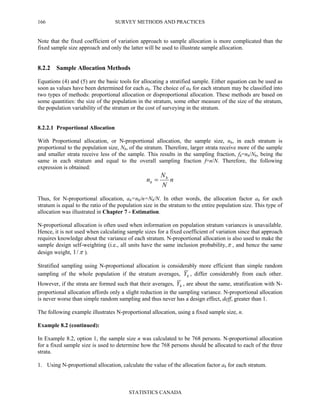
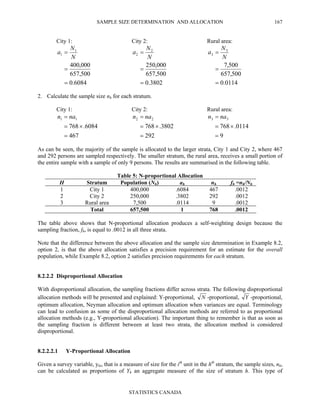
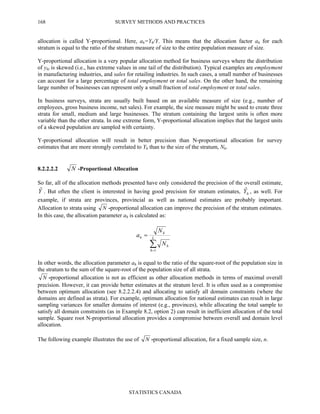
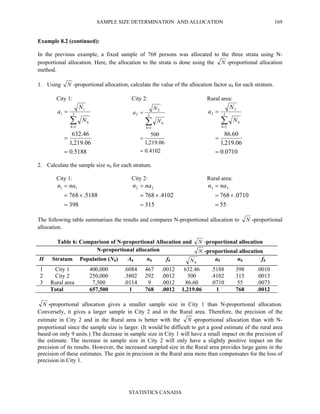
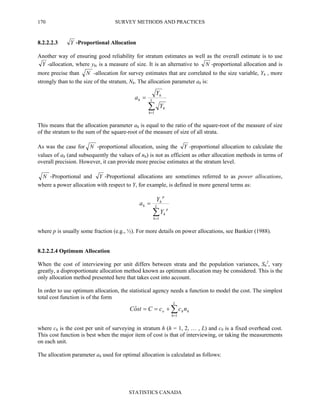
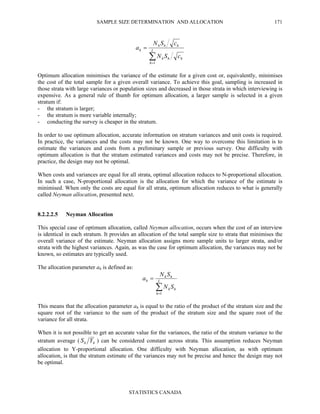
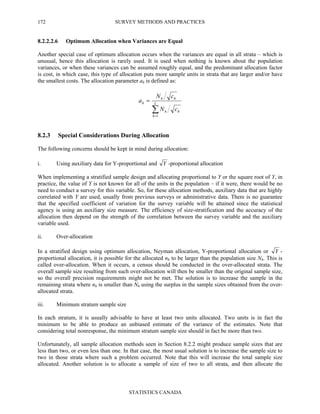

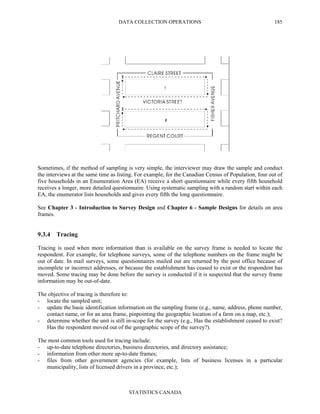

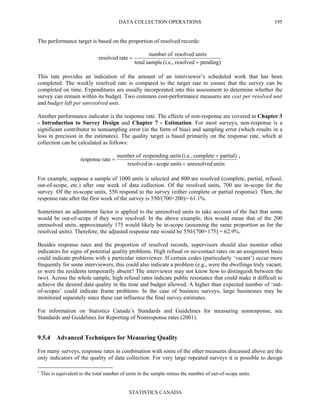

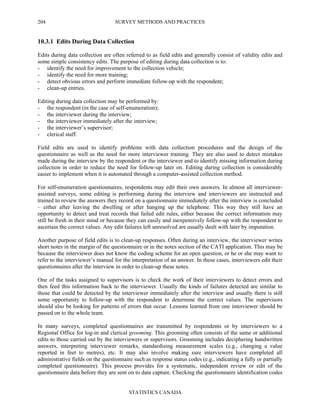
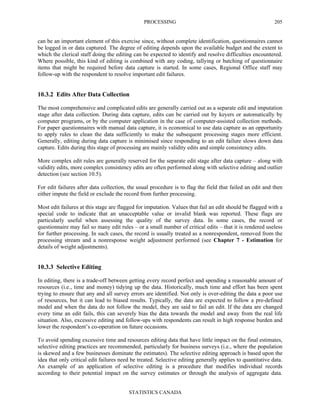
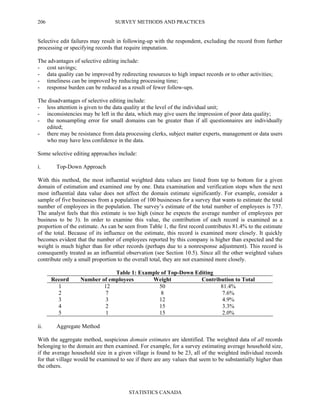

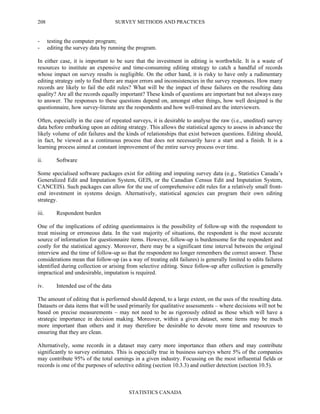
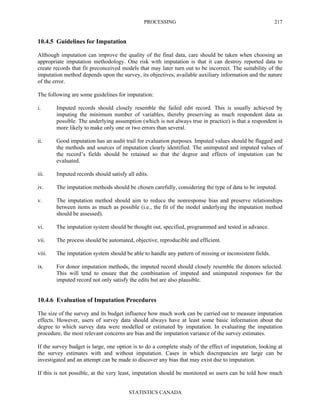
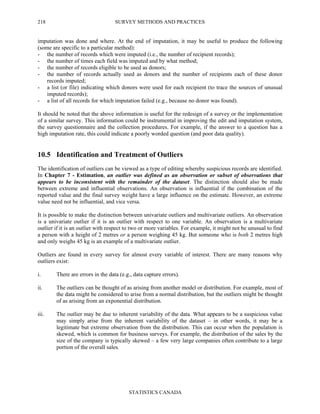
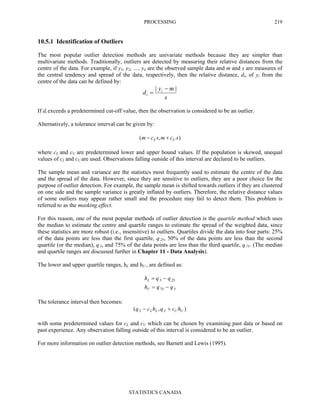
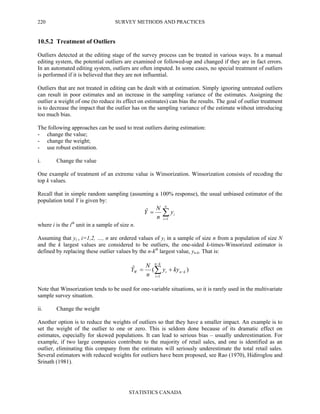

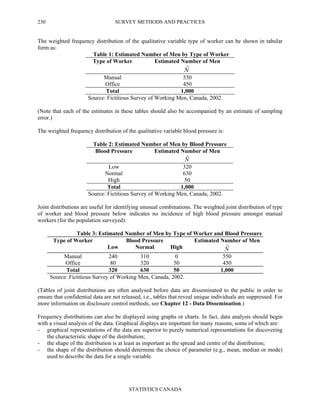
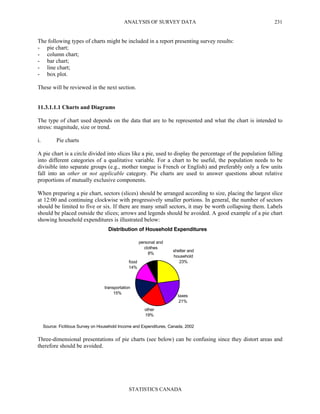
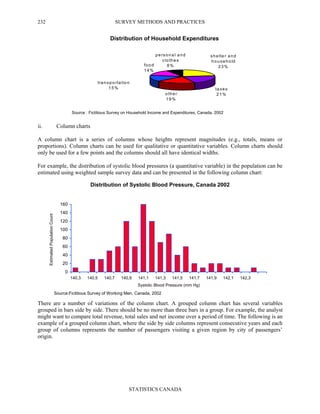
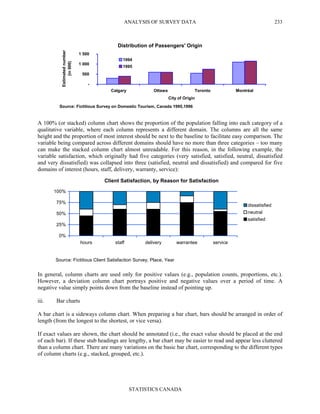
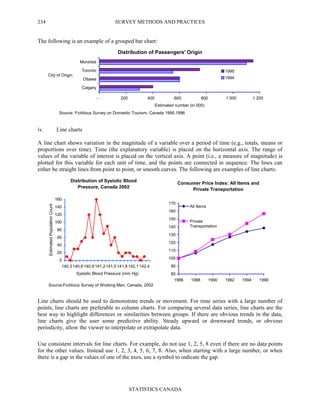
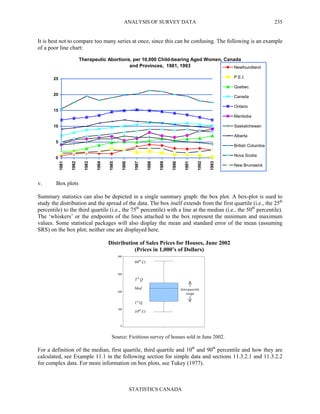
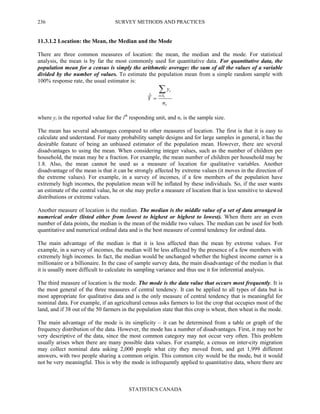
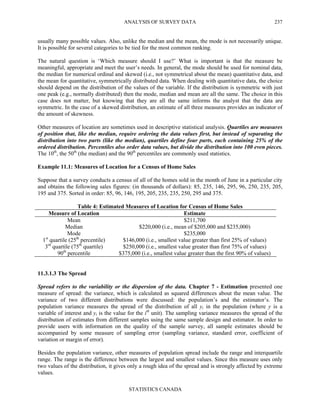
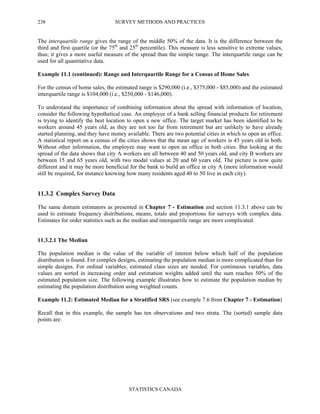
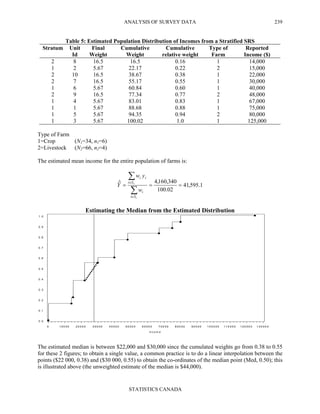
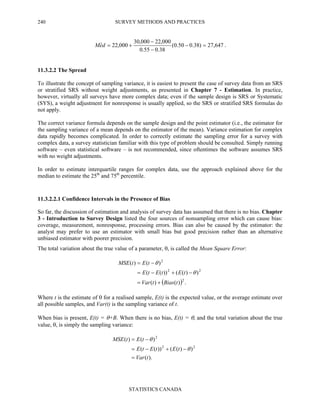
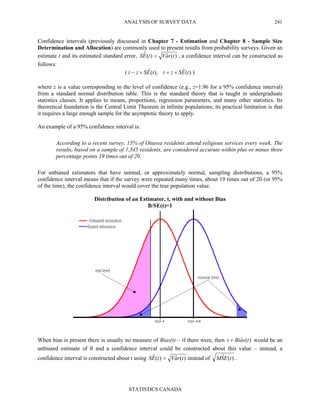
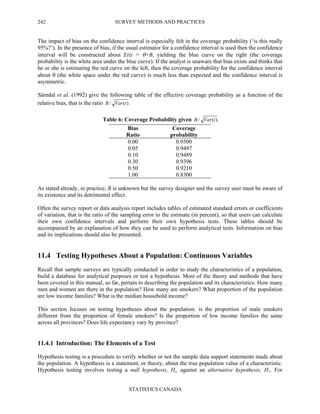
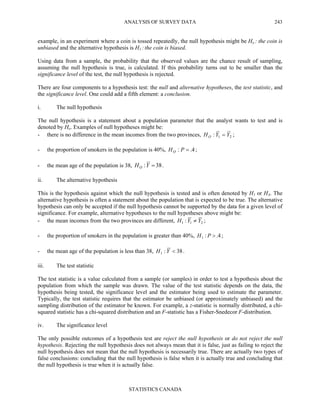
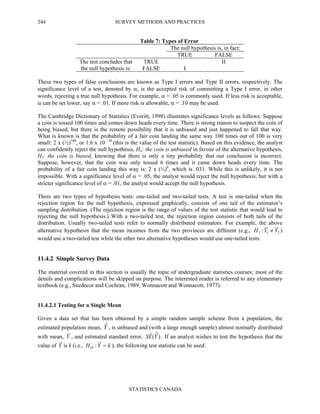
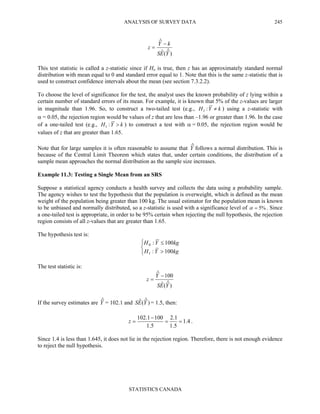
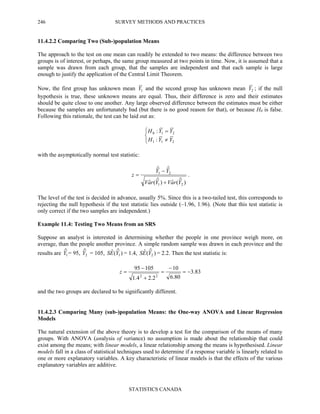
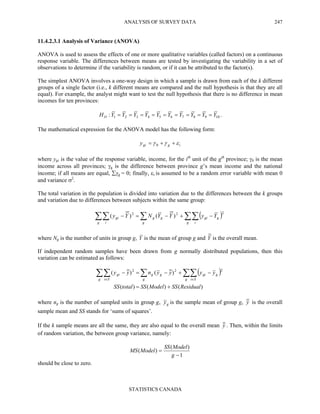
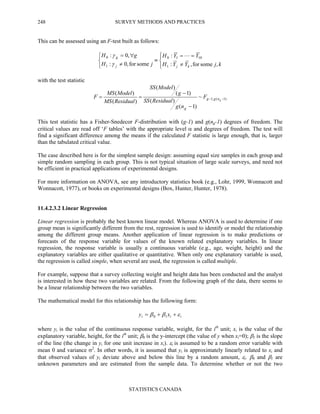
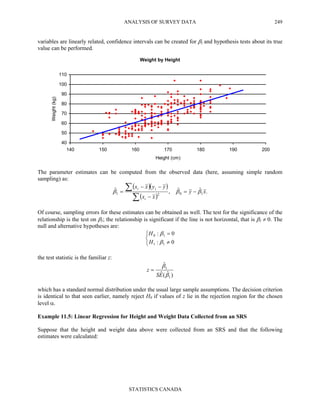
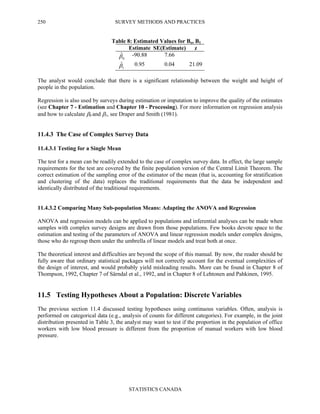
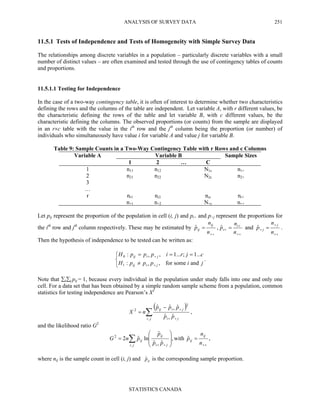
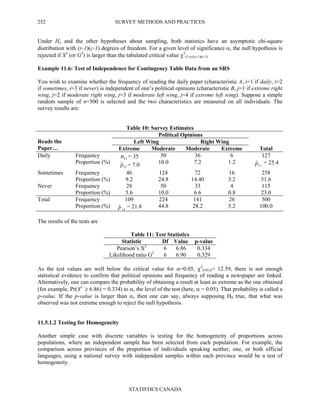
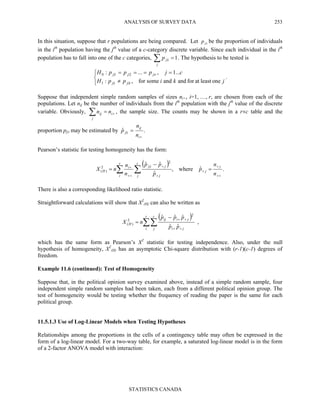
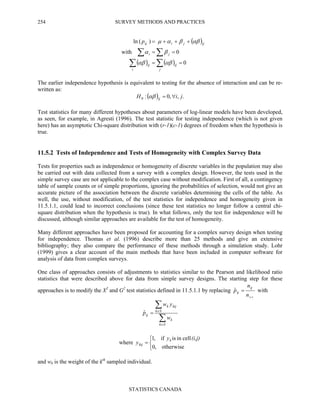
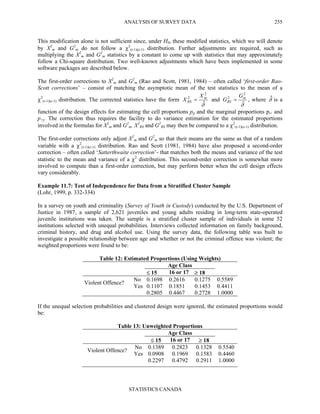
![SURVEY METHODS AND PRACTICES
STATISTICS CANADA
256
Clearly, the sample design has an effect on the estimates and cannot be dismissed or disregarded.
As well, the simple Pearson test statistic for independence defined in 11.5.1.1 would have a value of 34.
Since the critical value for a χ2
(2-1)(3-1) is 5.99 at the 5% level, the hypothesis of independence would be
rejected. Now, clearly, young offenders are not scattered at random among the correctional facilities. In
particular, all residents of Facility #31 are violent offenders. The effect of these clusterings can be seen
after computing the design effects for the preceding table:
Table 14: Design Effects
Age Class
≤ 15 16 or 17 ≥ 18
No 20.2 1.9 2.8 5.7
Violent Offence?
Yes 5.3 8.4 2.4 5.7
22.0 9.7 4.3
The first-order adjusted test statistic has a value of X2
RS = 16.2. The effect of the design is noticeable,
although the conclusion remains the same.
11.6 Summary
Data analysis is one of the most crucial steps of a survey, since the quality of the analysis and how well it
is communicated can substantially affect the usefulness of the whole survey. Data analysis should relate
the survey results to the questions and issues identified during the first step of the survey.
Data analysis may be restricted to the survey data alone or it may involve comparing the survey results
with results obtained from other surveys or data sources. Often, it consists of examining tables and charts
of various summary measures such as frequency distributions, means and ranges. More sophisticated
types of data analysis may also be performed – statistical inference may be applied in order to verify
hypotheses or study the relationships between characteristics.
In order to make inferences about the population, the sample design must be properly accounted for. For
simple survey data, standard formulas can be obtained from statistical textbooks. For more complex data,
a specialist should be consulted.
Bibliography
Agresti, A. 1996. An Introduction to Categorical Data Analysis. John Wiley and Sons. New York.
Aldrich, J.H. and F.D. Nelson. 1984. Linear probability, Logit and Probit Models. Quantitative
Applications in the Social Sciences Series. 07-045. Sage Publications, California.
Ardilly, P. 1994. Les Techniques de sondage. Editions Technip, Paris.
Bausch, T. and U. Bankhofer. 1992. Statistical Software Packages for PCs - A Market Survey. Statistical
Papers [formerly: Statistischen Hefte], 33: 283-306.
Binder, D.A. 1984. Analysis of Categorical Data from Surveys with Complex Designs: Some Canadian
Experiences. Survey Methodology, 10(2): 141-156.](https://image.slidesharecdn.com/surveymethodsandpractice-130611082446-phpapp01/85/Survey-methods-and-practice-268-320.jpg)