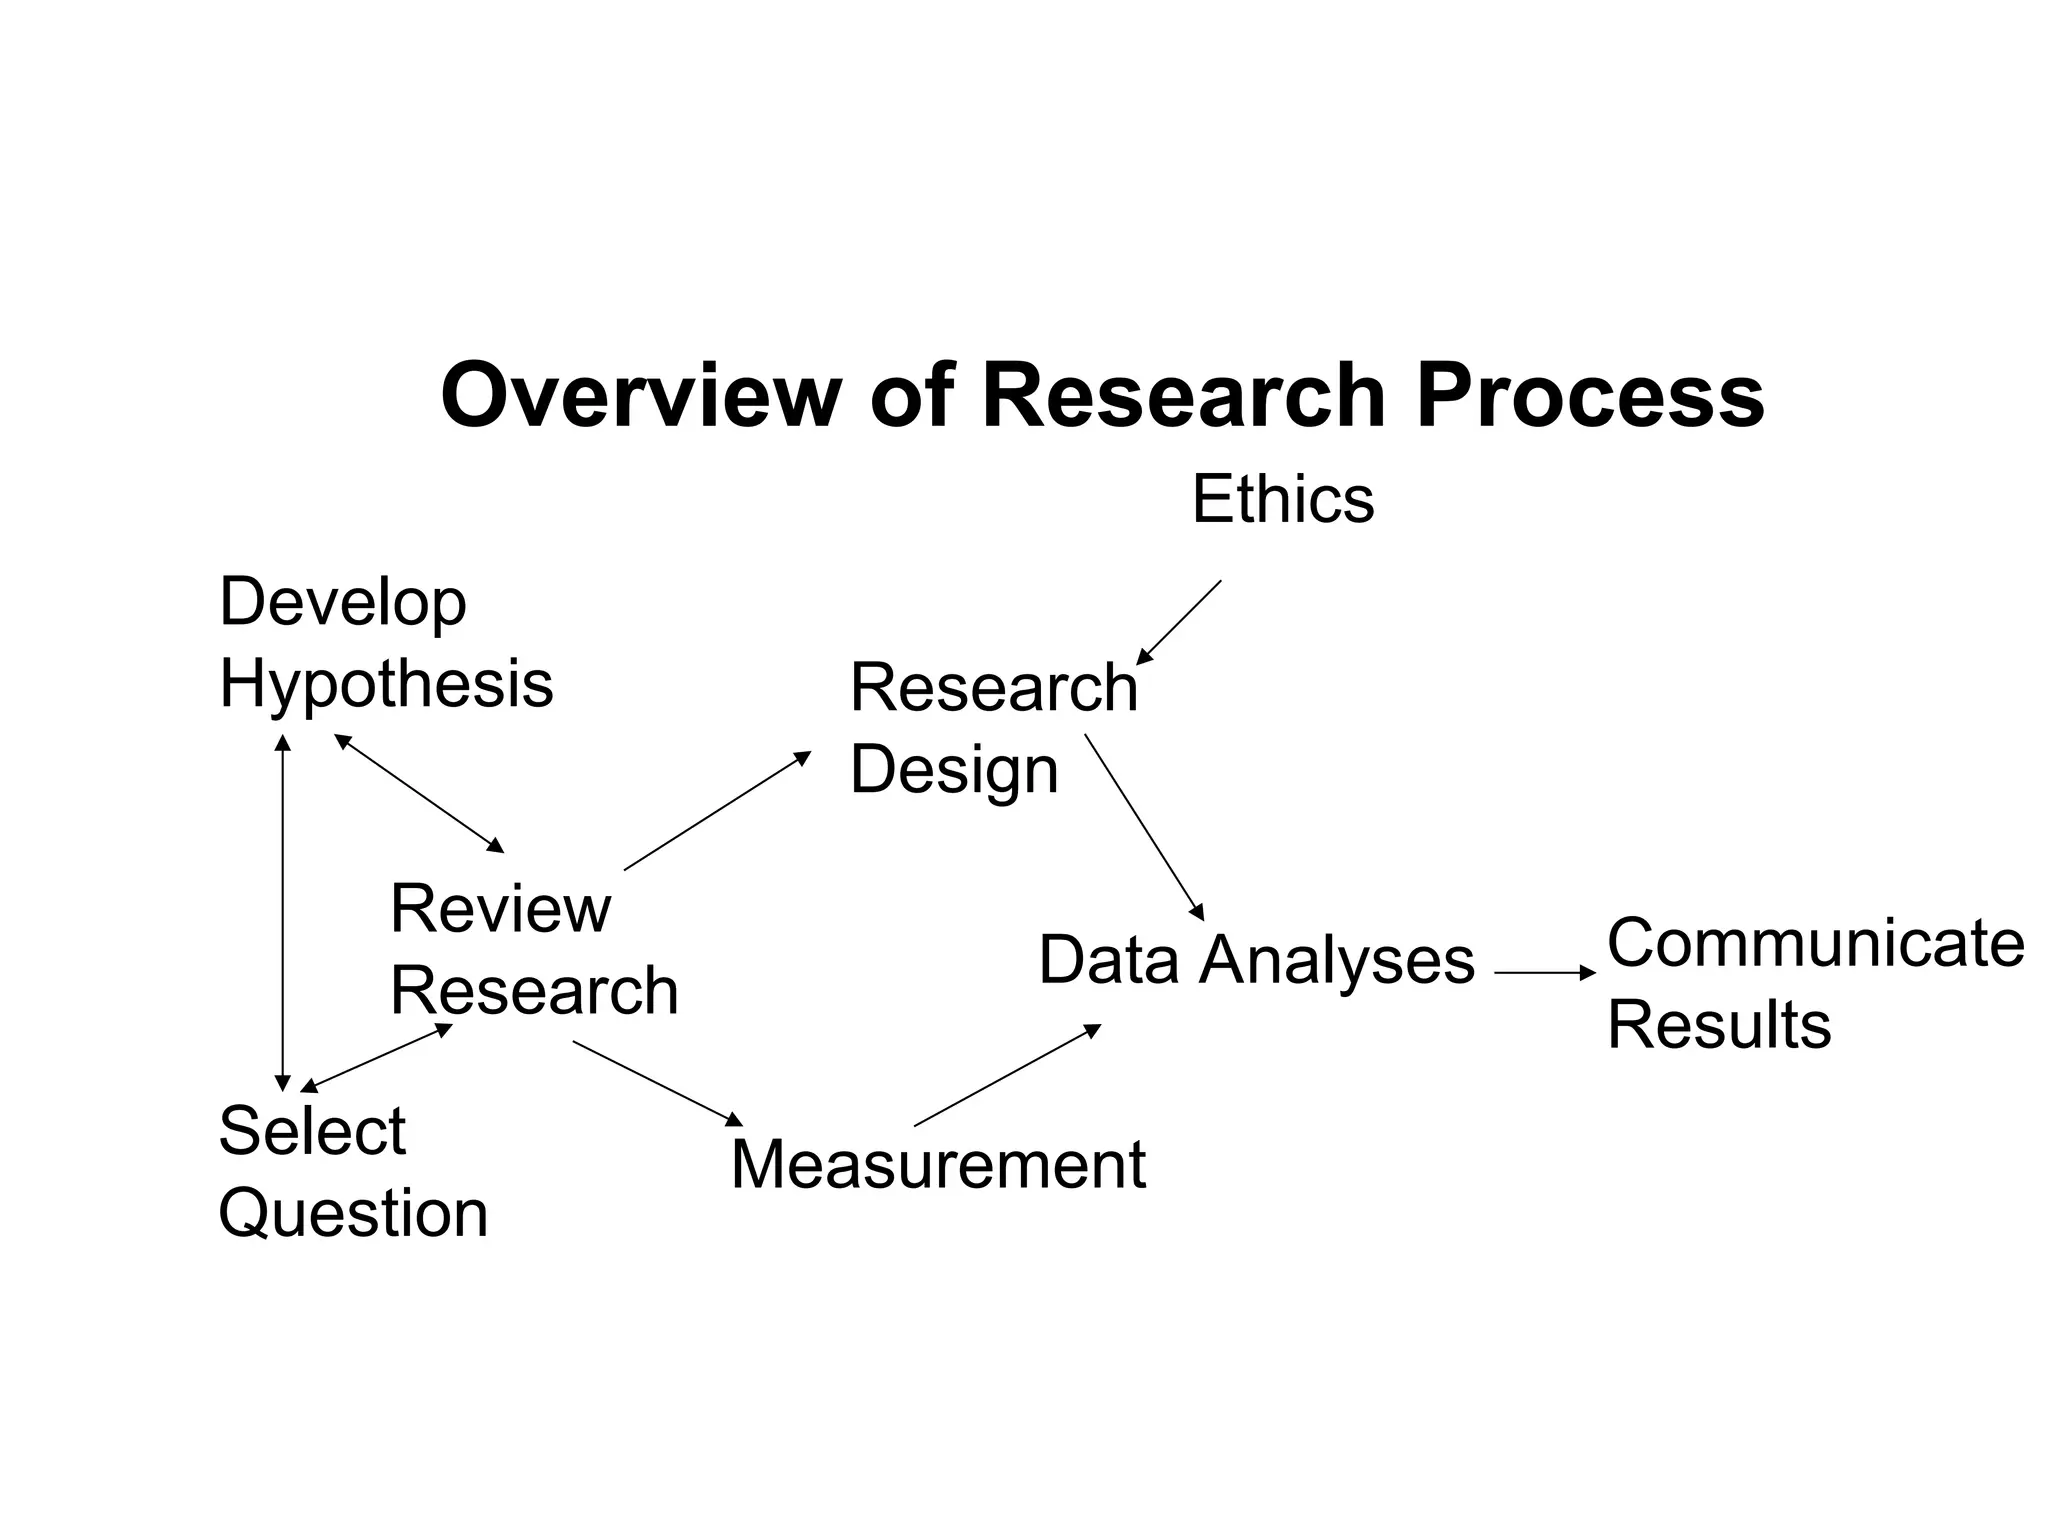
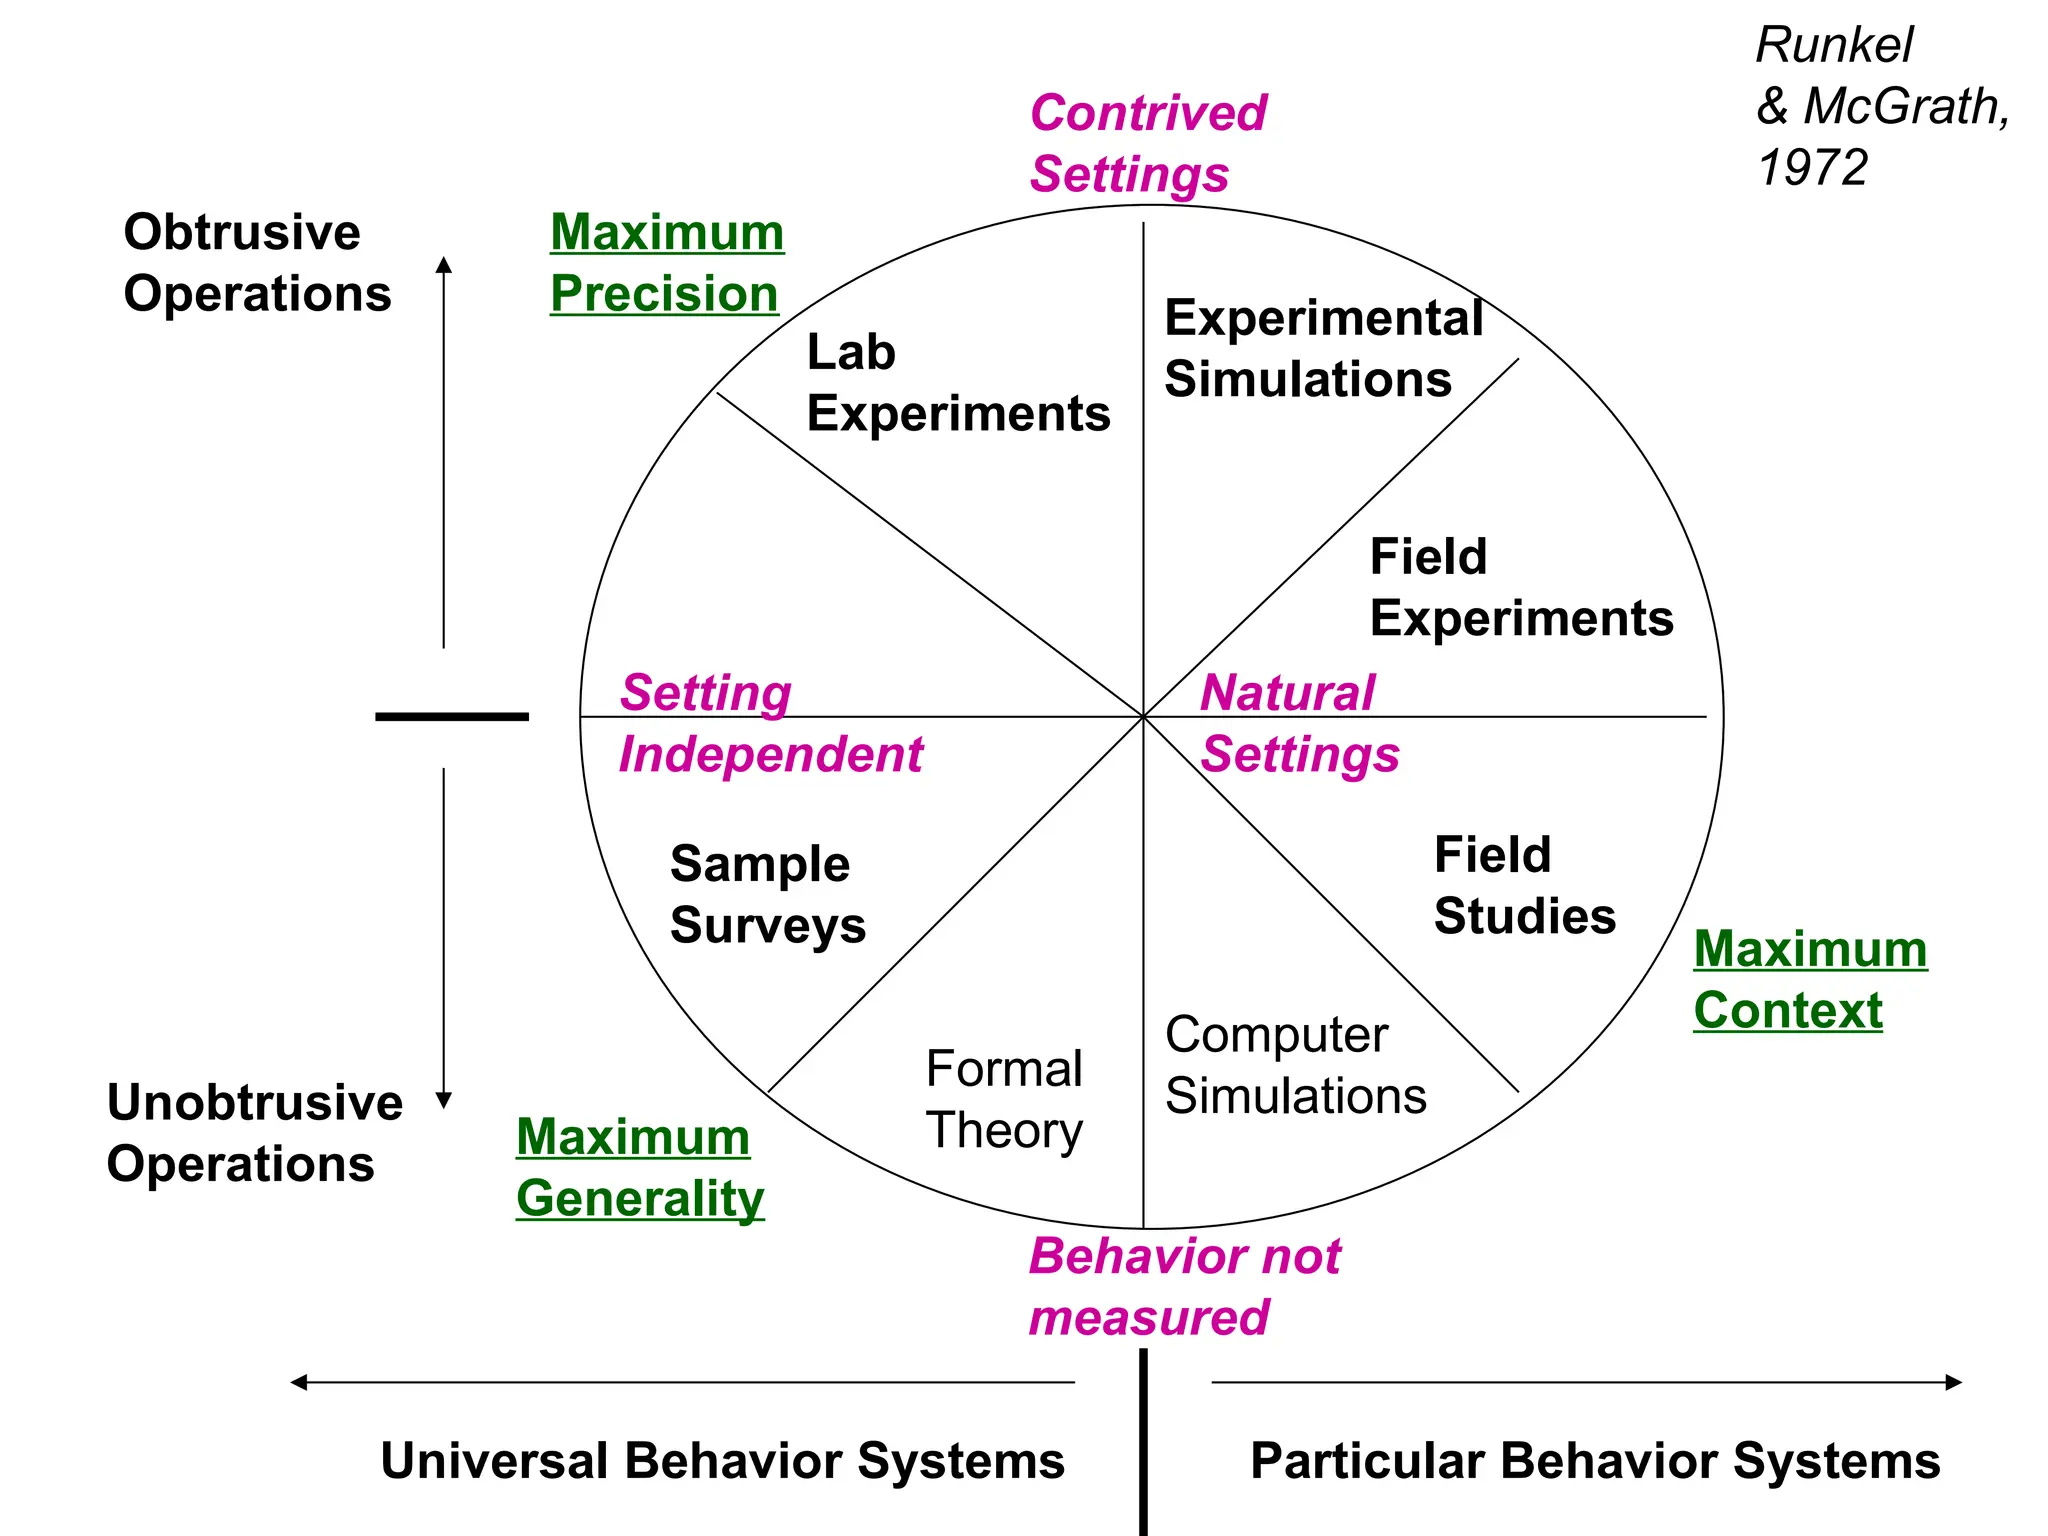
Particular Behavior Systems
UniversalBehavior Systems
Obtrusive
Operations
Unobtrusive
Operations
Natural
Settings
Contrived
Settings
Field
Studies
Field
Experiments
Lab
Experiments
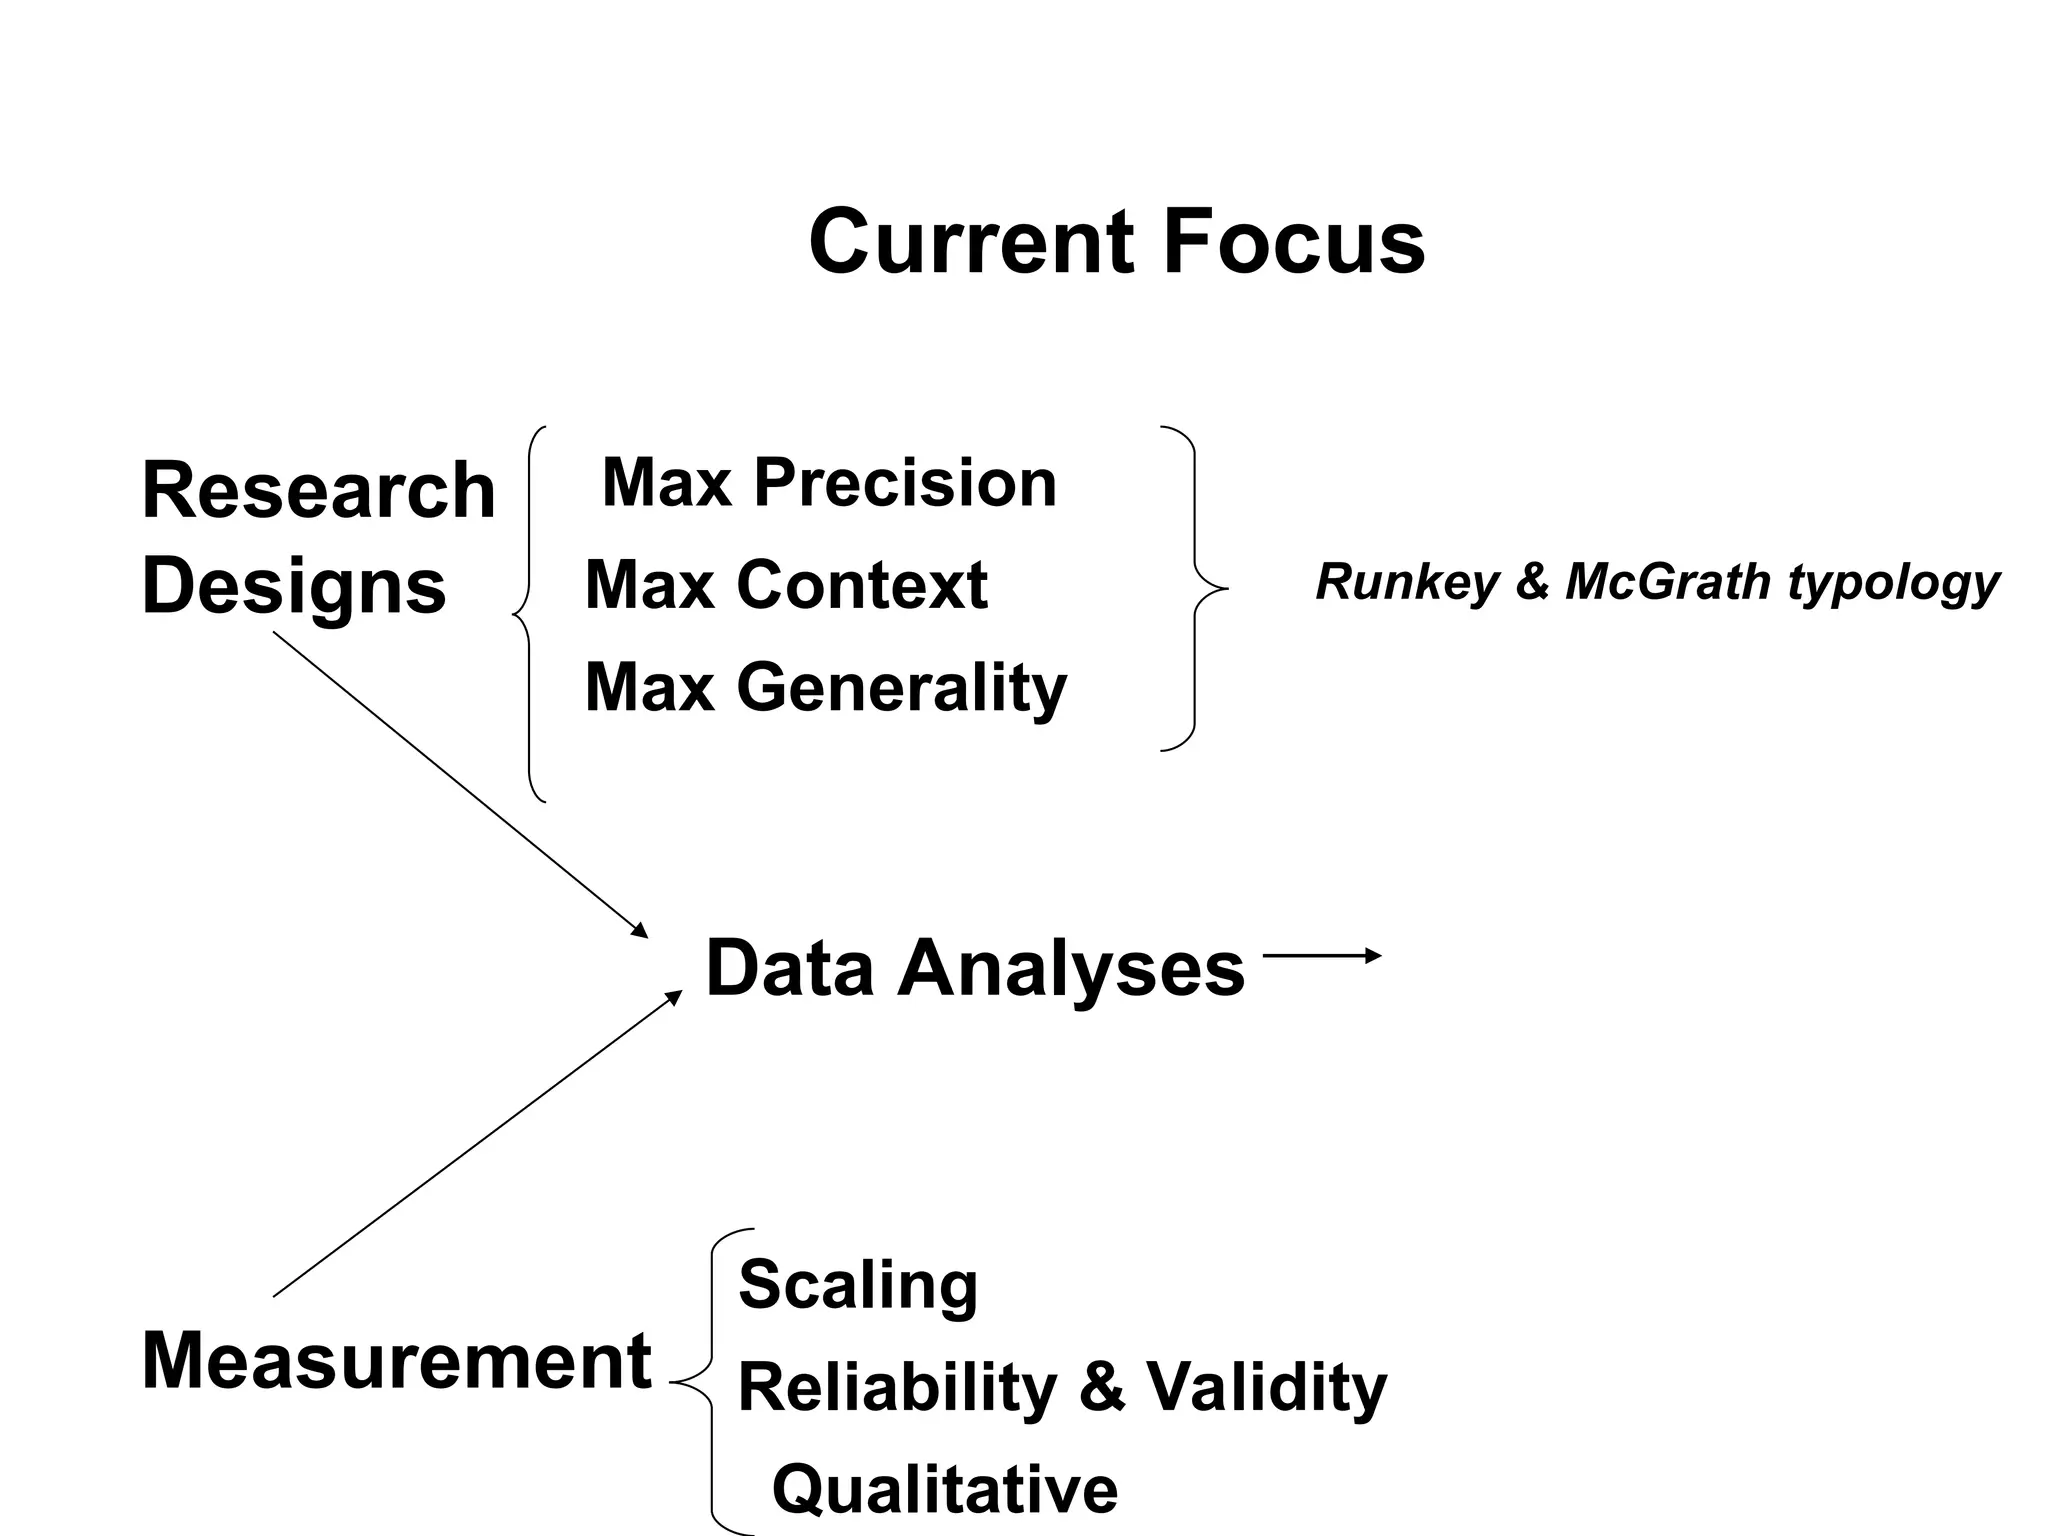
Maximum
Context
Maximum
Precision
Maximum
Generality
Formal
Theory
Sample
Surveys
Setting
Independent
Behavior not
measured
Computer
Simulations
Runkel
& McGrath,
1972
Experimental
Simulations
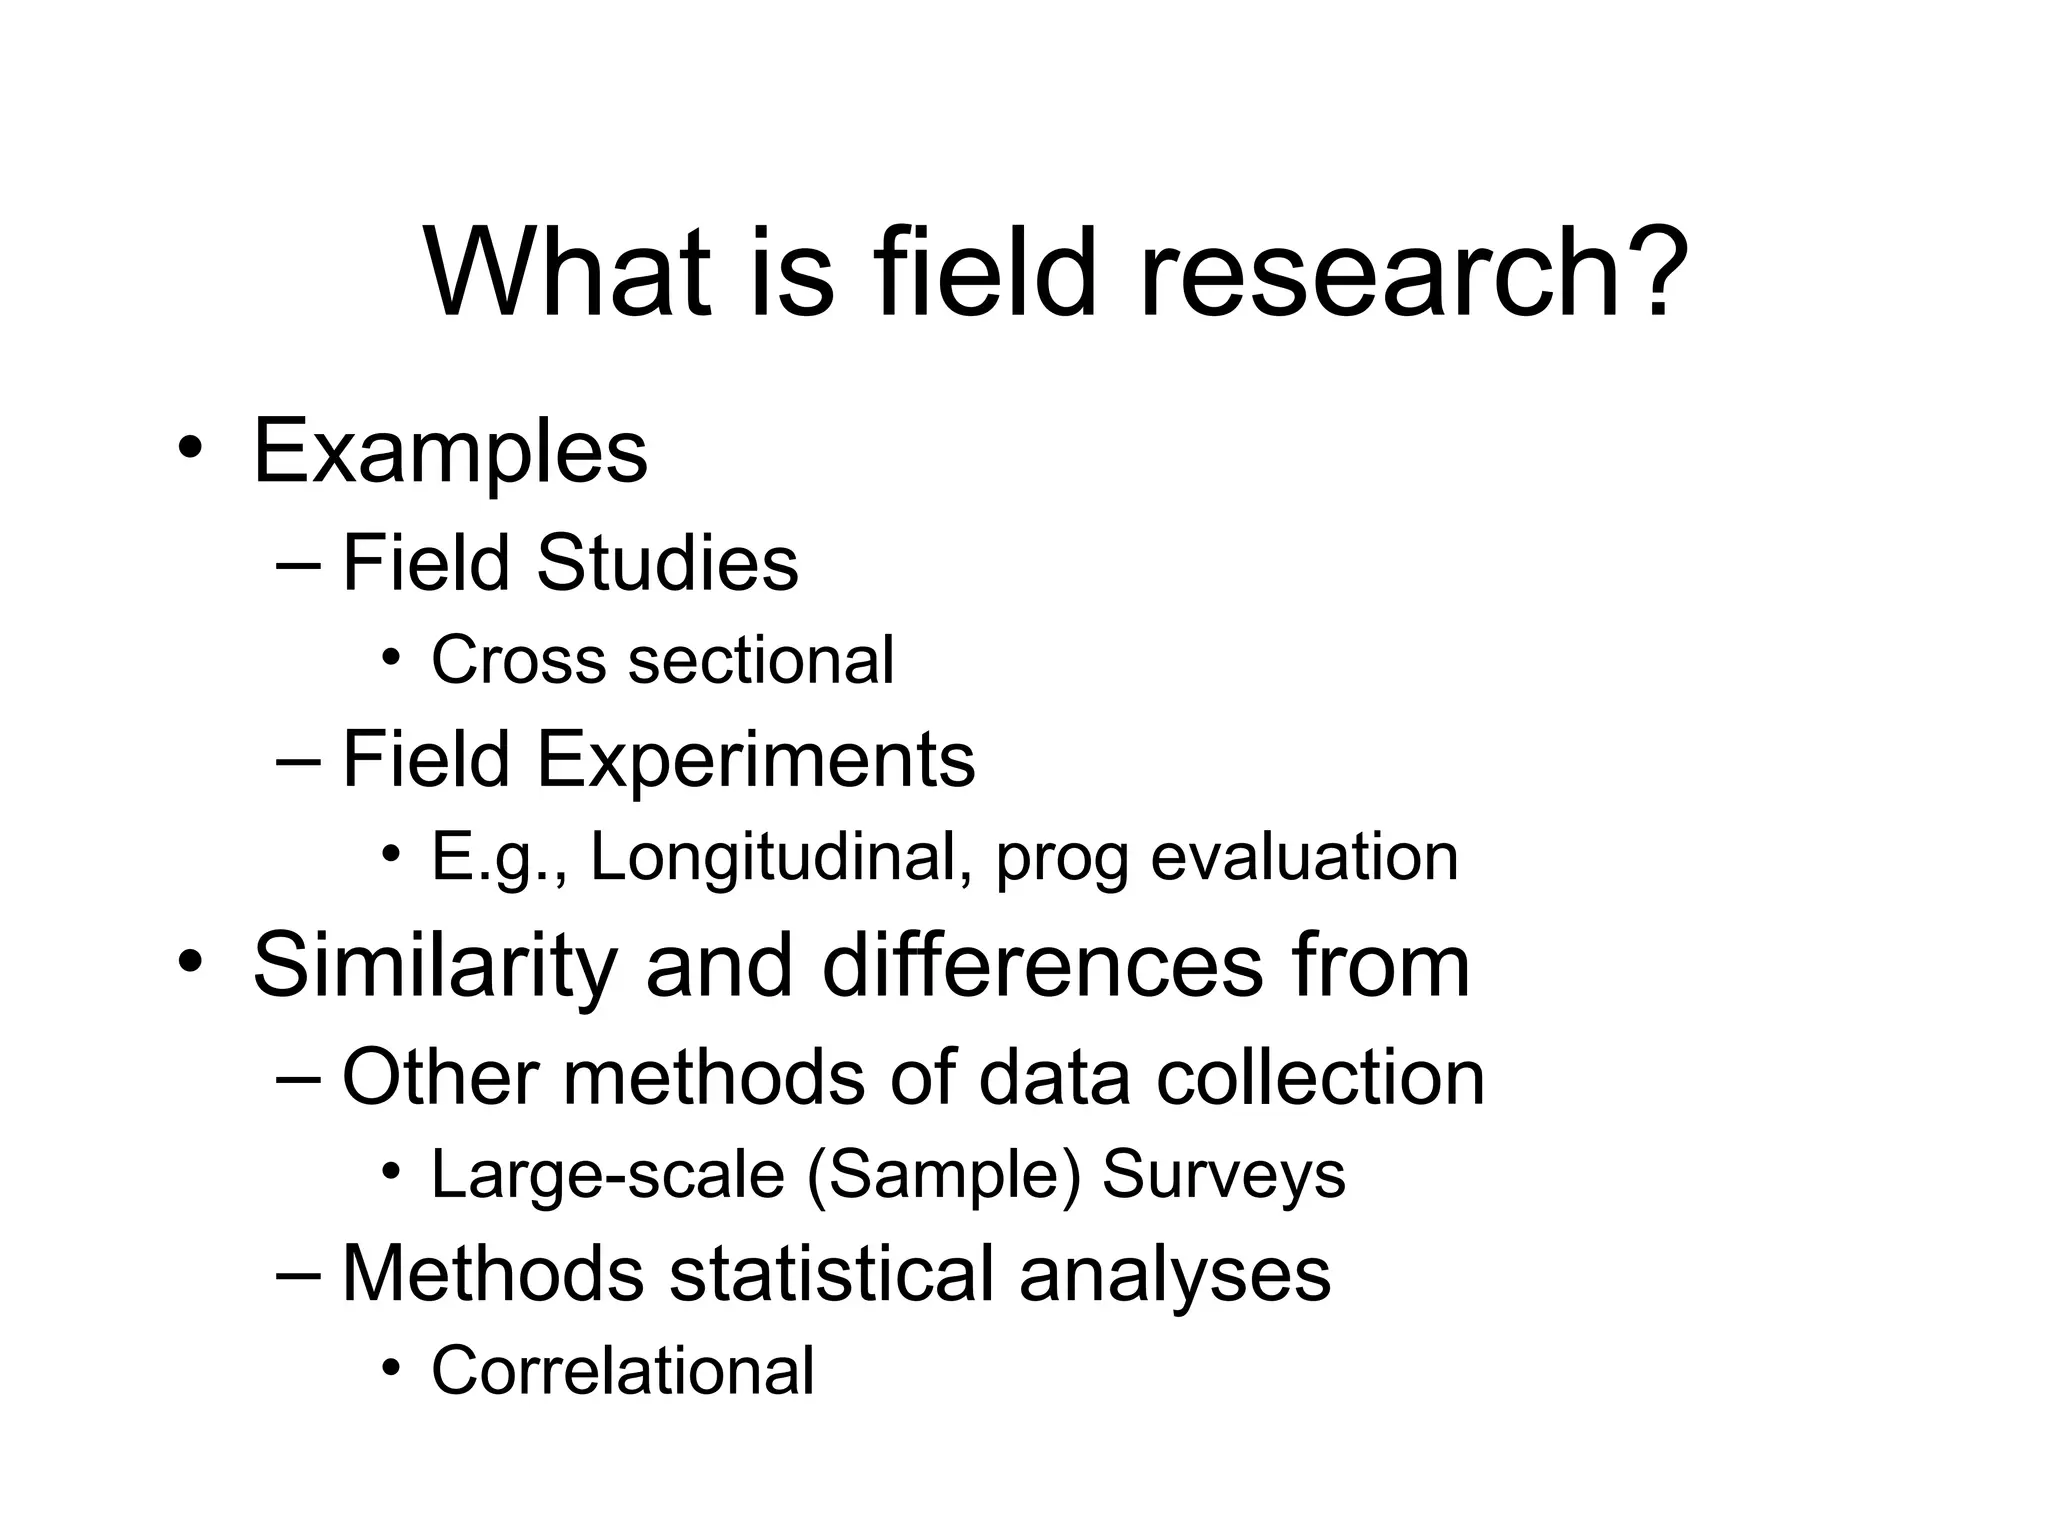
What is fieldresearch?
• Examples
– Field Studies
• Cross sectional
– Field Experiments
• E.g., Longitudinal, prog evaluation
• Similarity and differences from
– Other methods of data collection
• Large-scale (Sample) Surveys
– Methods statistical analyses
• Correlational
6.
Particular Behavior Systems
UniversalBehavior Systems
Obtrusive
Operations
Unobtrusive
Operations
Natural
Settings
Contrived
Settings
Field
Studies
Field
Experiments
Lab
Experiments
Maximum
Context
Maximum
Precision
Maximum
Generality
Formal
Theory
Sample
Surveys
Setting
Independent
Behavior not
measured
Computer
Simulations
Runkel
& McGrath,
1972
Experimental
Simulations
7.
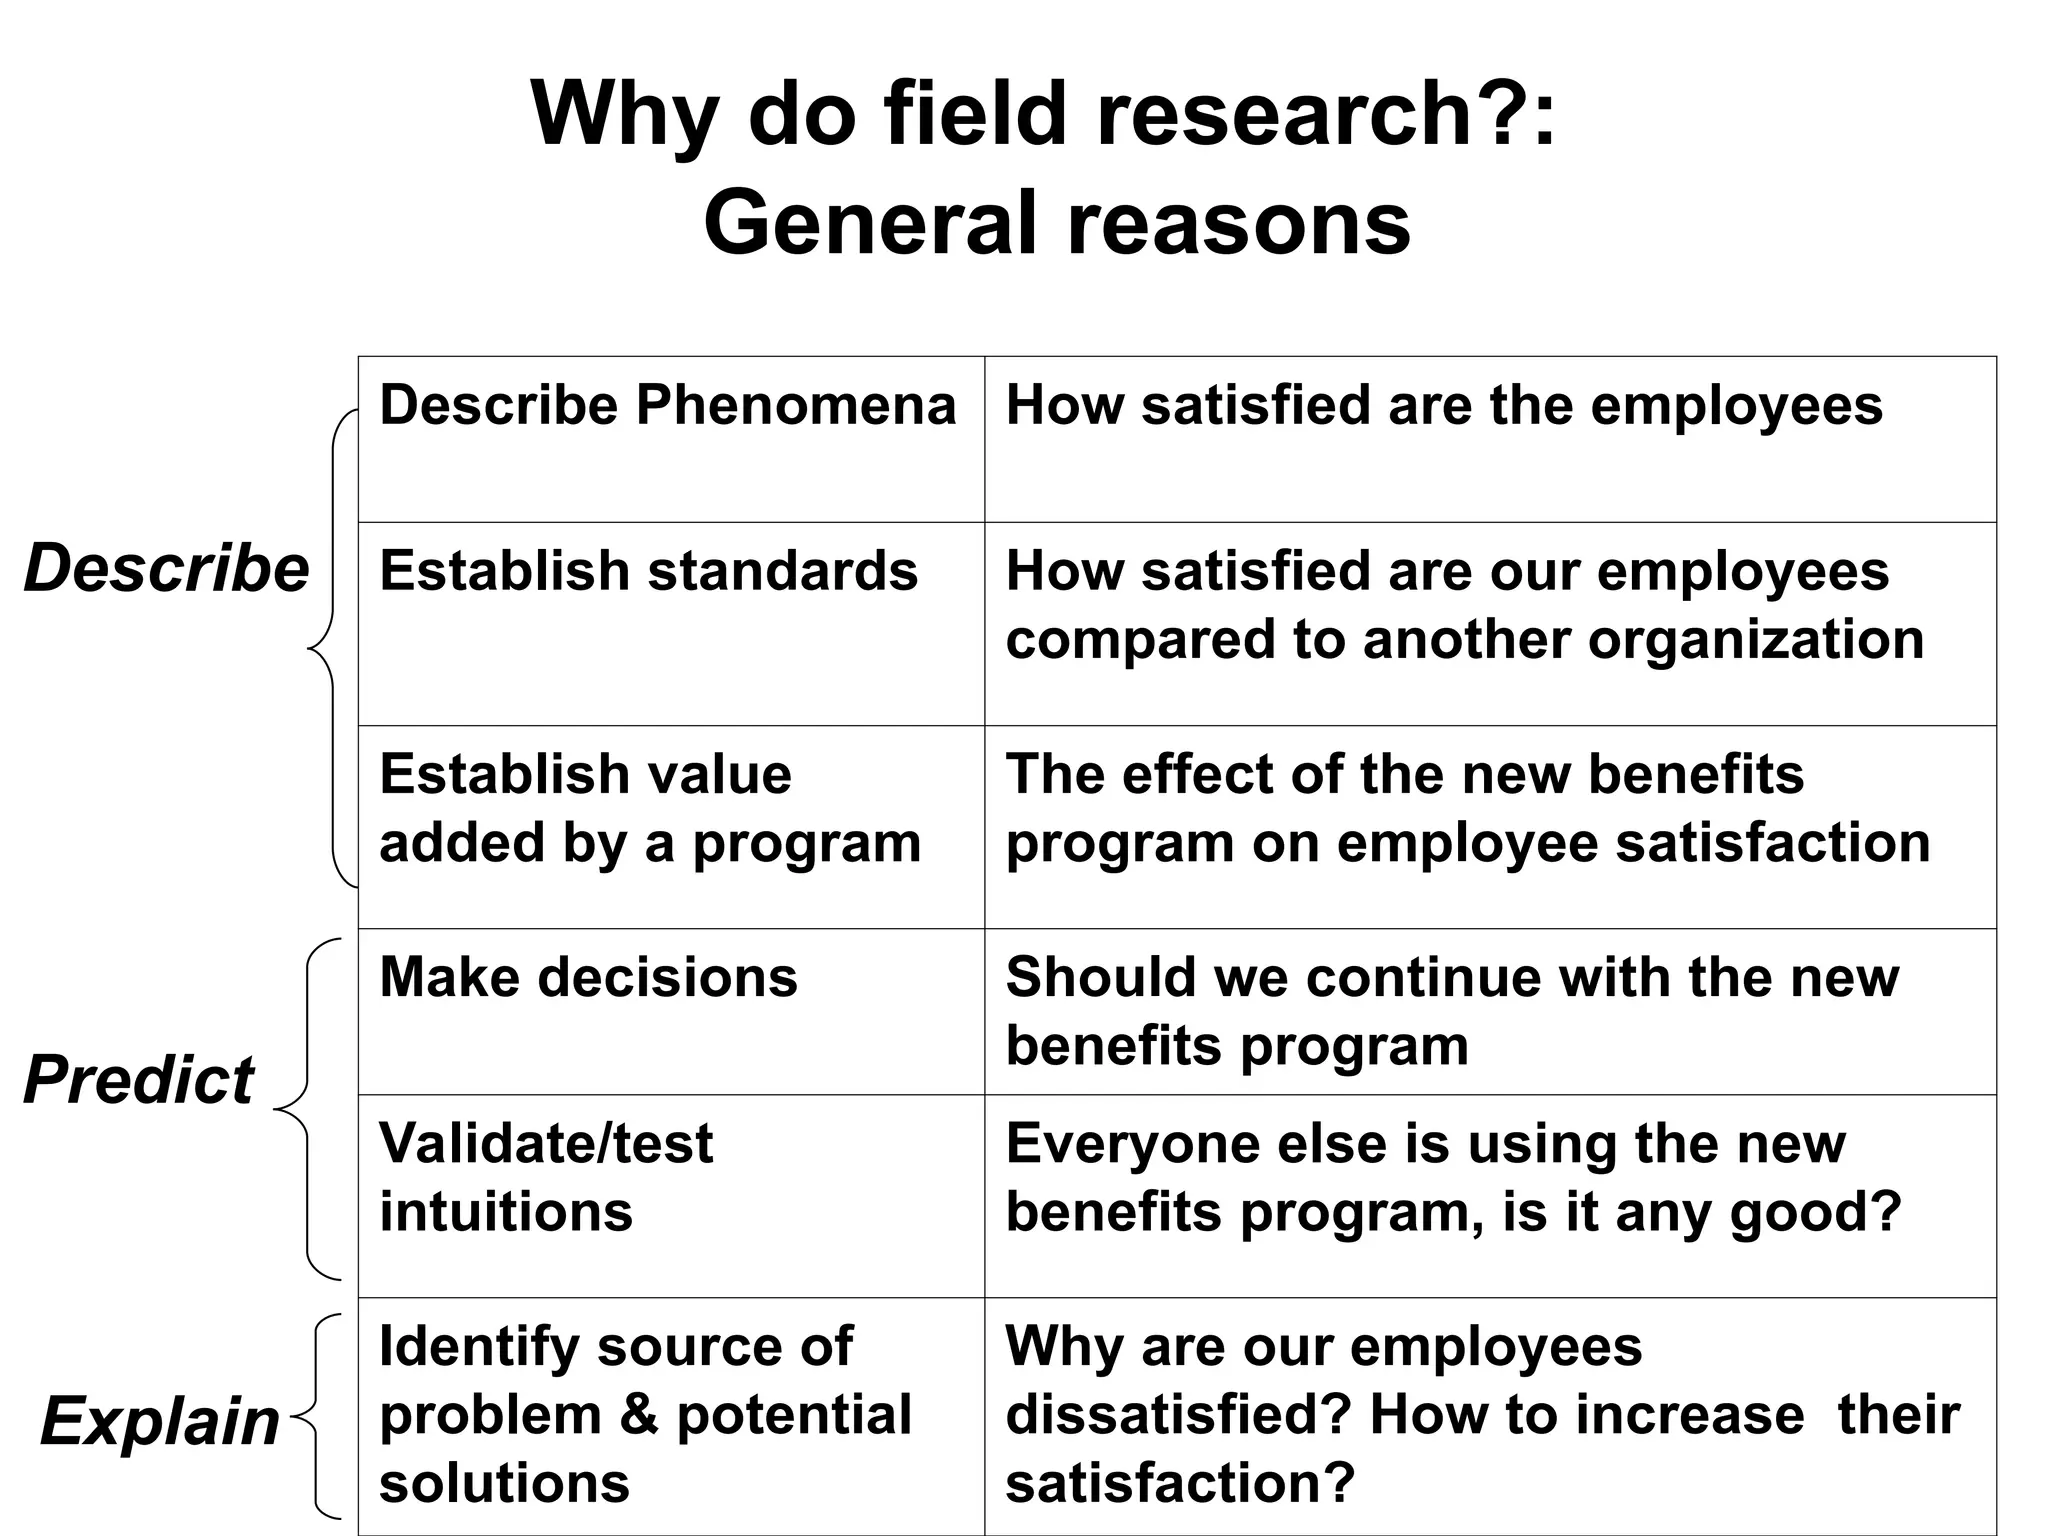
Why do fieldresearch?:
General reasons
Describe Phenomena How satisfied are the employees
Establish standards How satisfied are our employees
compared to another organization
Establish value
added by a program
The effect of the new benefits
program on employee satisfaction
Make decisions Should we continue with the new
benefits program
Validate/test
intuitions
Everyone else is using the new
benefits program, is it any good?
Identify source of
problem & potential
solutions
Why are our employees
dissatisfied? How to increase their
satisfaction?
Describe
Predict
Explain
8.
• Type oforganizational change & development
• E.g., self & peer evaluation of oral presentation
(Radhakrishnan & Yang, 2006)
• Two-way (symbolic) communication channel
between employees & organization via content
and conduct
– e.g., UT Employee Survey
• Cox, T. Jr (2001). Creating the Multicultural
Organization: A Strategy for Capturing the Power
of Diversity San Francisco, CA: Jossey Bass
Why do field research?
Organization-specific reasons
9.
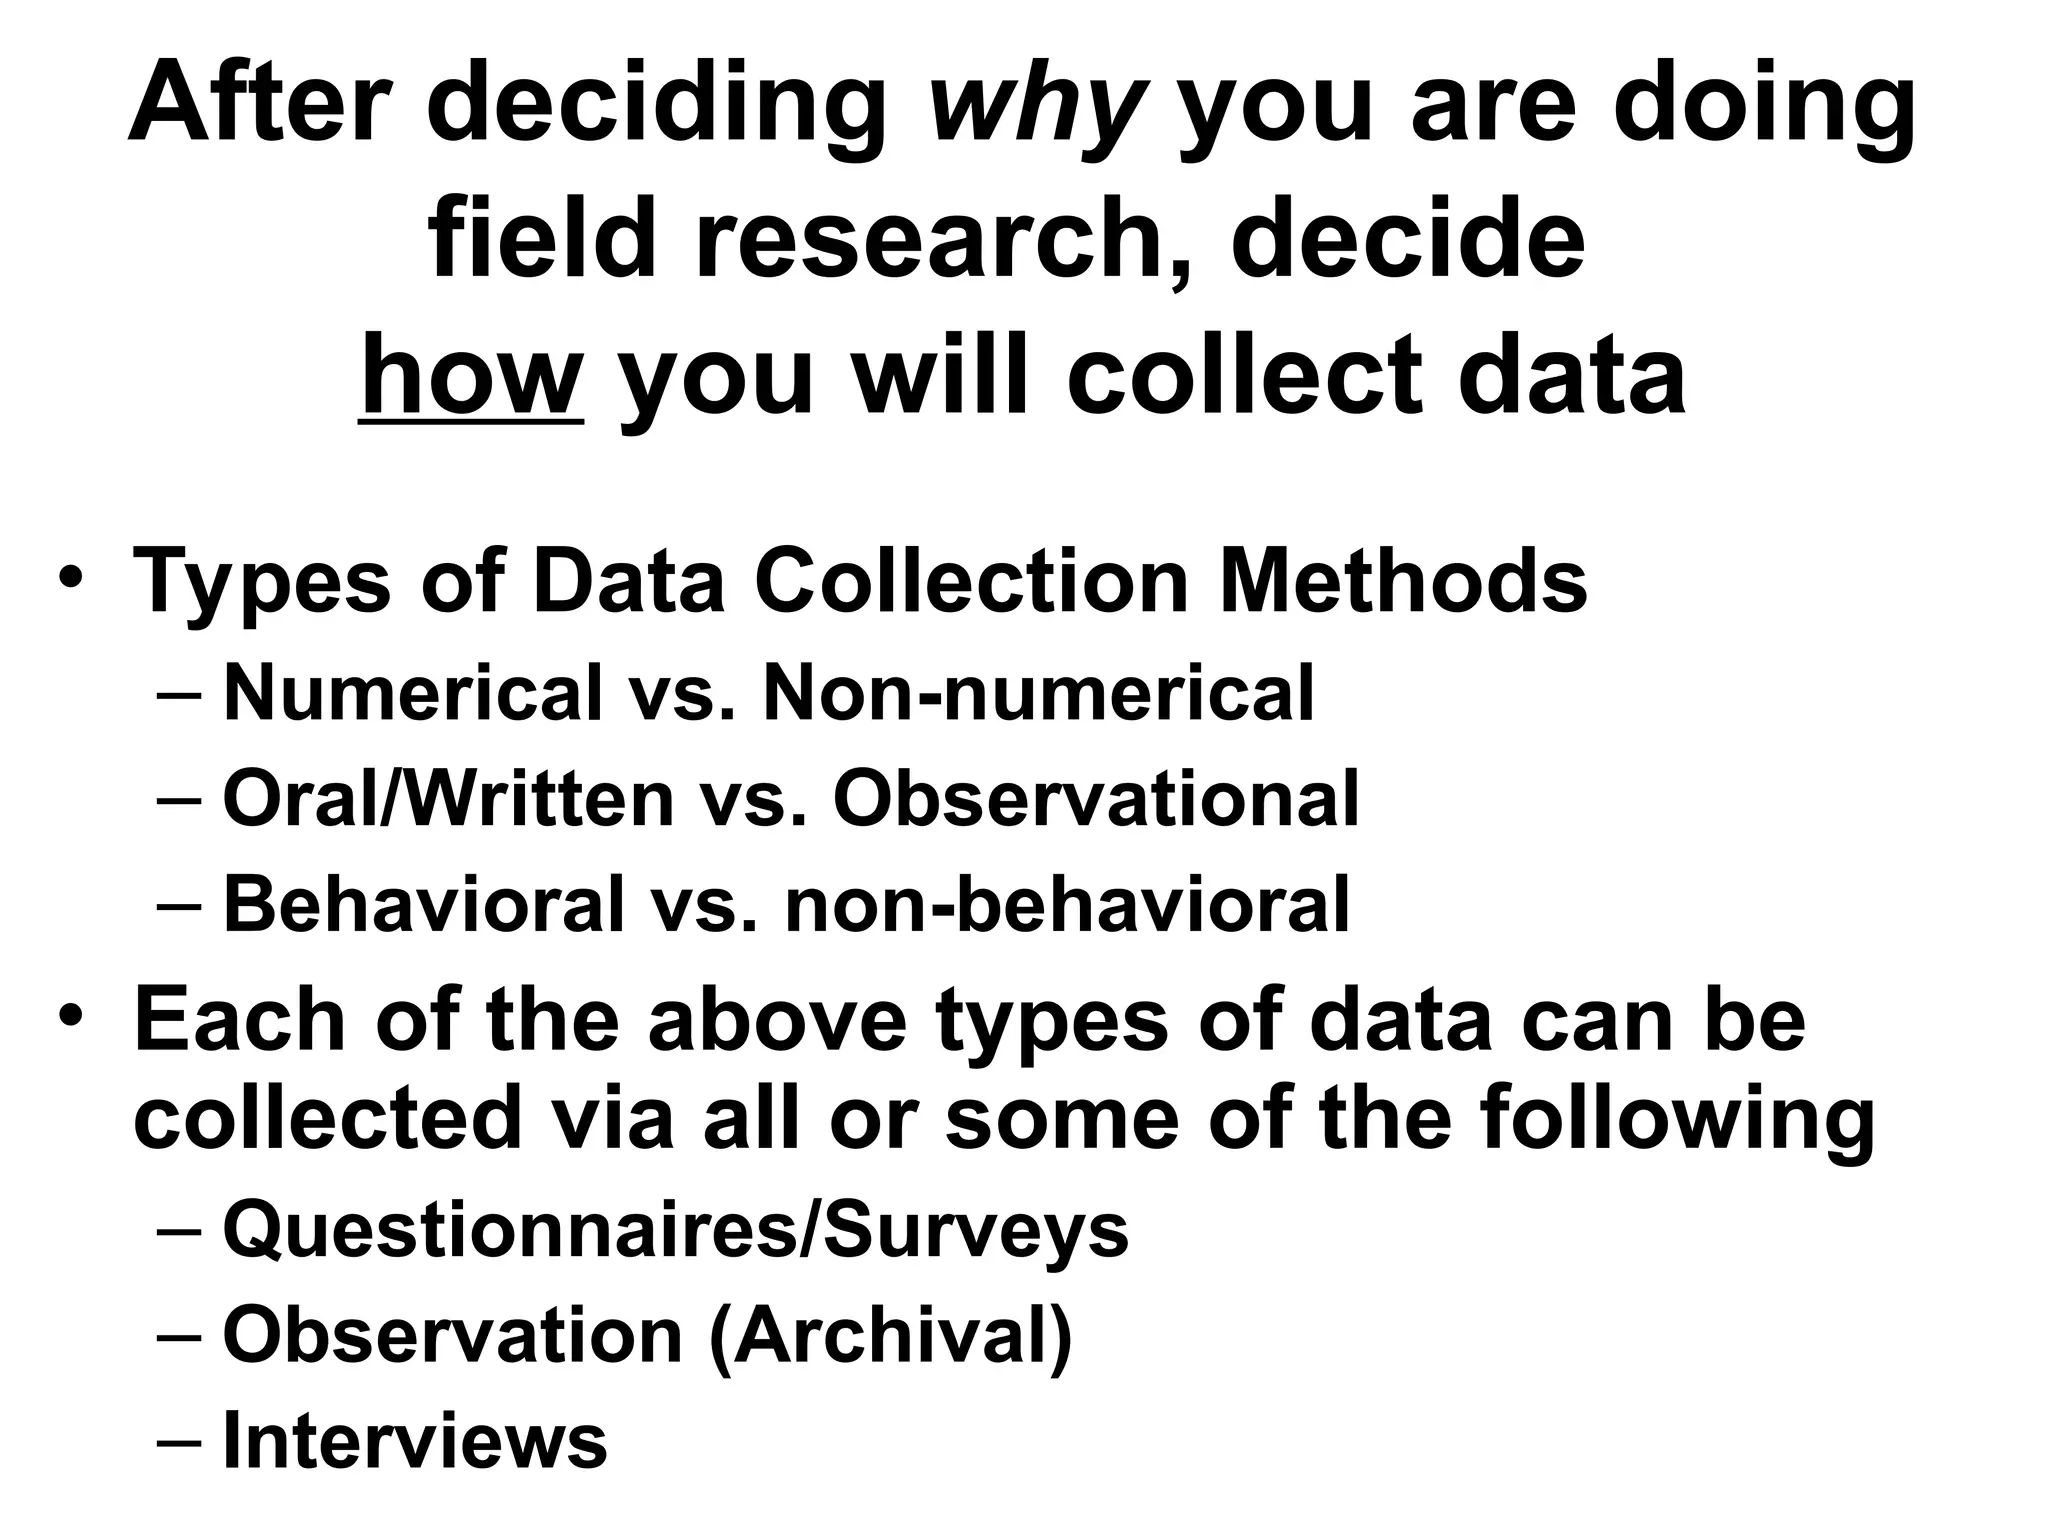
After deciding whyyou are doing
field research, decide
how you will collect data
• Types of Data Collection Methods
– Numerical vs. Non-numerical
– Oral/Written vs. Observational
– Behavioral vs. non-behavioral
• Each of the above types of data can be
collected via all or some of the following
– Questionnaires/Surveys
– Observation (Archival)
– Interviews
10.
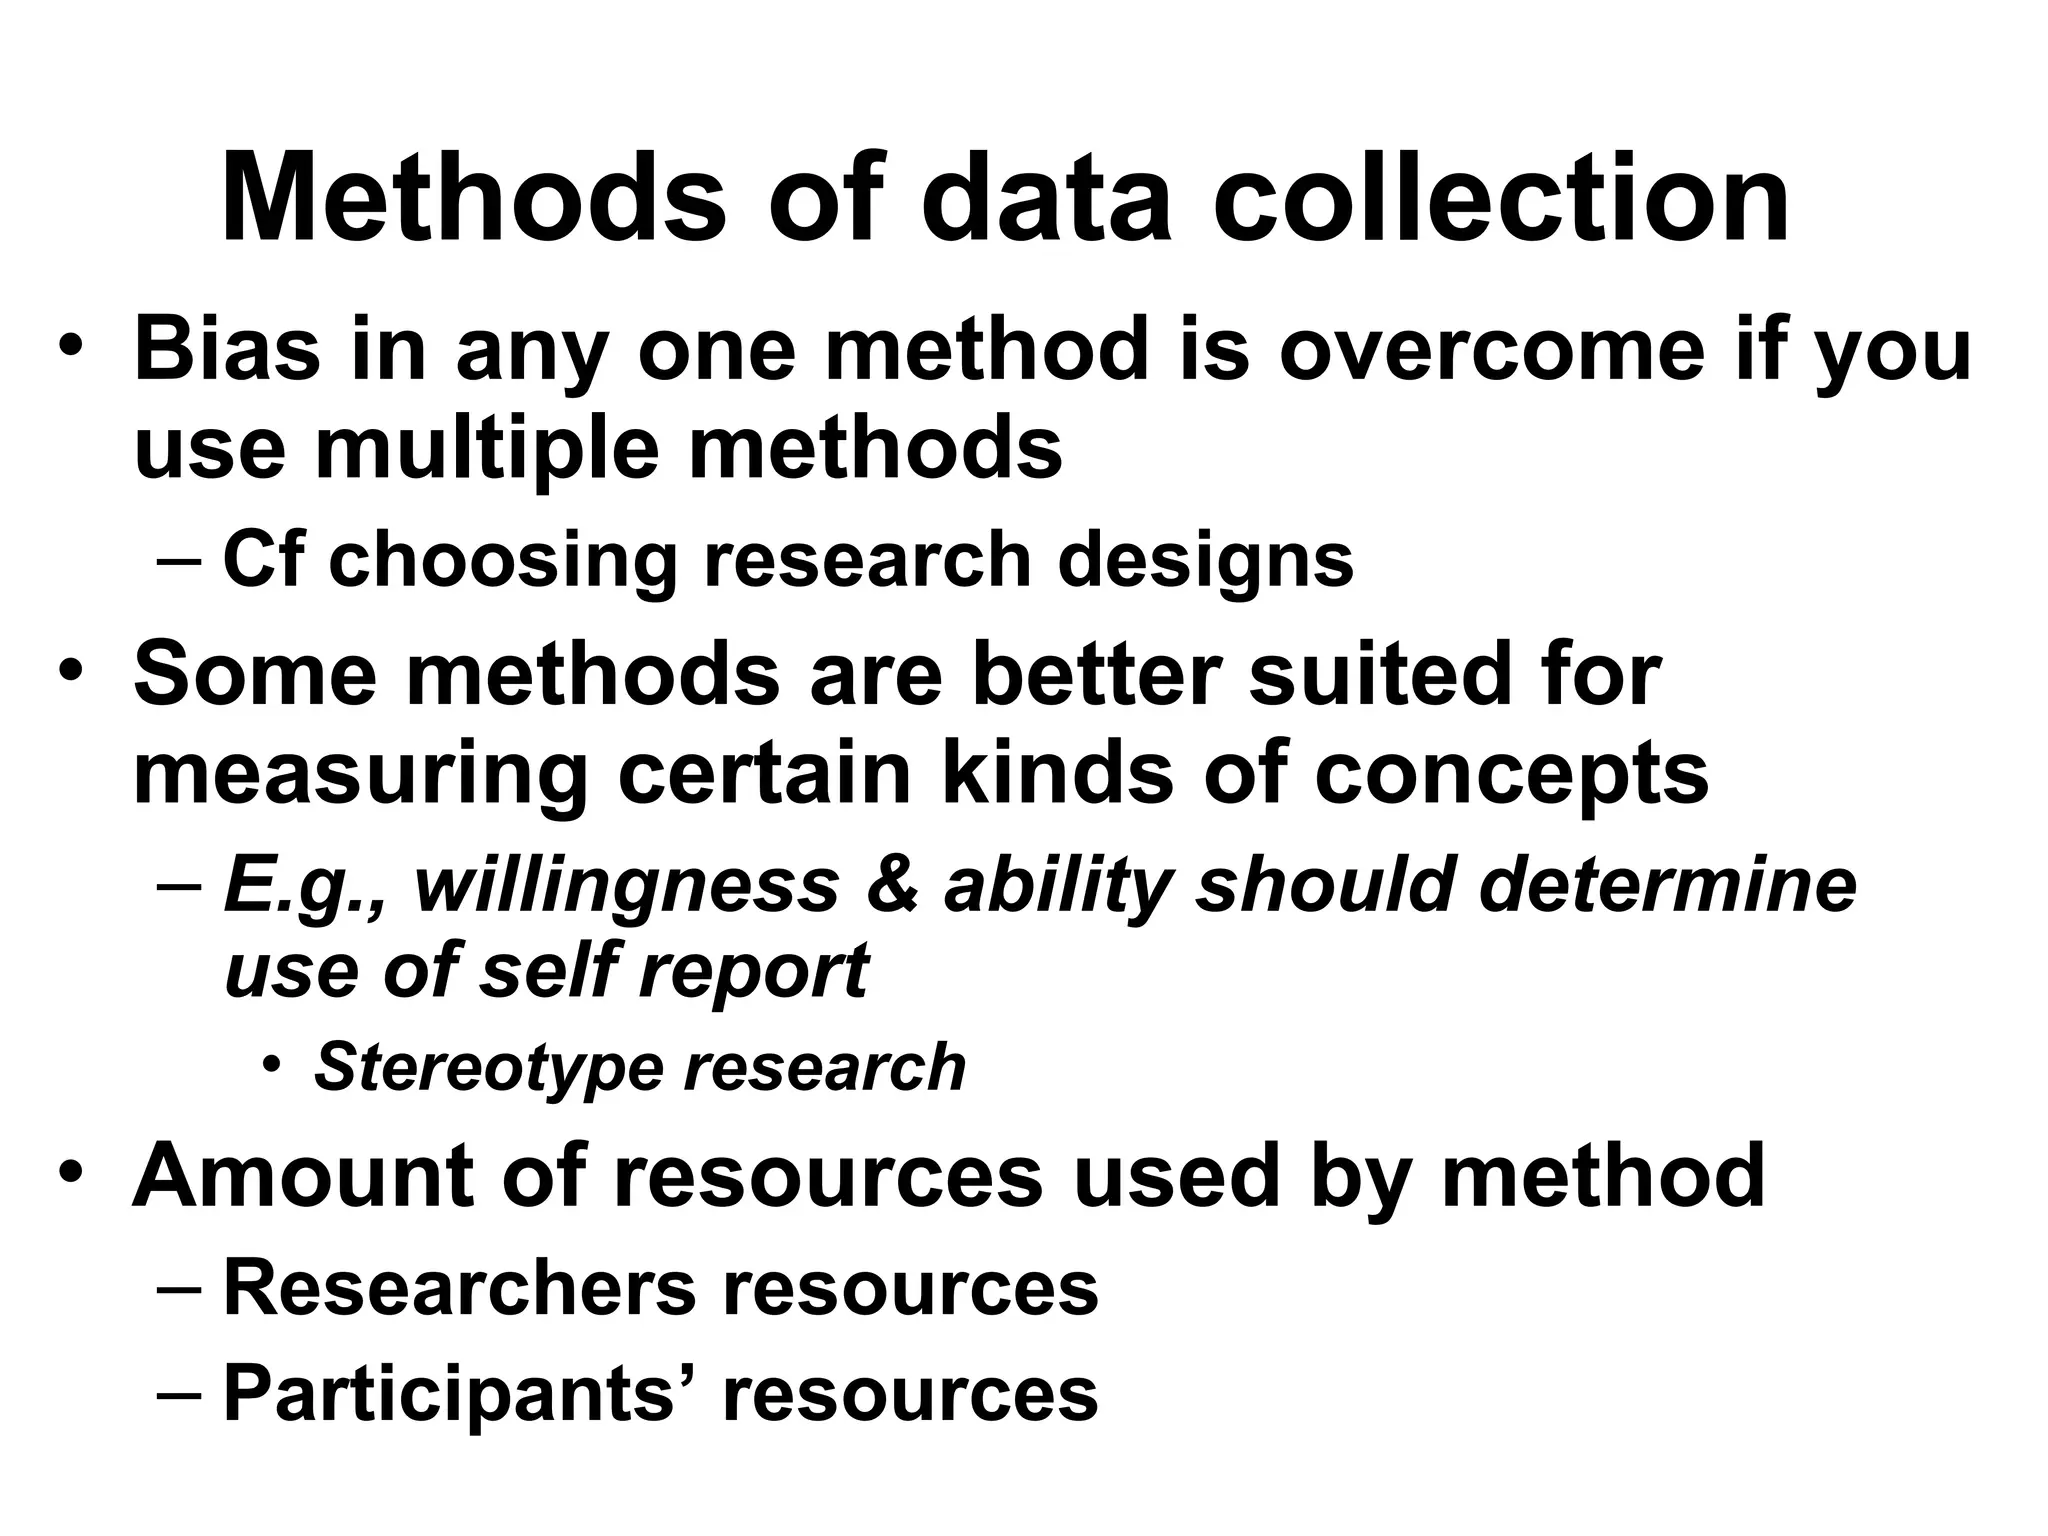
Methods of datacollection
• Bias in any one method is overcome if you
use multiple methods
– Cf choosing research designs
• Some methods are better suited for
measuring certain kinds of concepts
– E.g., willingness & ability should determine
use of self report
• Stereotype research
• Amount of resources used by method
– Researchers resources
– Participants’ resources
11.
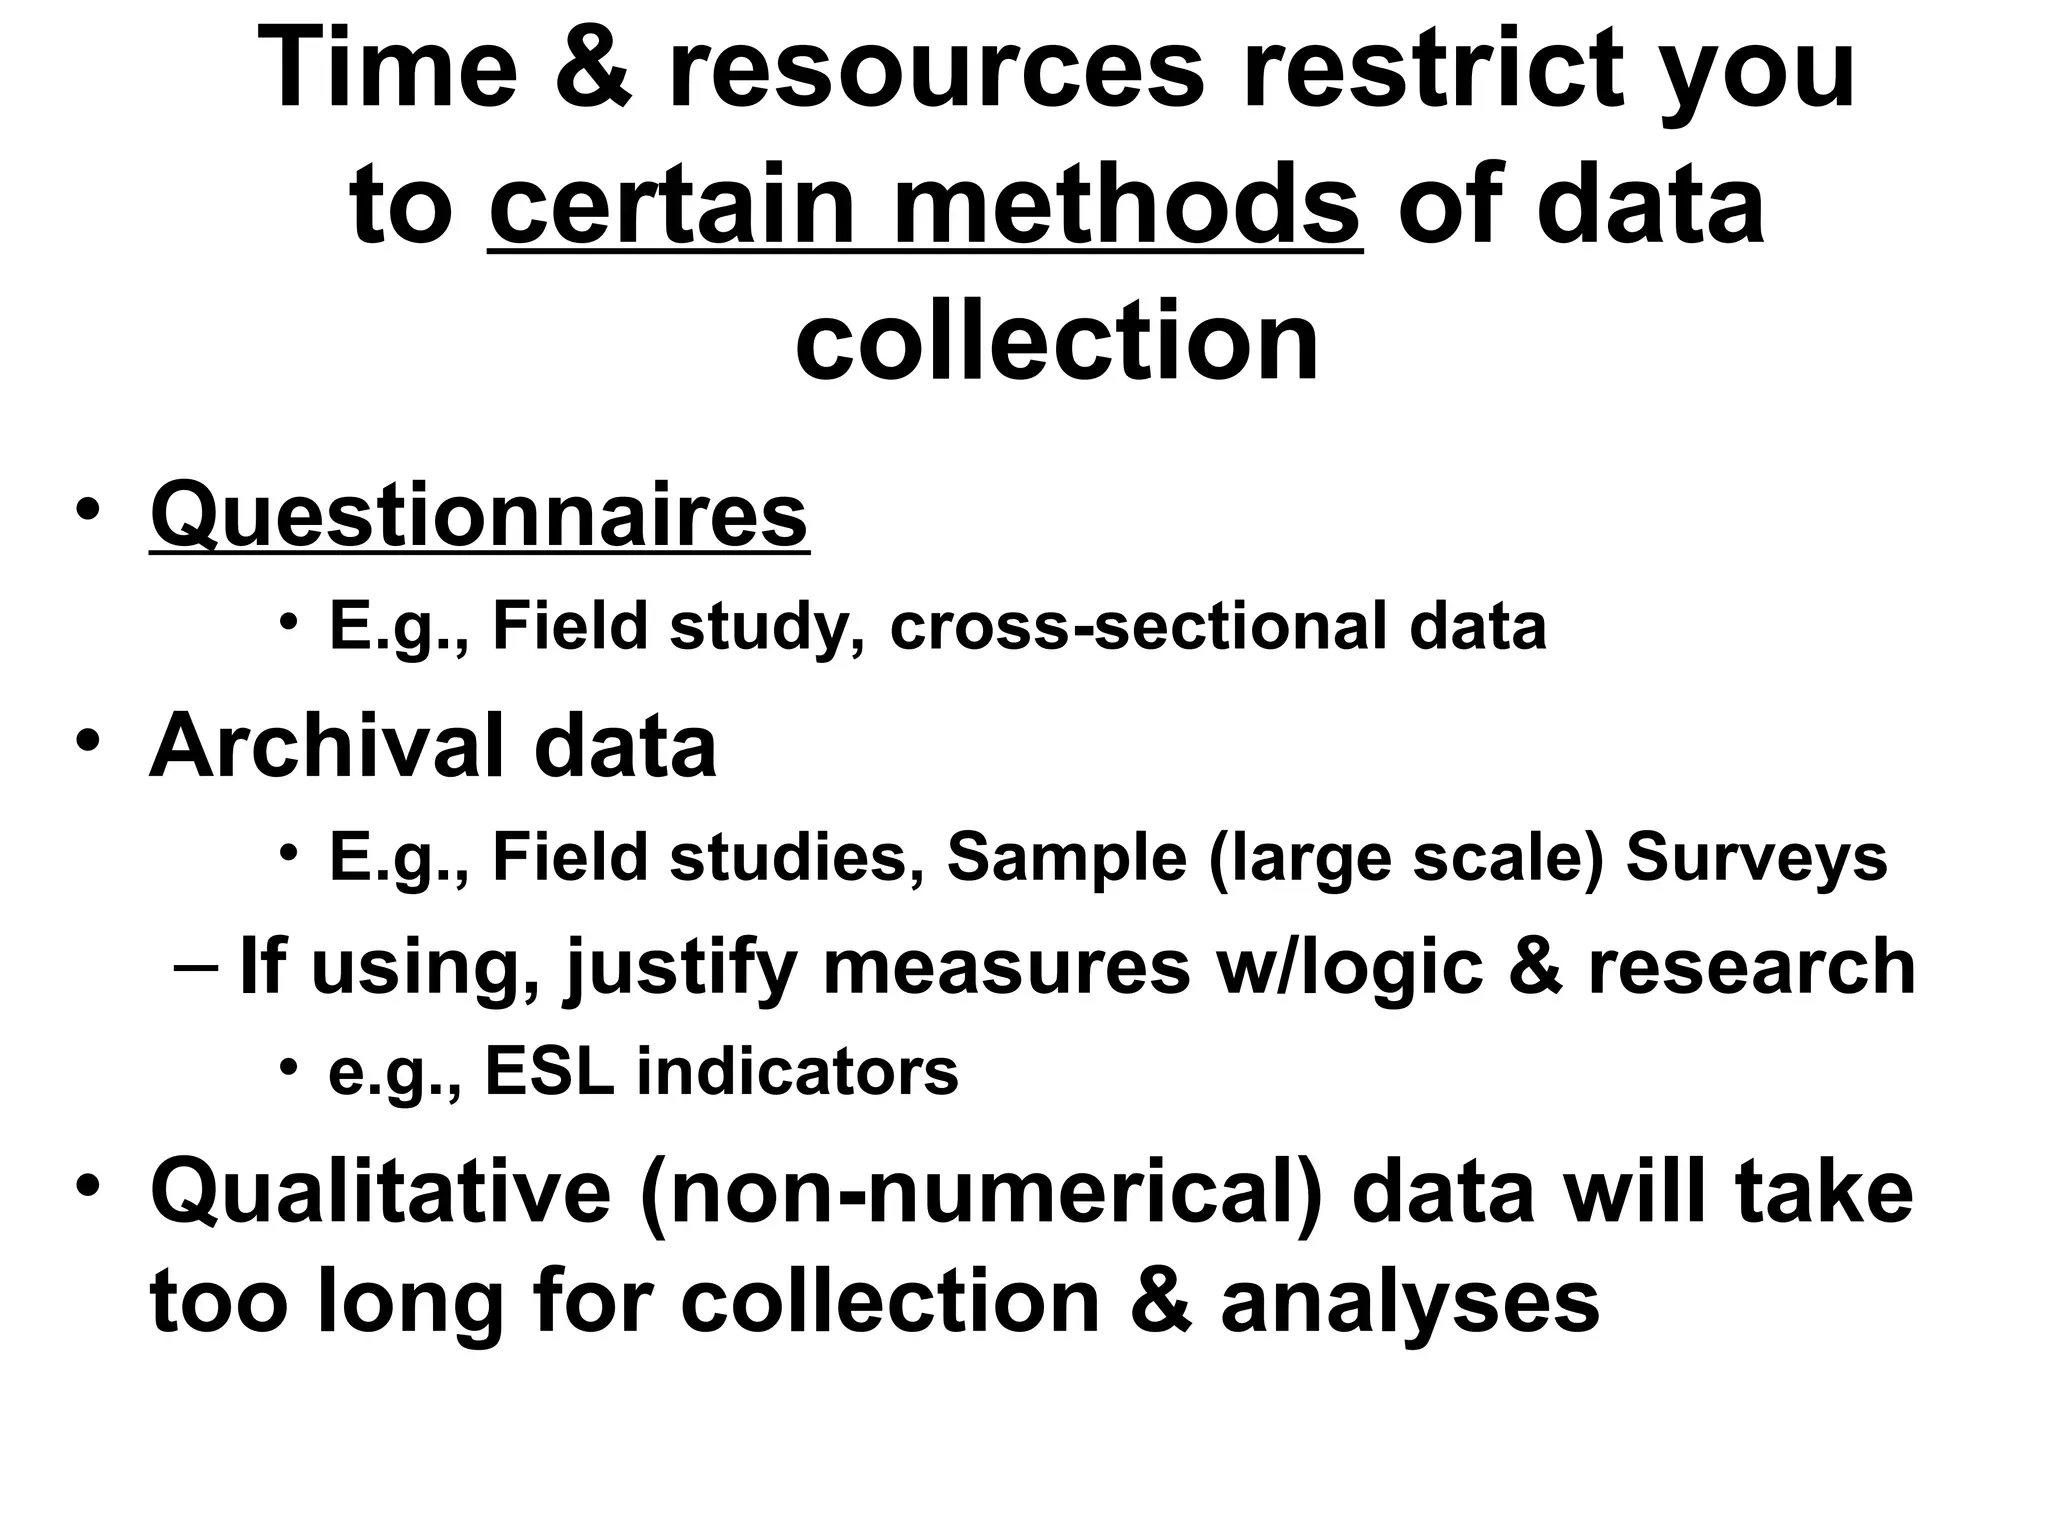
Time & resourcesrestrict you
to certain methods of data
collection
• Questionnaires
• E.g., Field study, cross-sectional data
• Archival data
• E.g., Field studies, Sample (large scale) Surveys
– If using, justify measures w/logic & research
• e.g., ESL indicators
• Qualitative (non-numerical) data will take
too long for collection & analyses
12.
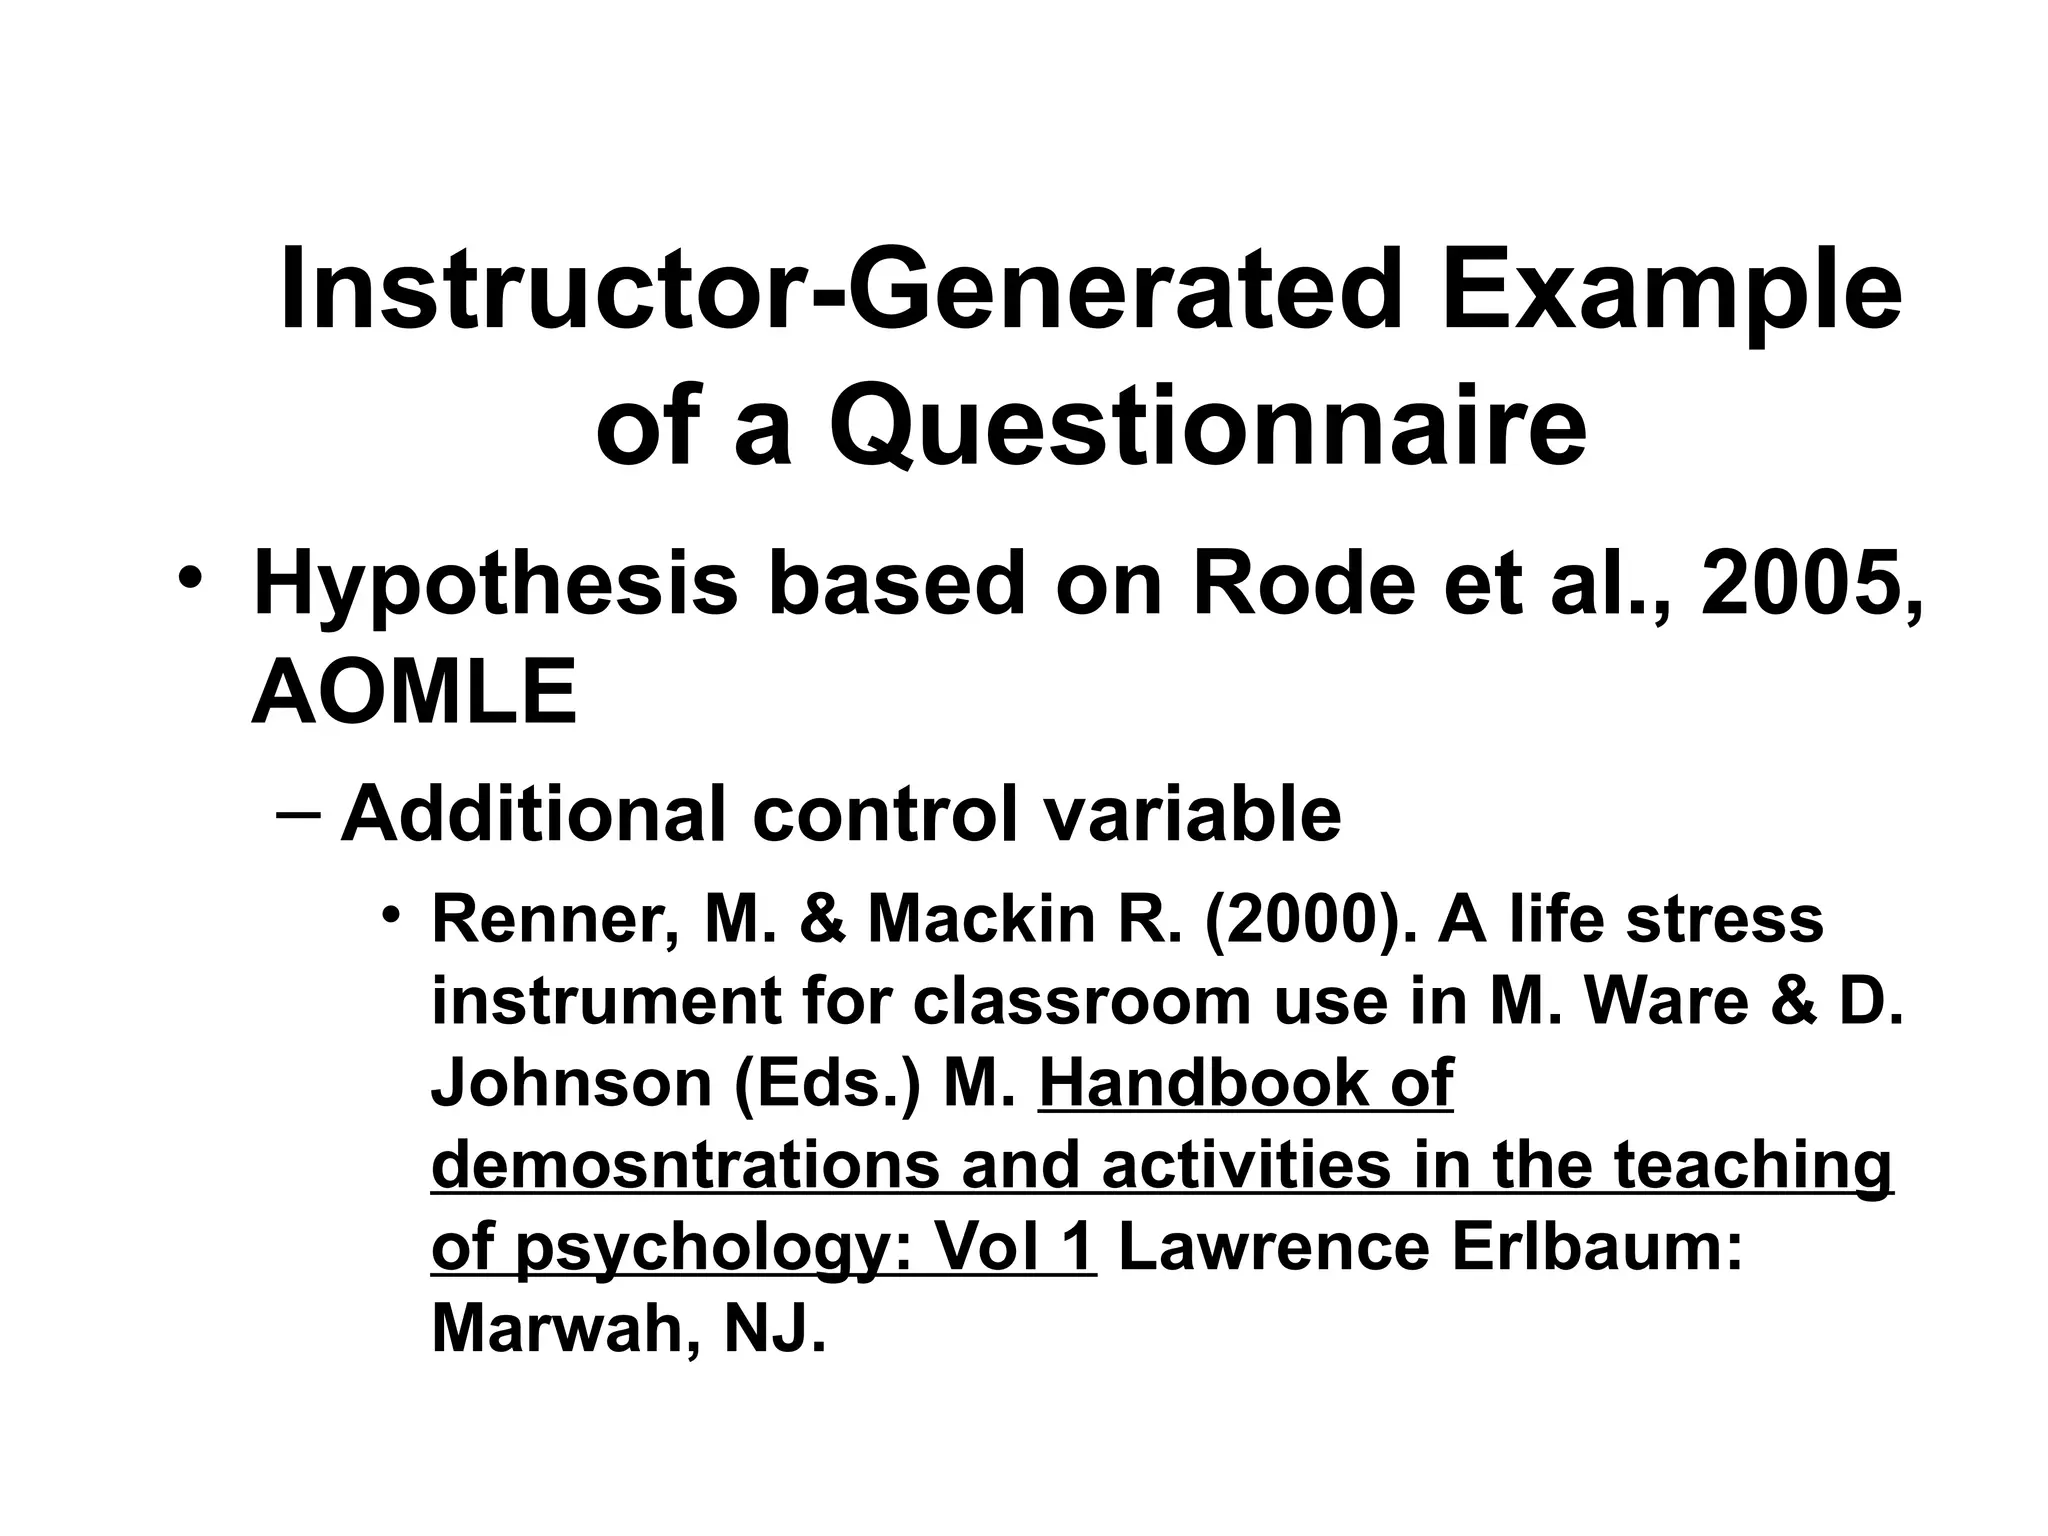
Instructor-Generated Example
of aQuestionnaire
• Hypothesis based on Rode et al., 2005,
AOMLE
– Additional control variable
• Renner, M. & Mackin R. (2000). A life stress
instrument for classroom use in M. Ware & D.
Johnson (Eds.) M. Handbook of
demosntrations and activities in the teaching
of psychology: Vol 1 Lawrence Erlbaum:
Marwah, NJ.
13.
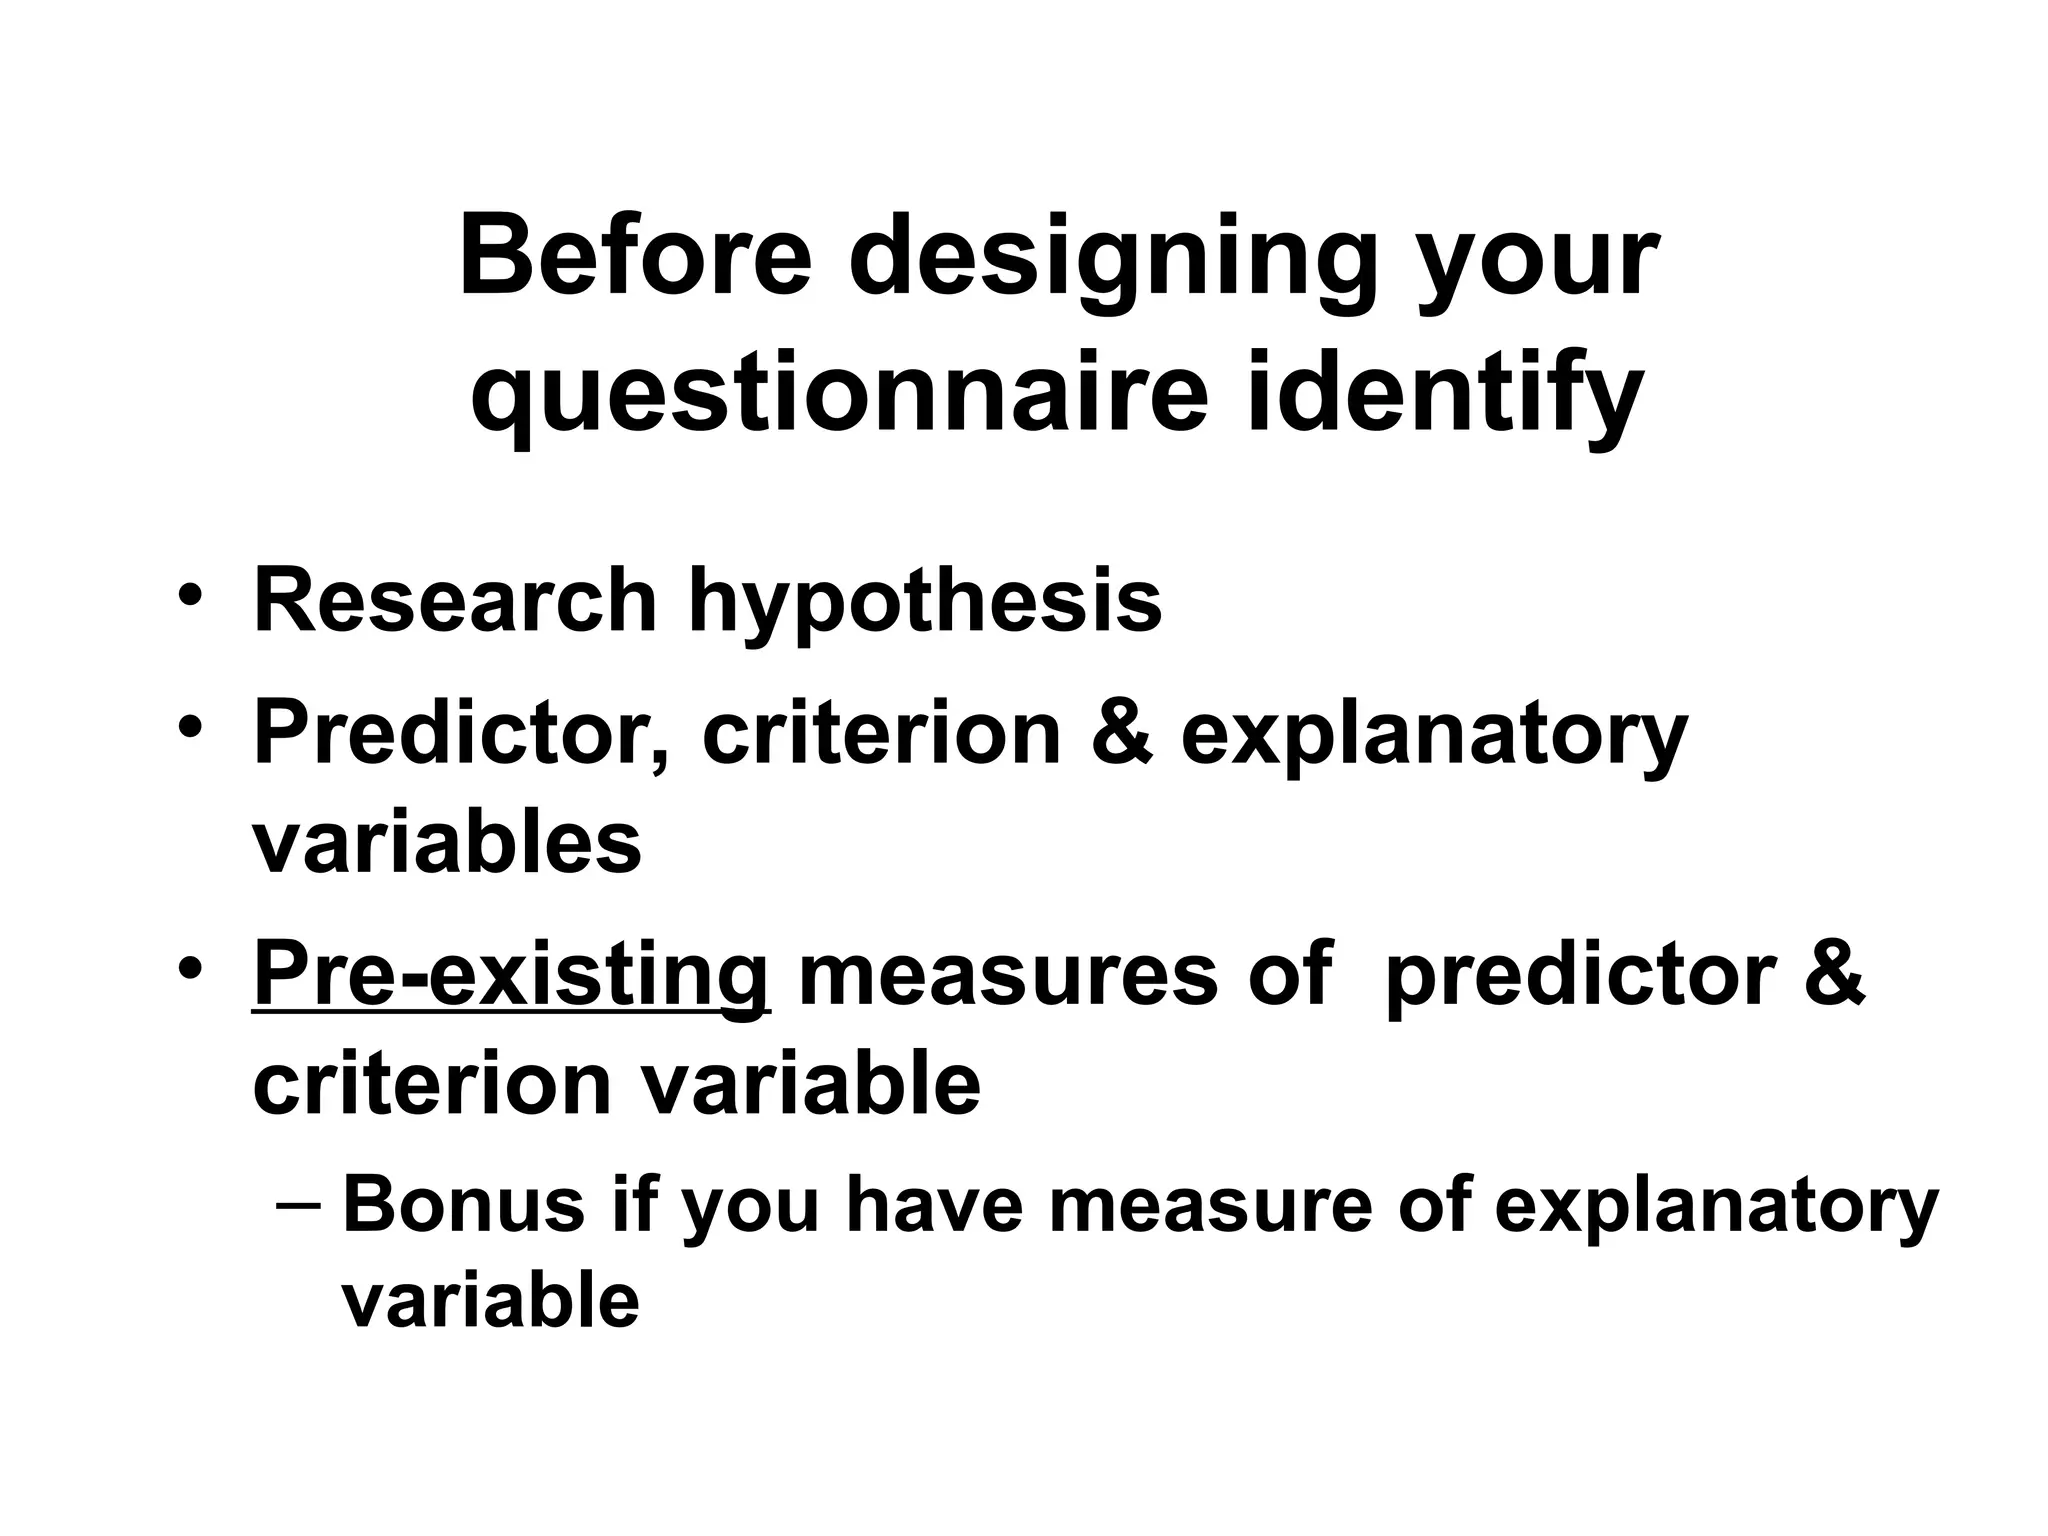
Before designing your
questionnaireidentify
• Research hypothesis
• Predictor, criterion & explanatory
variables
• Pre-existing measures of predictor &
criterion variable
– Bonus if you have measure of explanatory
variable
14.
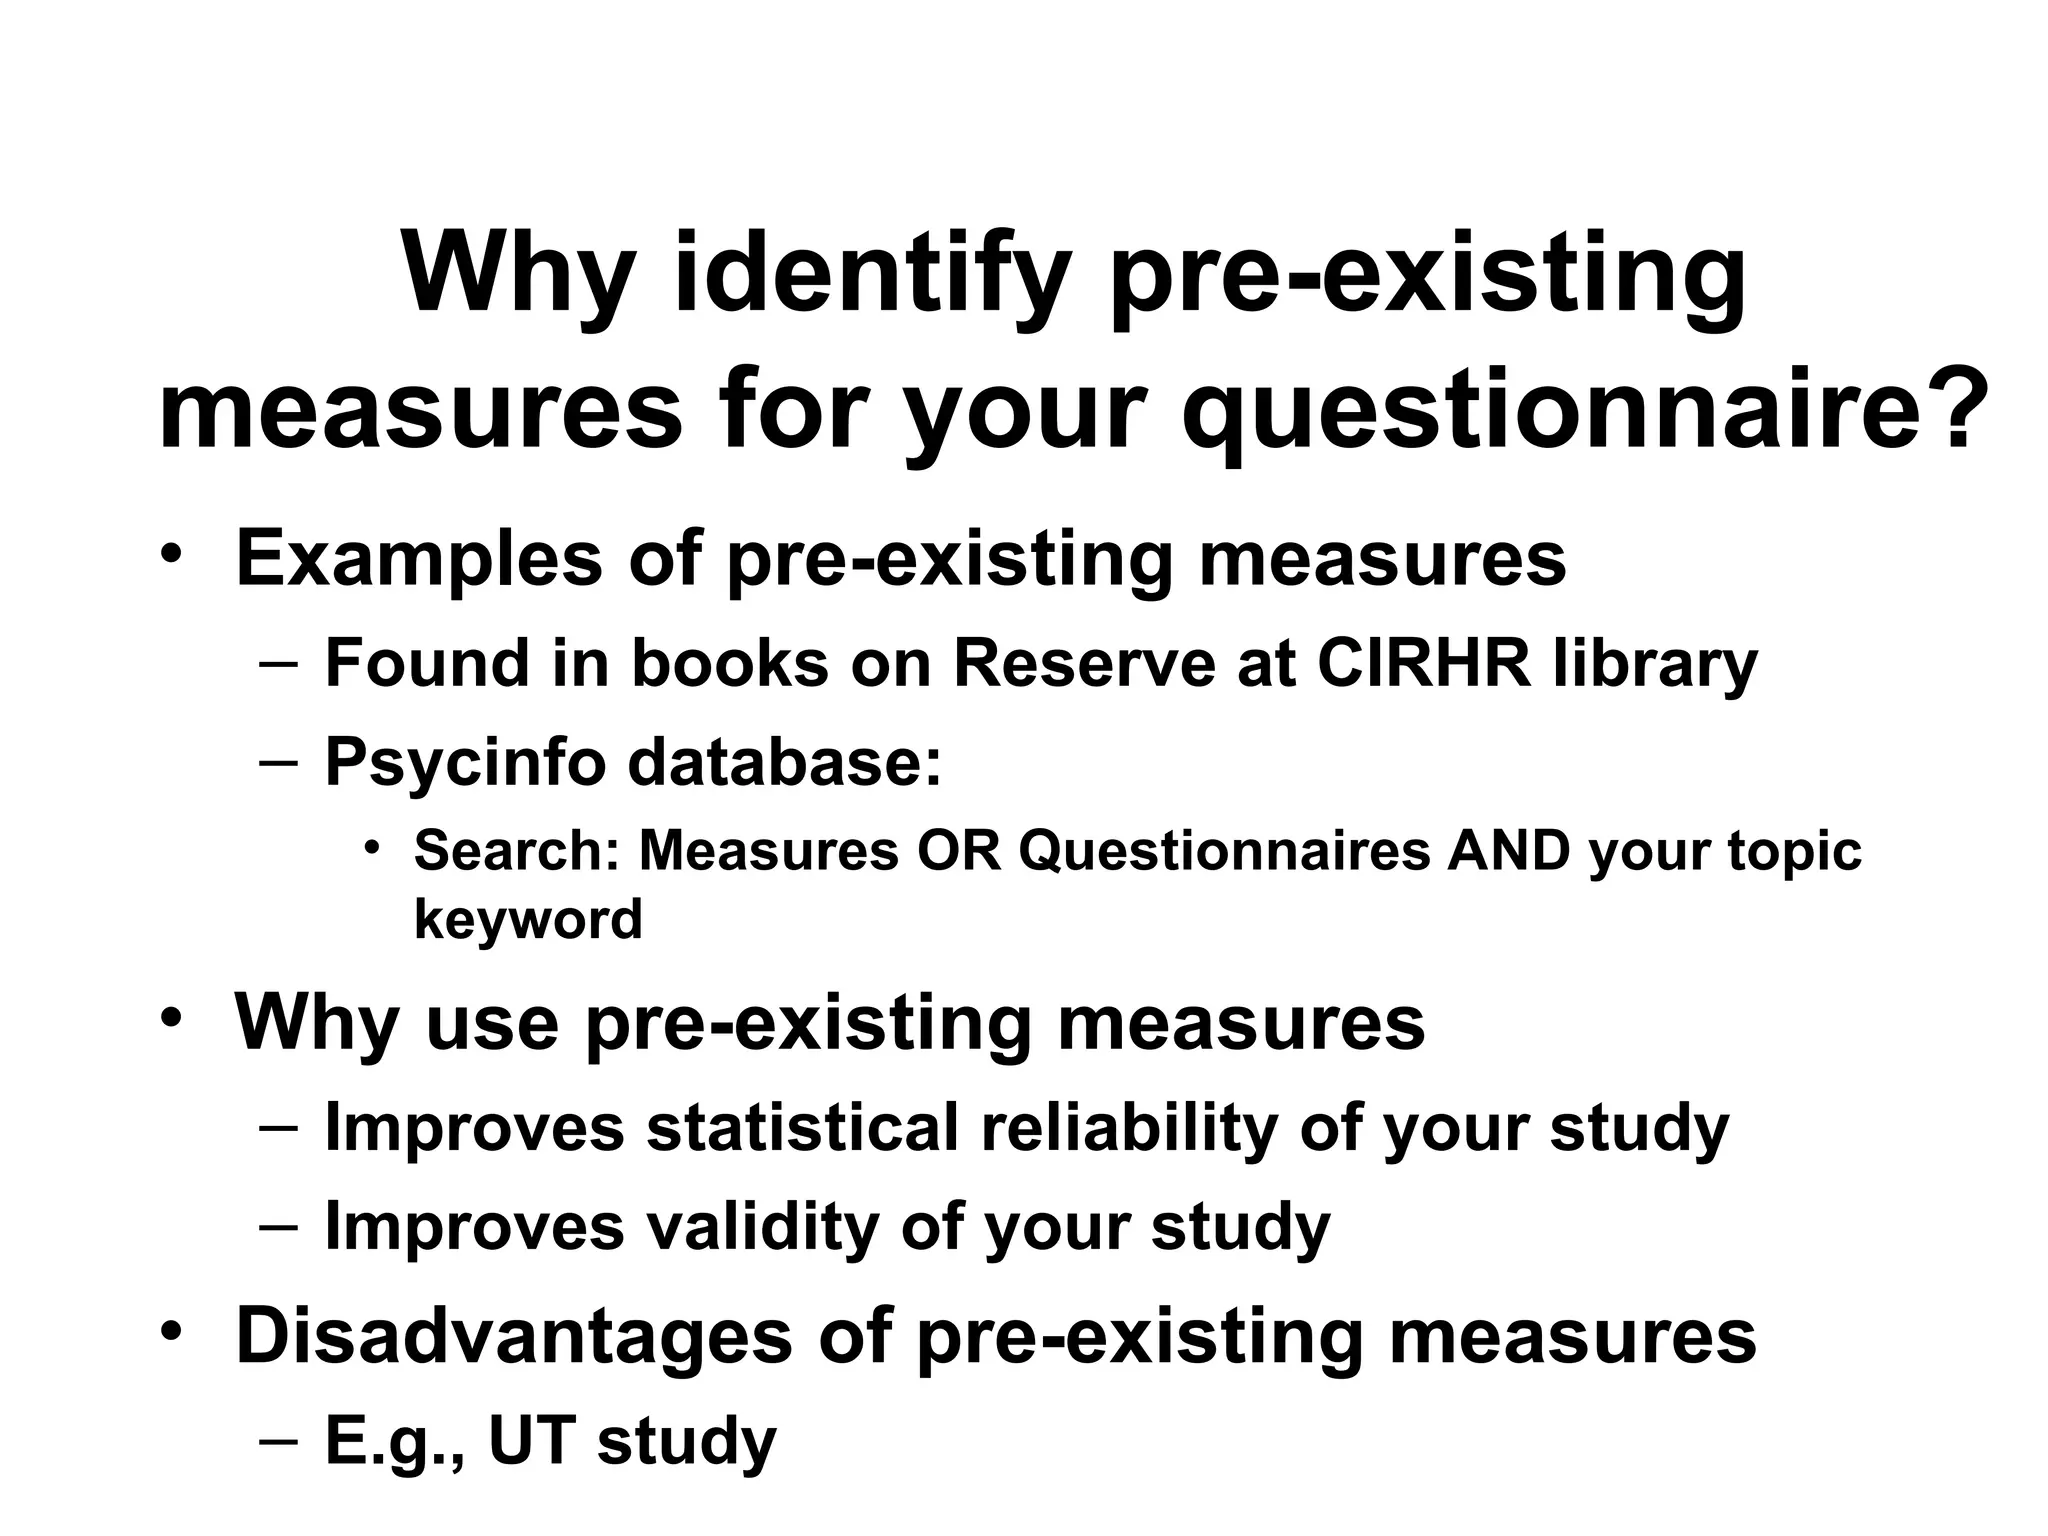
Why identify pre-existing
measuresfor your questionnaire?
• Examples of pre-existing measures
– Found in books on Reserve at CIRHR library
– Psycinfo database:
• Search: Measures OR Questionnaires AND your topic
keyword
• Why use pre-existing measures
– Improves statistical reliability of your study
– Improves validity of your study
• Disadvantages of pre-existing measures
– E.g., UT study
15.
How pre-existing measures
improvevalidity
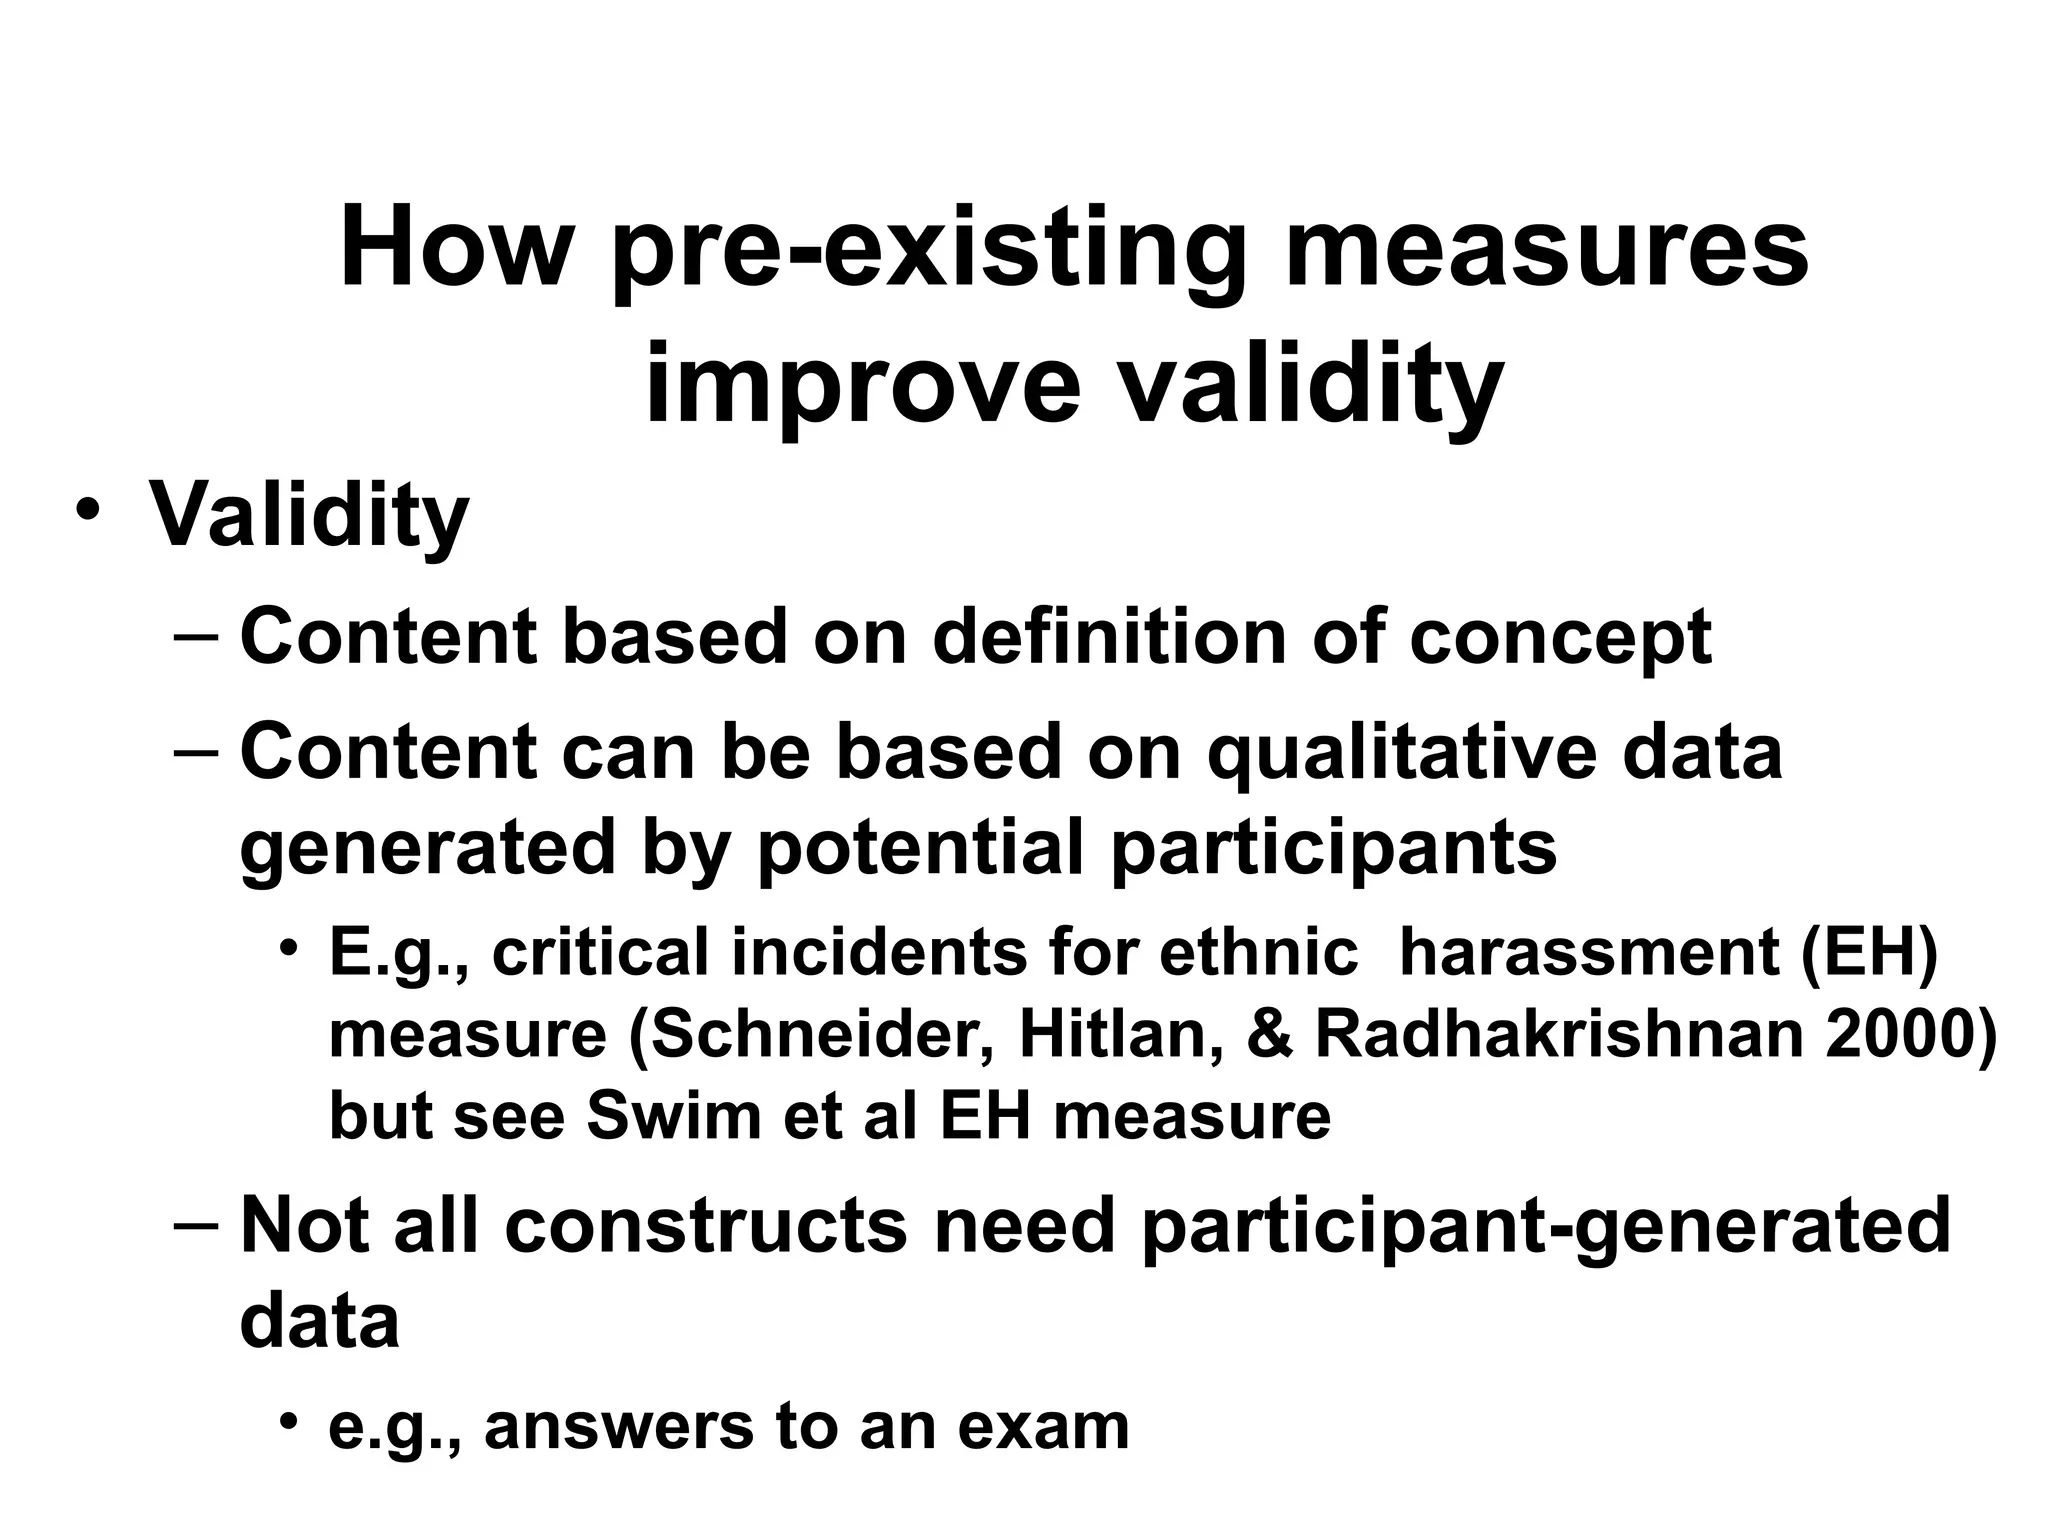
• Validity
– Content based on definition of concept
– Content can be based on qualitative data
generated by potential participants
• E.g., critical incidents for ethnic harassment (EH)
measure (Schneider, Hitlan, & Radhakrishnan 2000)
but see Swim et al EH measure
– Not all constructs need participant-generated
data
• e.g., answers to an exam
16.
How pre-existing measures
improvereliability
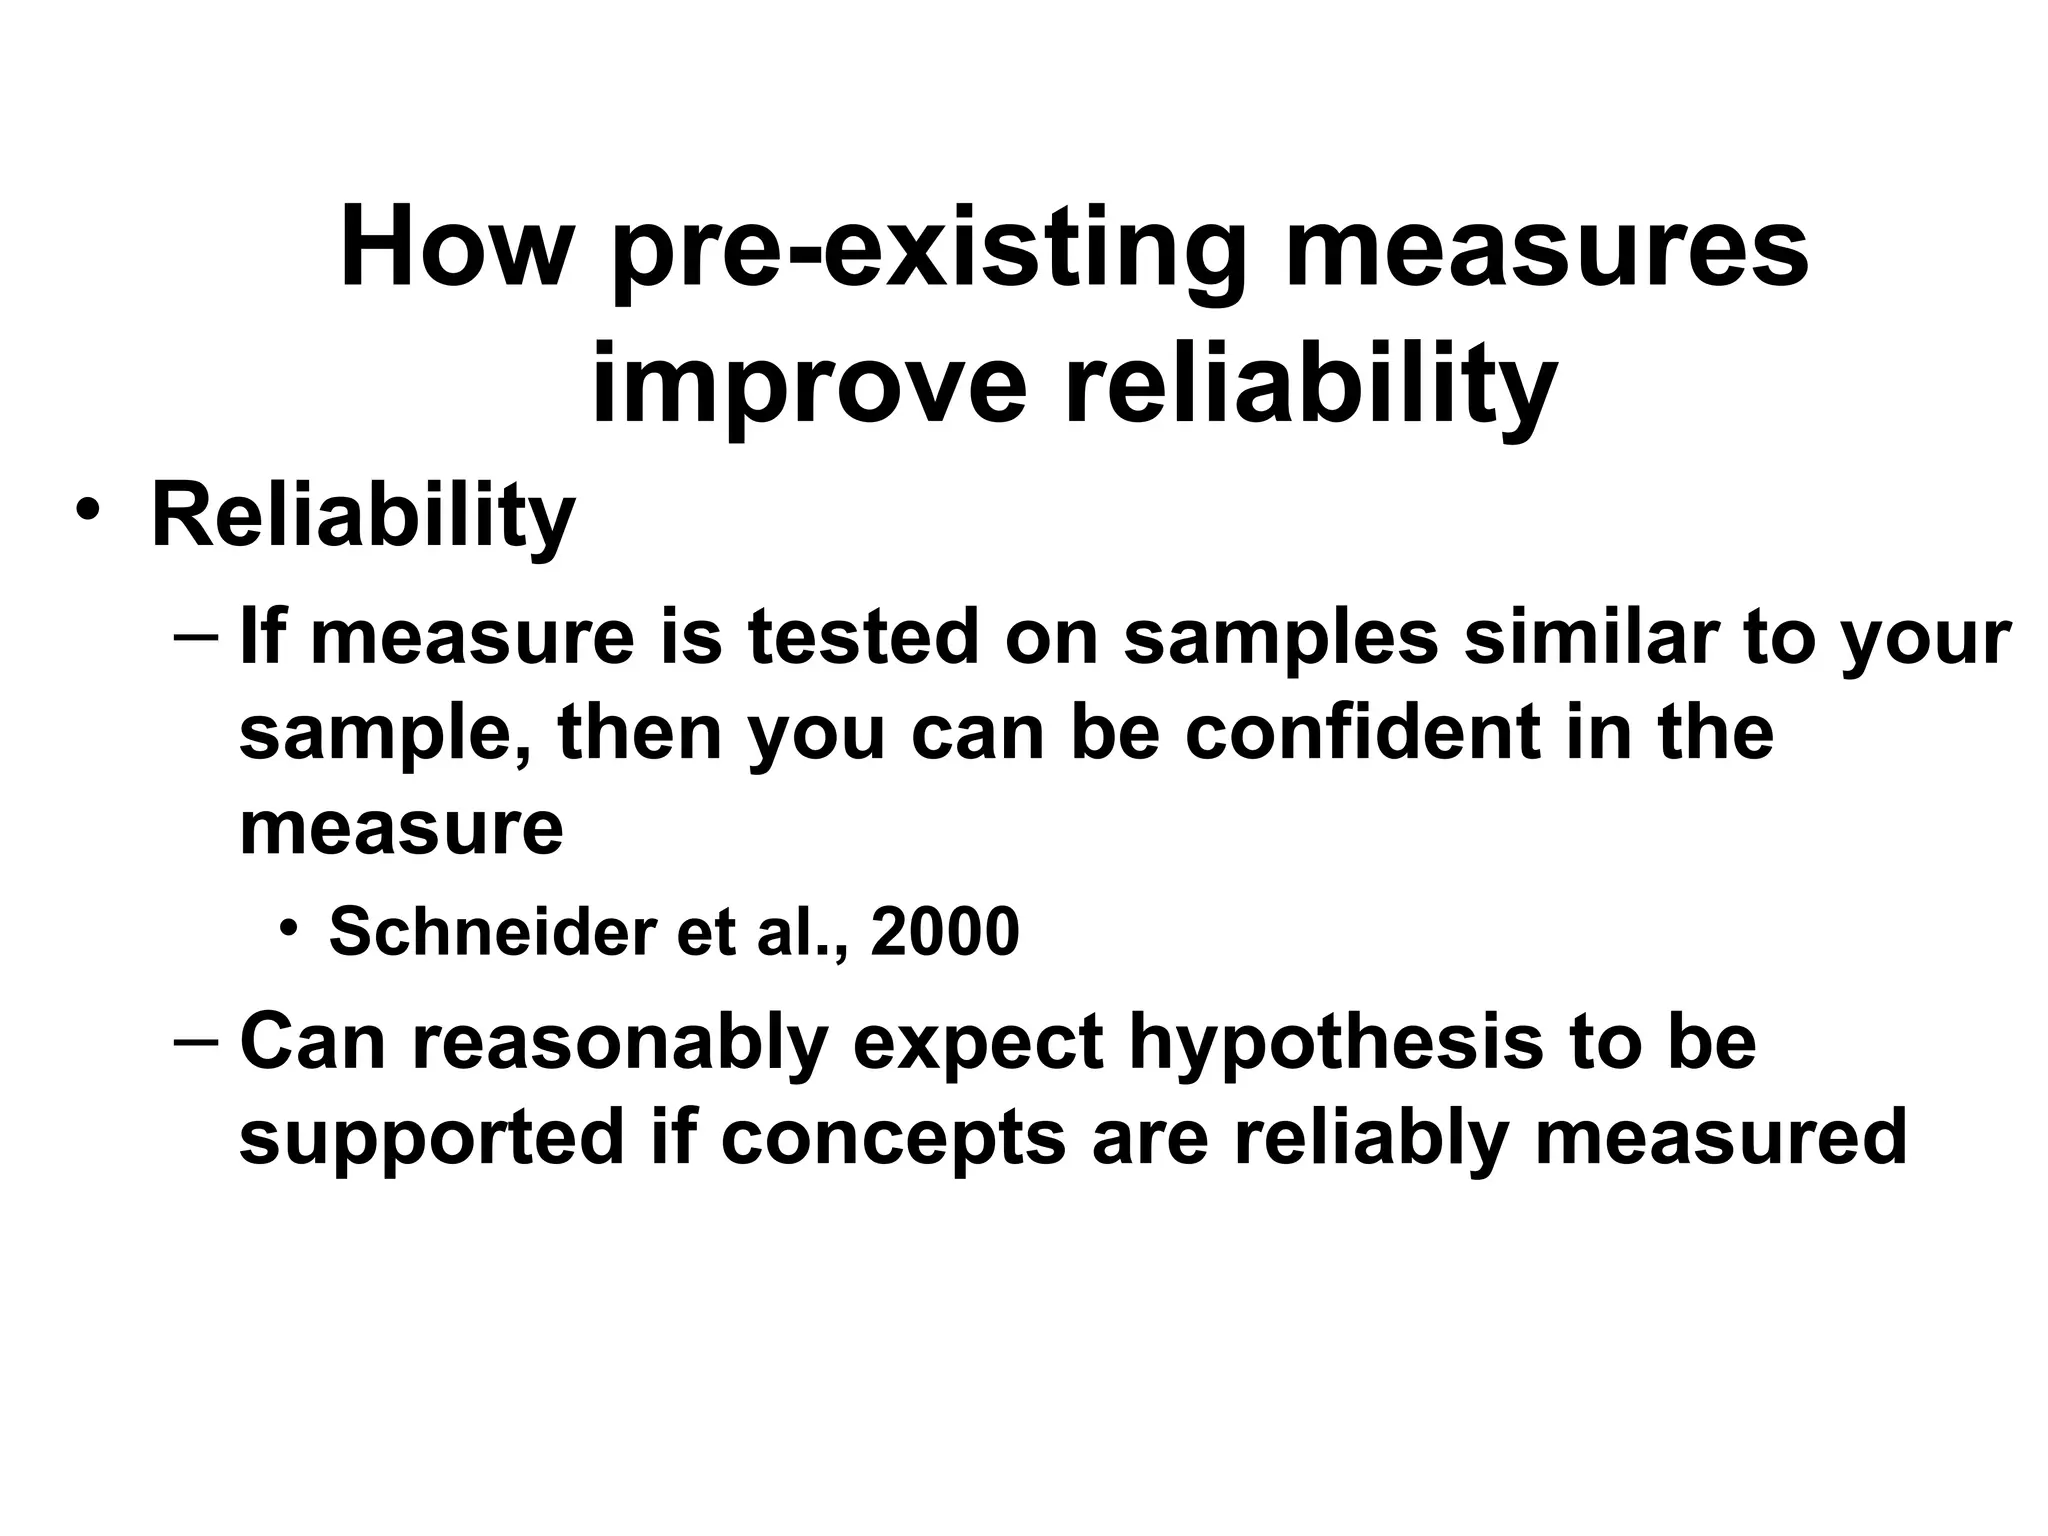
• Reliability
– If measure is tested on samples similar to your
sample, then you can be confident in the
measure
• Schneider et al., 2000
– Can reasonably expect hypothesis to be
supported if concepts are reliably measured
17.
Pre-existing measures usedin
the instructor’s example
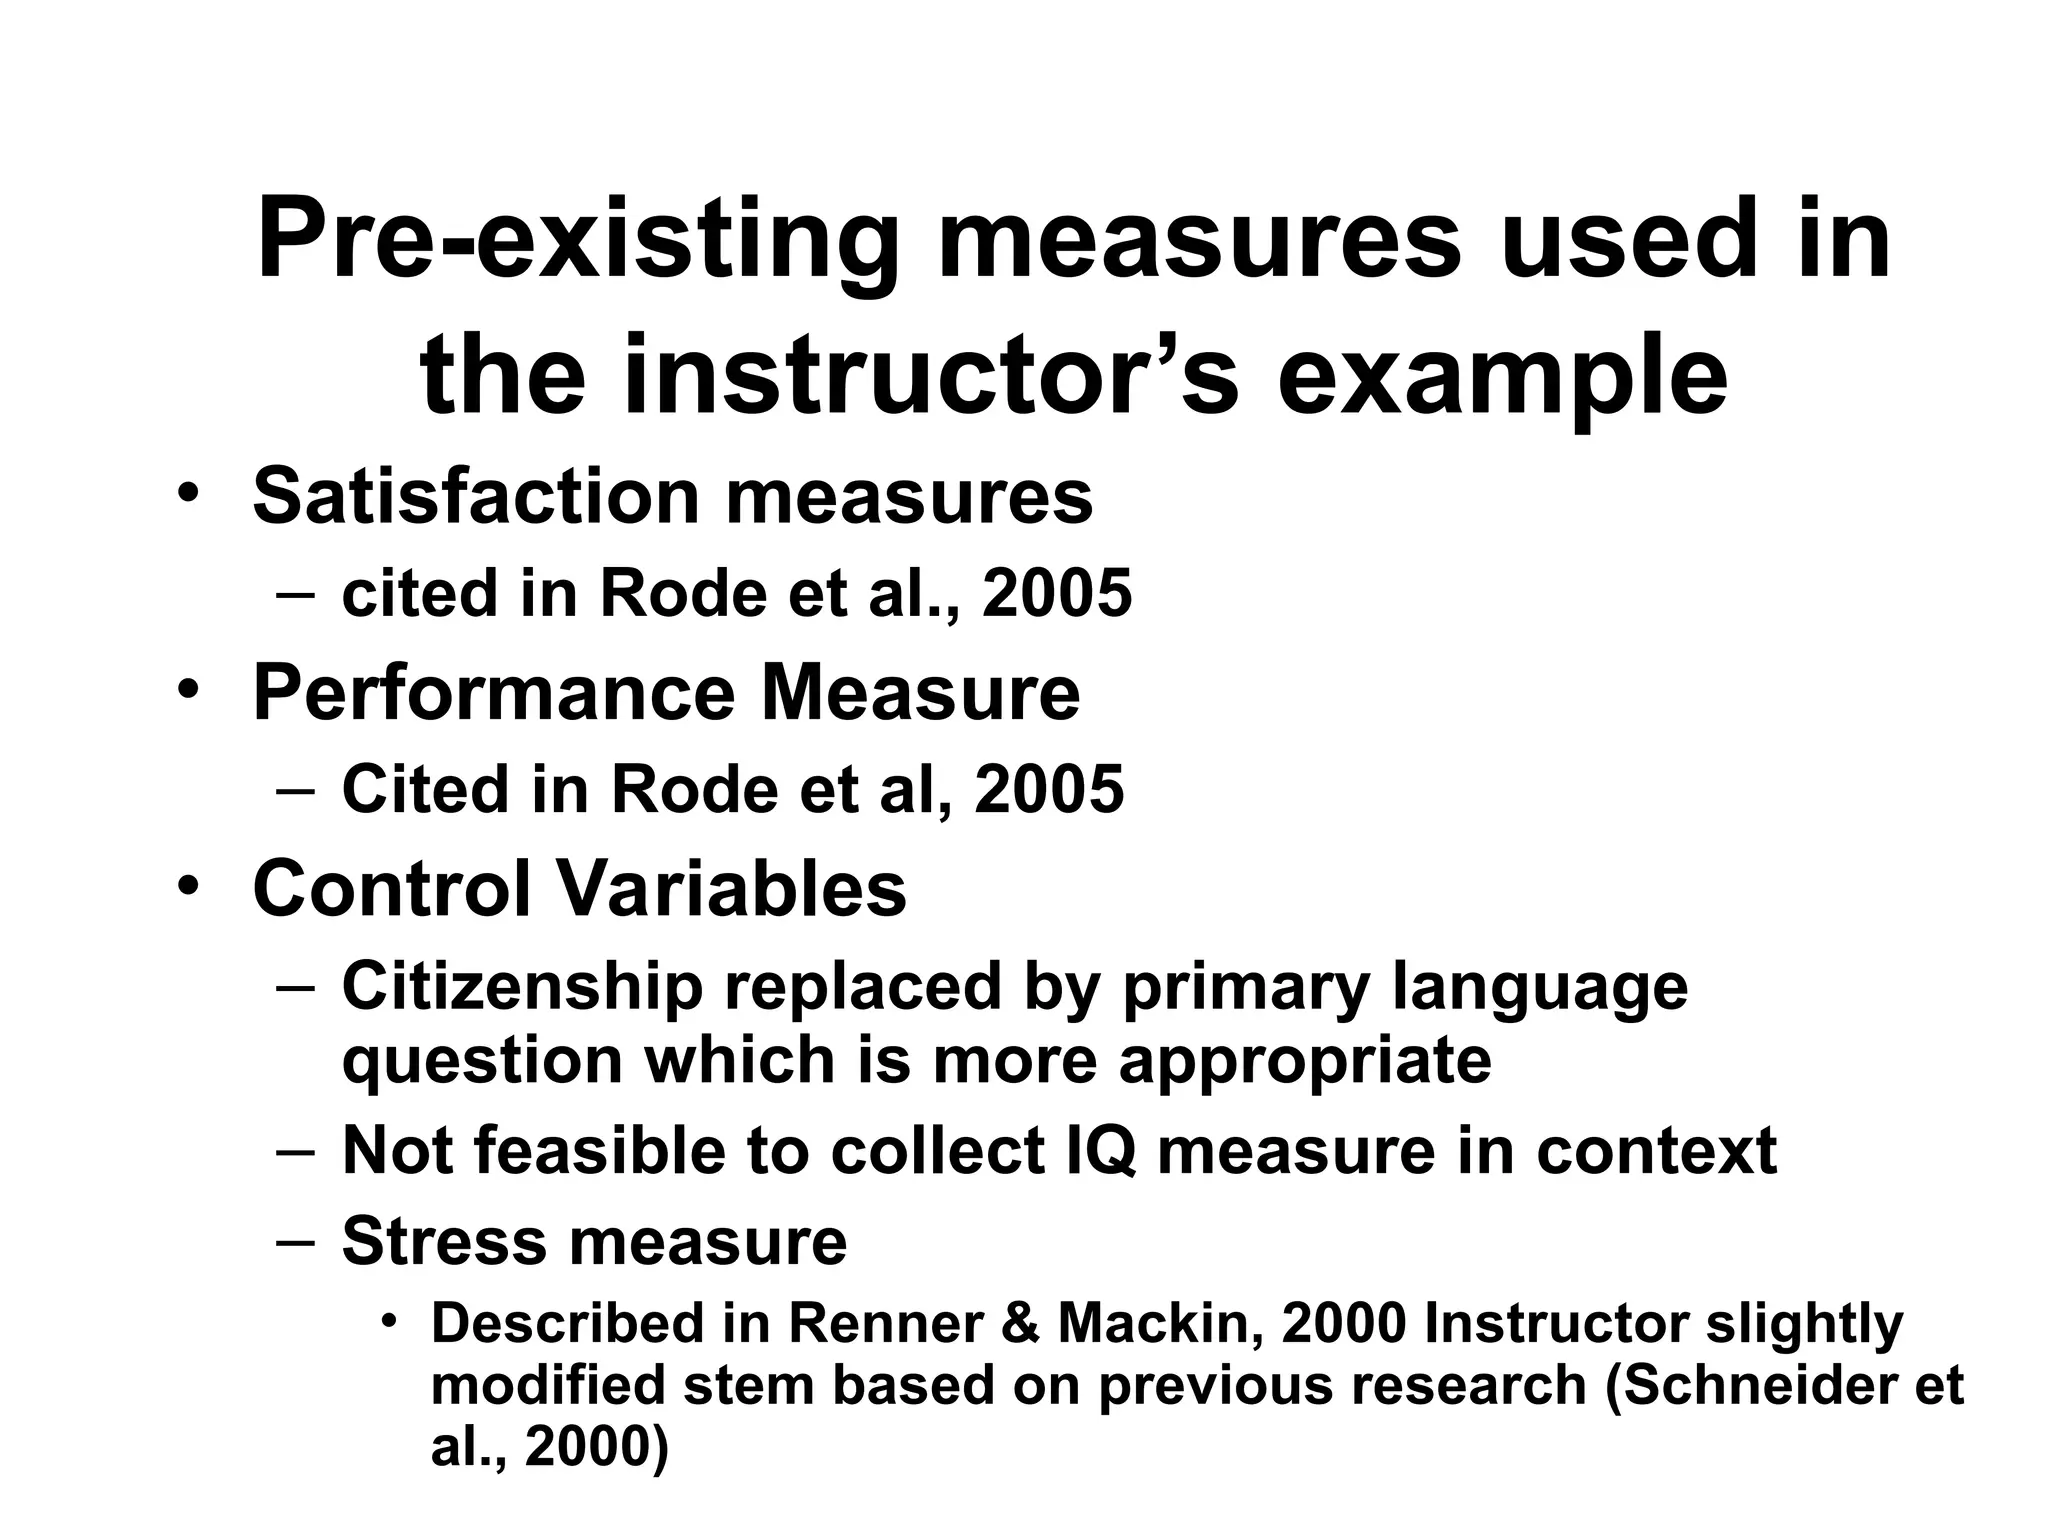
• Satisfaction measures
– cited in Rode et al., 2005
• Performance Measure
– Cited in Rode et al, 2005
• Control Variables
– Citizenship replaced by primary language
question which is more appropriate
– Not feasible to collect IQ measure in context
– Stress measure
• Described in Renner & Mackin, 2000 Instructor slightly
modified stem based on previous research (Schneider et
al., 2000)
18.
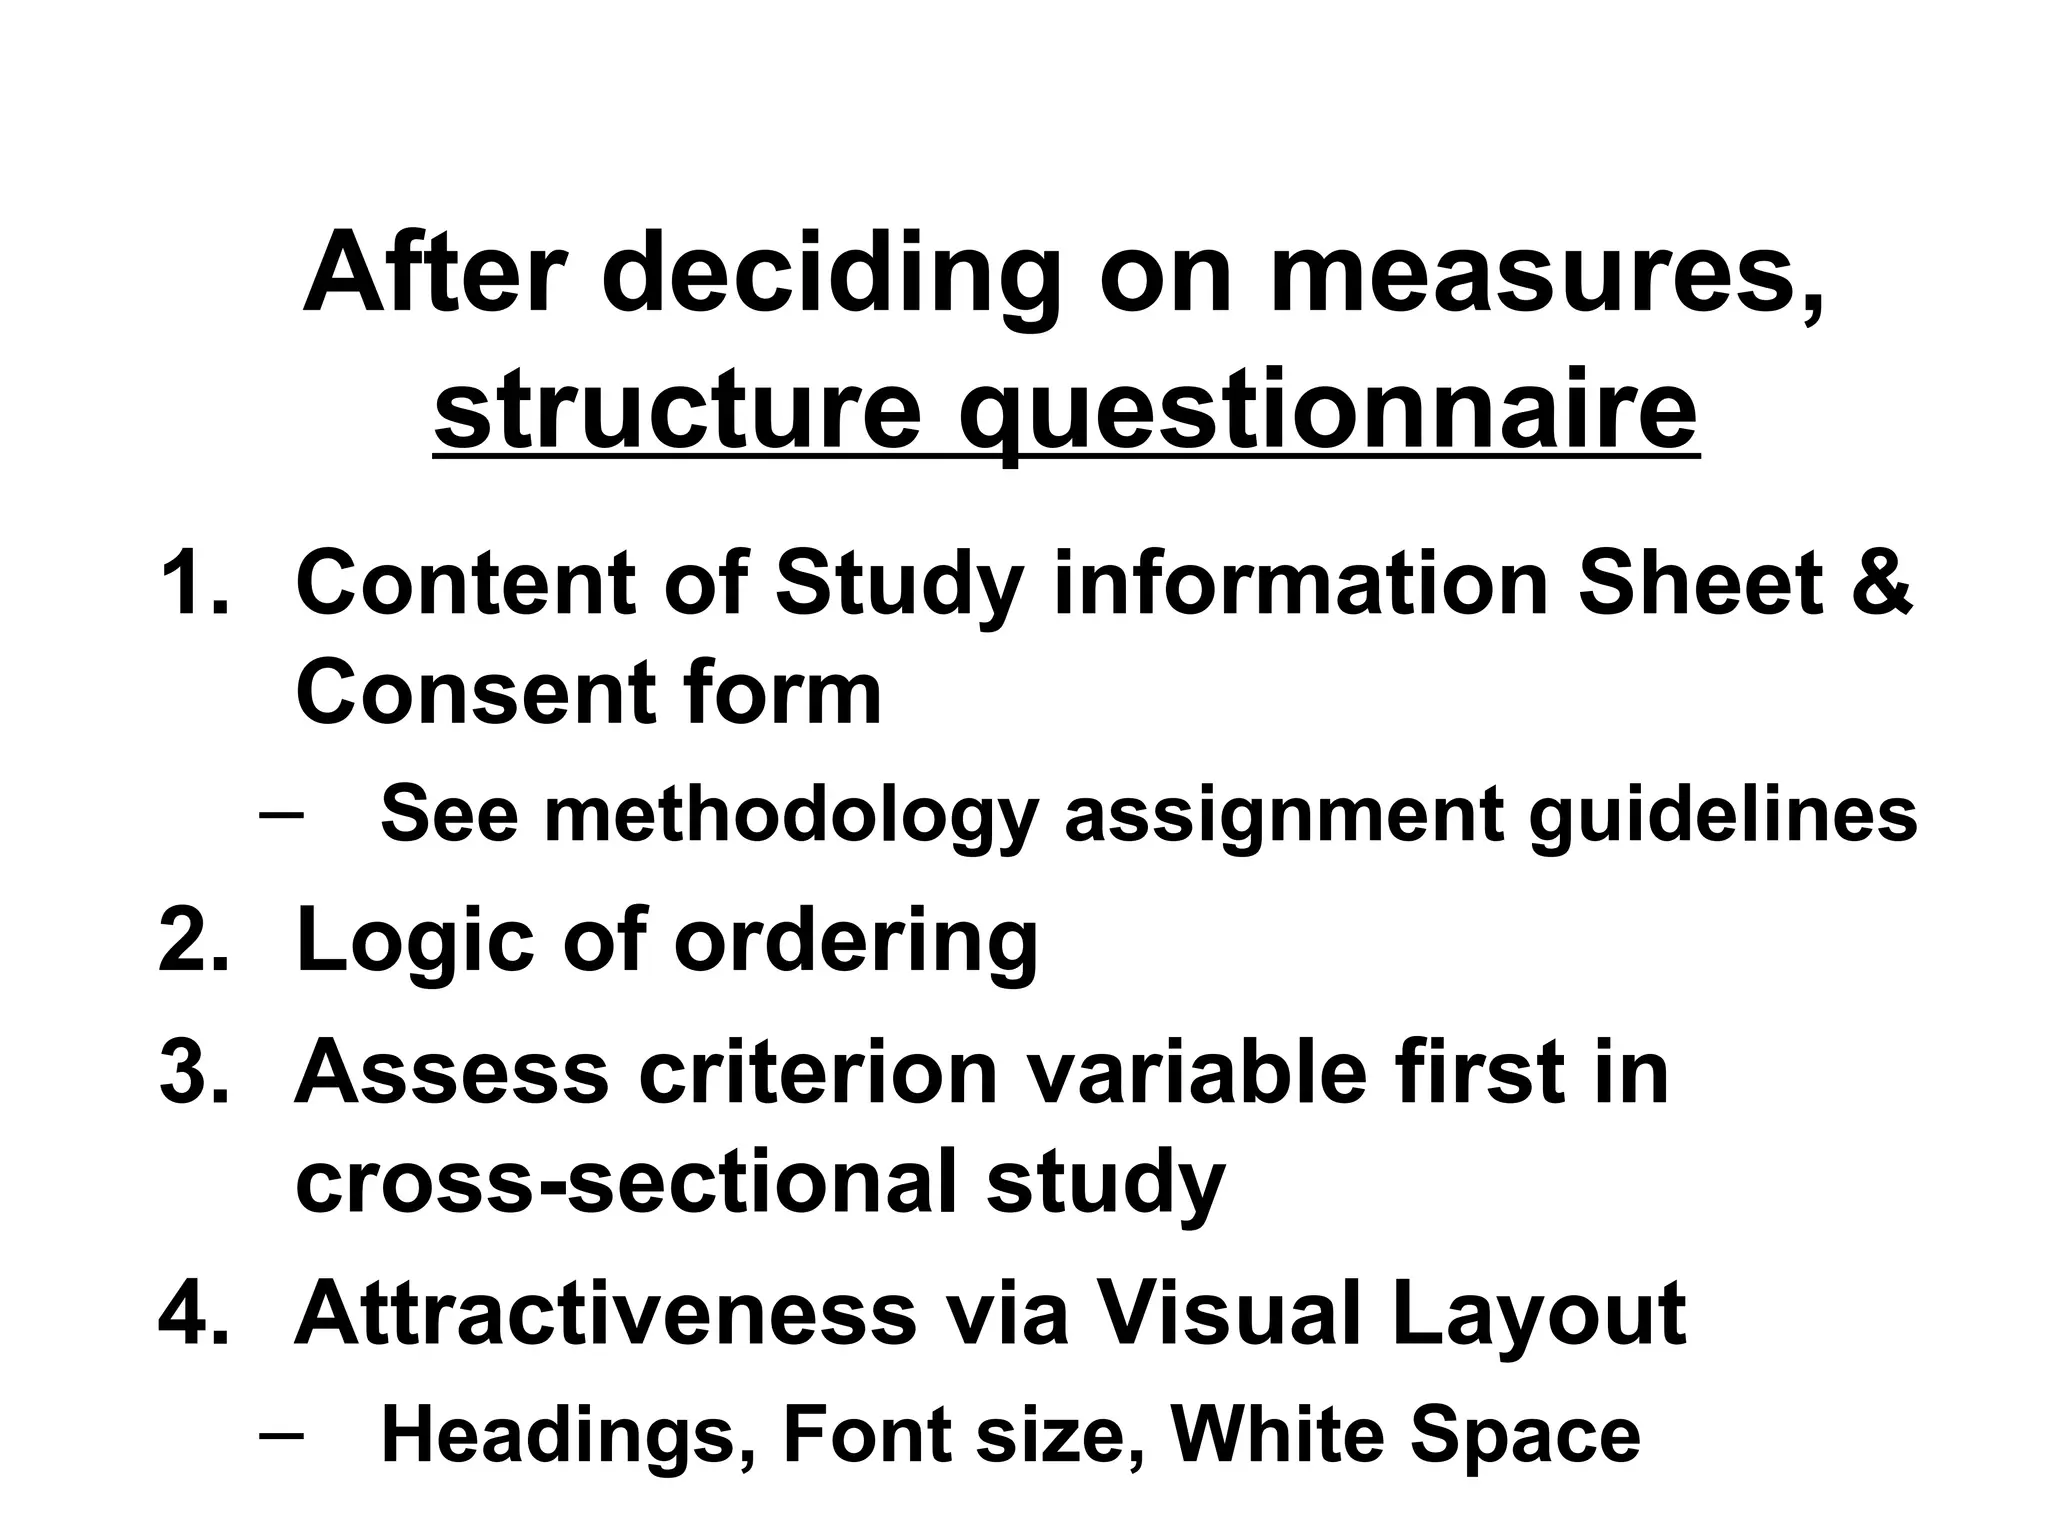
After deciding onmeasures,
structure questionnaire
1. Content of Study information Sheet &
Consent form
– See methodology assignment guidelines
2. Logic of ordering
3. Assess criterion variable first in
cross-sectional study
4. Attractiveness via Visual Layout
– Headings, Font size, White Space
19.
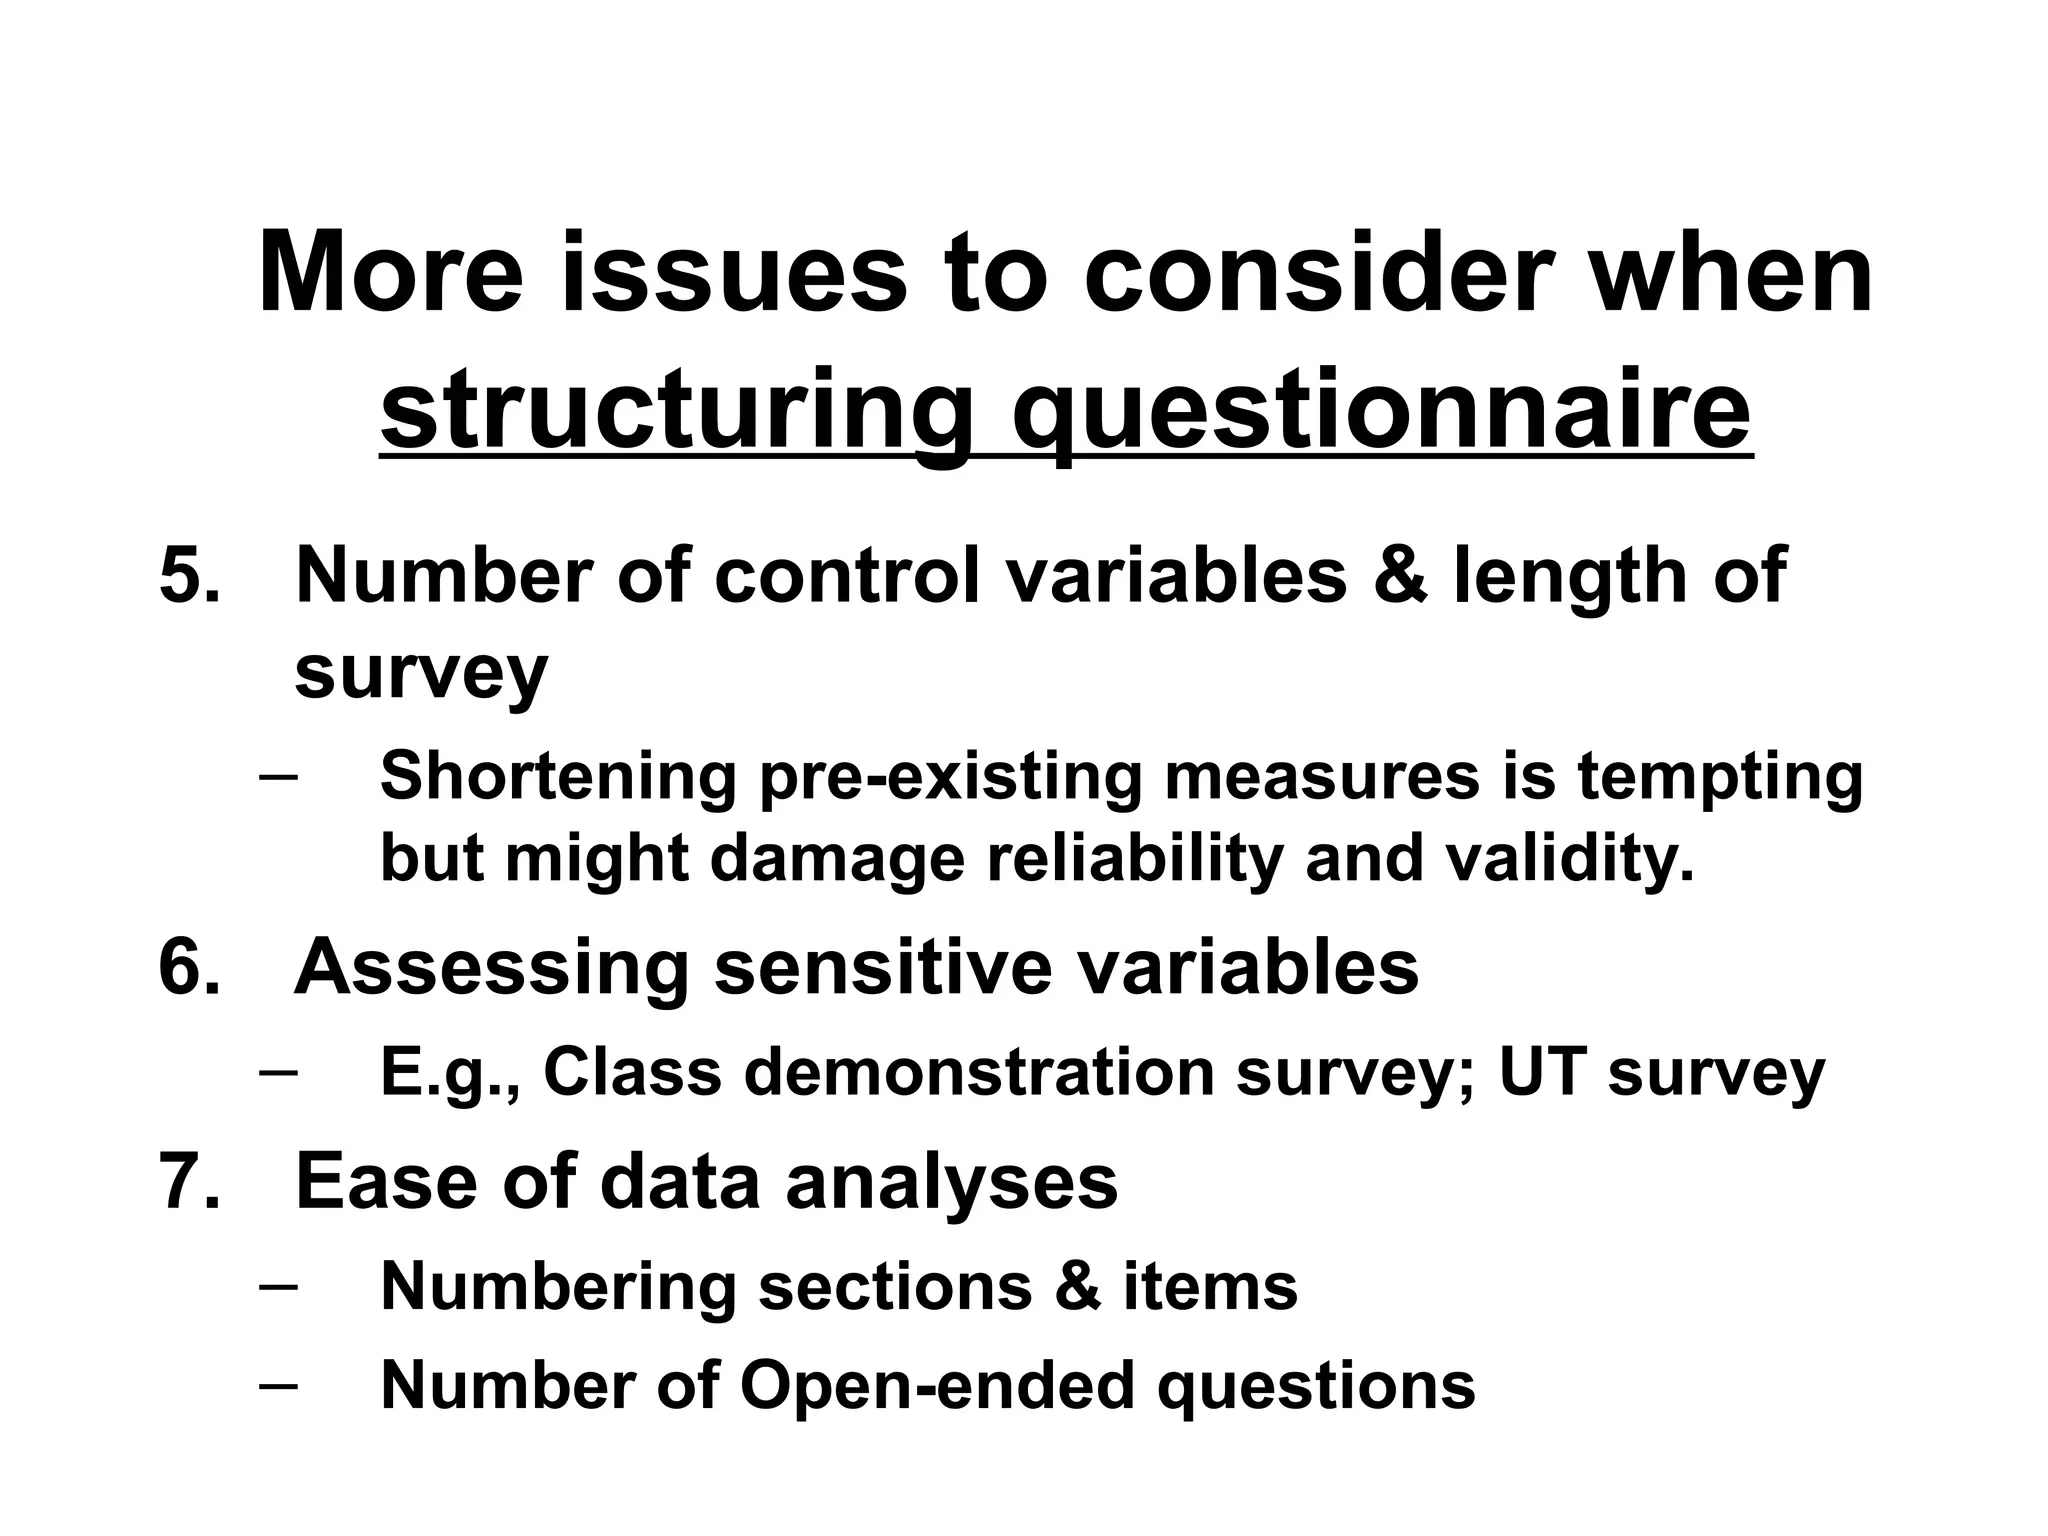
More issues toconsider when
structuring questionnaire
5. Number of control variables & length of
survey
– Shortening pre-existing measures is tempting
but might damage reliability and validity.
6. Assessing sensitive variables
– E.g., Class demonstration survey; UT survey
7. Ease of data analyses
– Numbering sections & items
– Number of Open-ended questions
20.
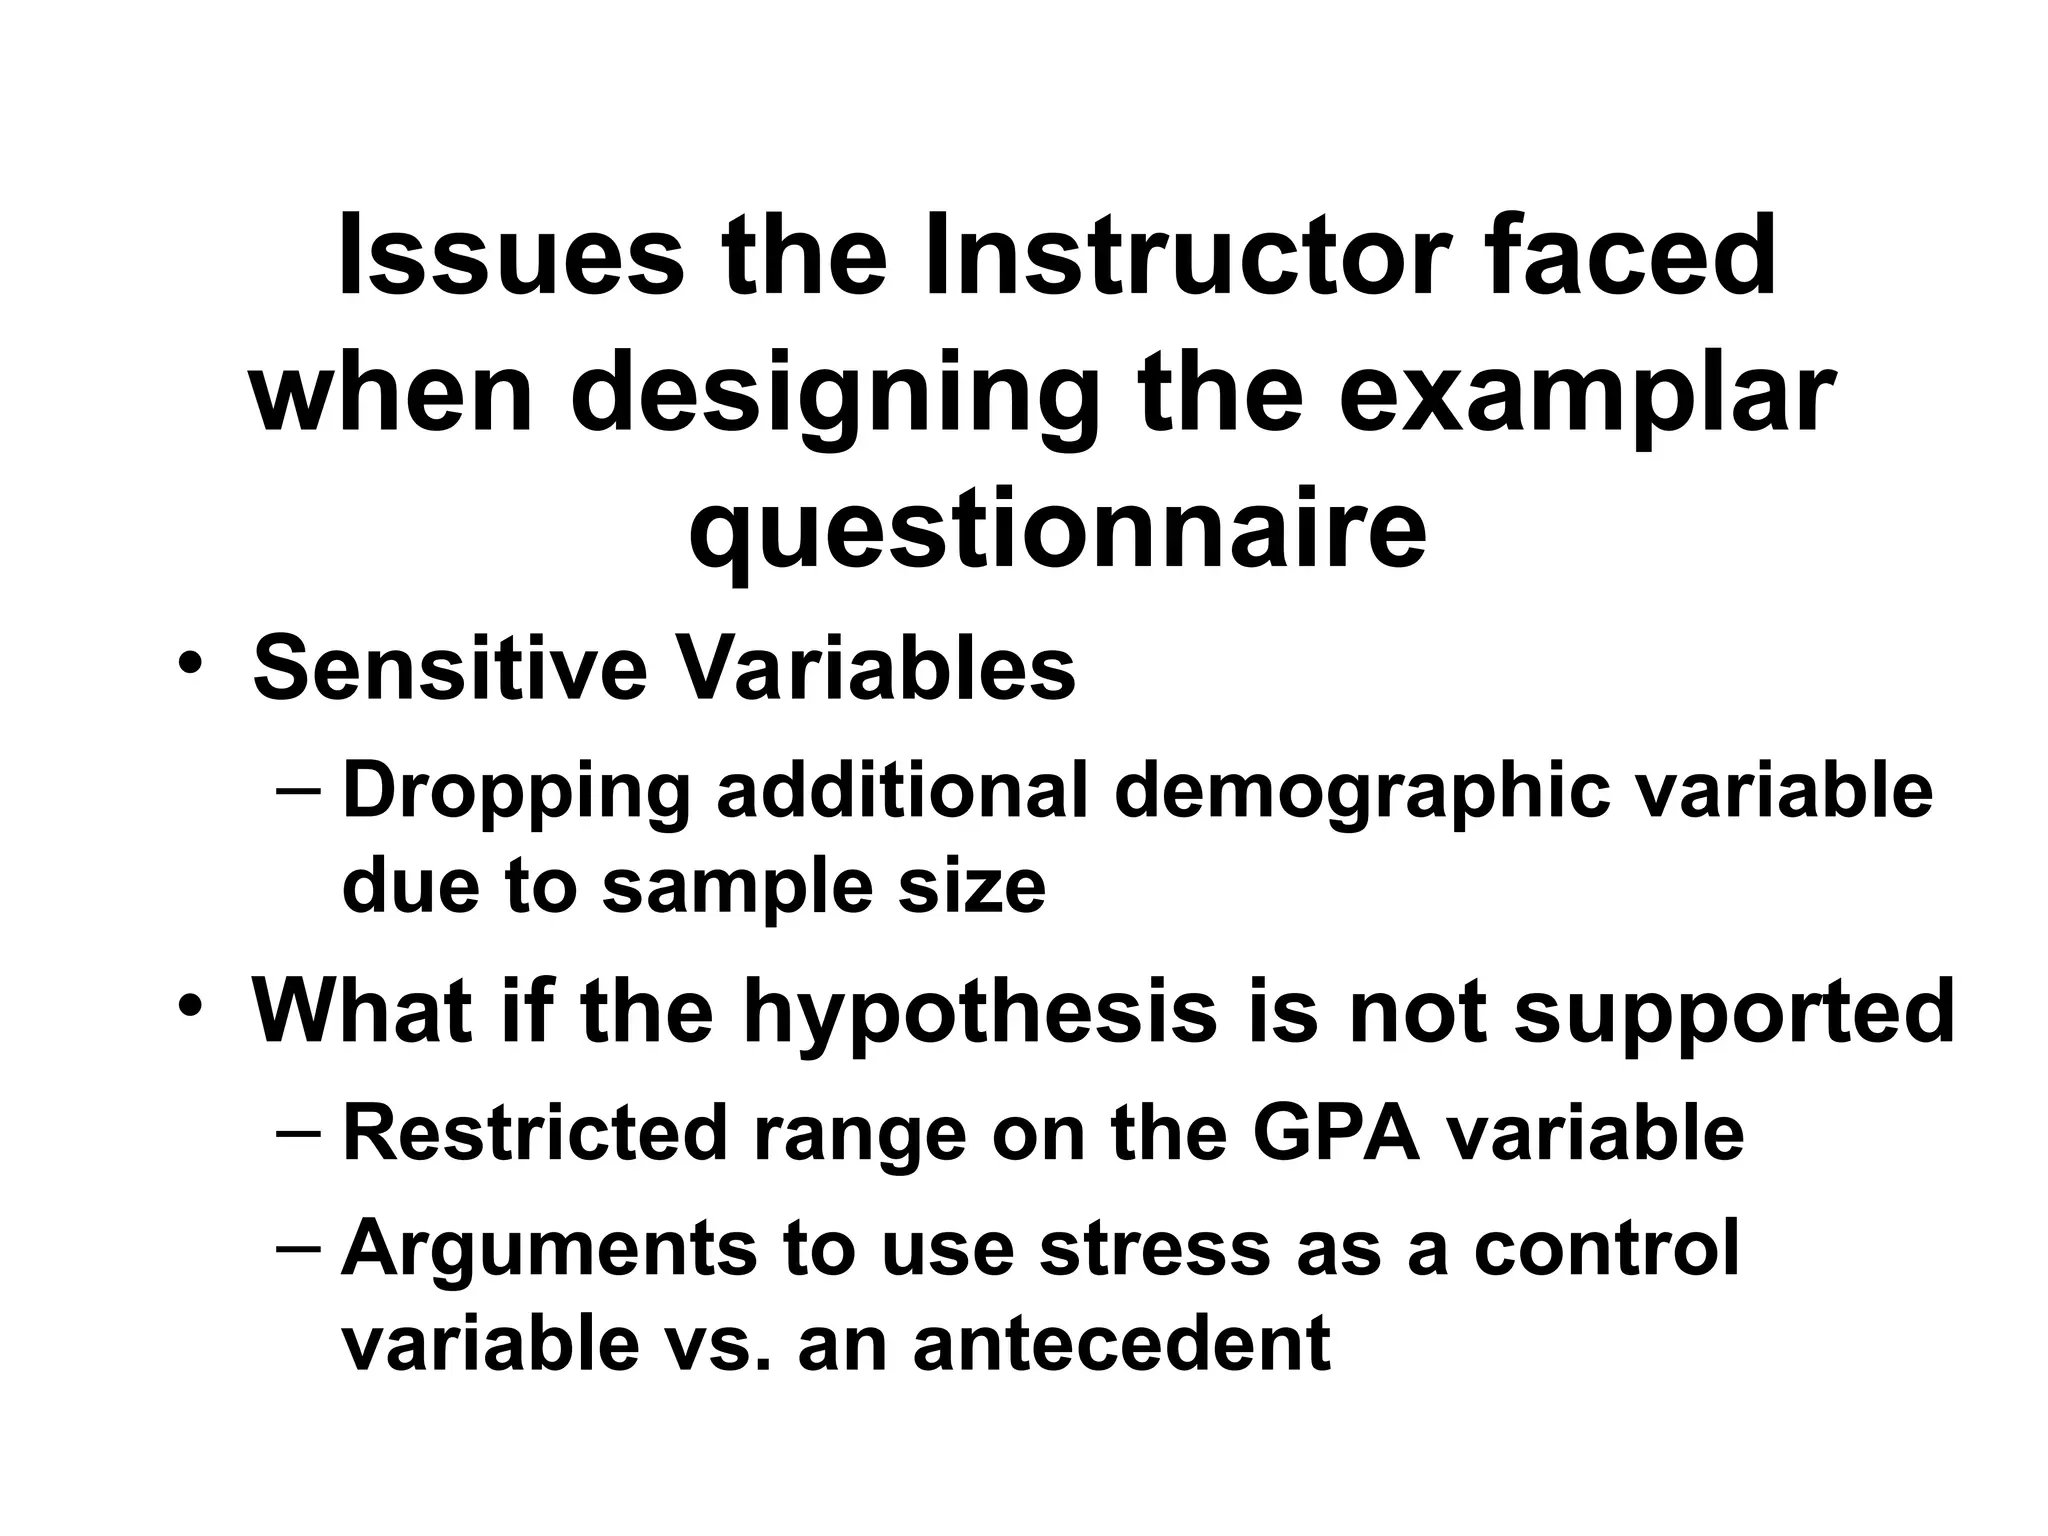
Issues the Instructorfaced
when designing the examplar
questionnaire
• Sensitive Variables
– Dropping additional demographic variable
due to sample size
• What if the hypothesis is not supported
– Restricted range on the GPA variable
– Arguments to use stress as a control
variable vs. an antecedent
21.
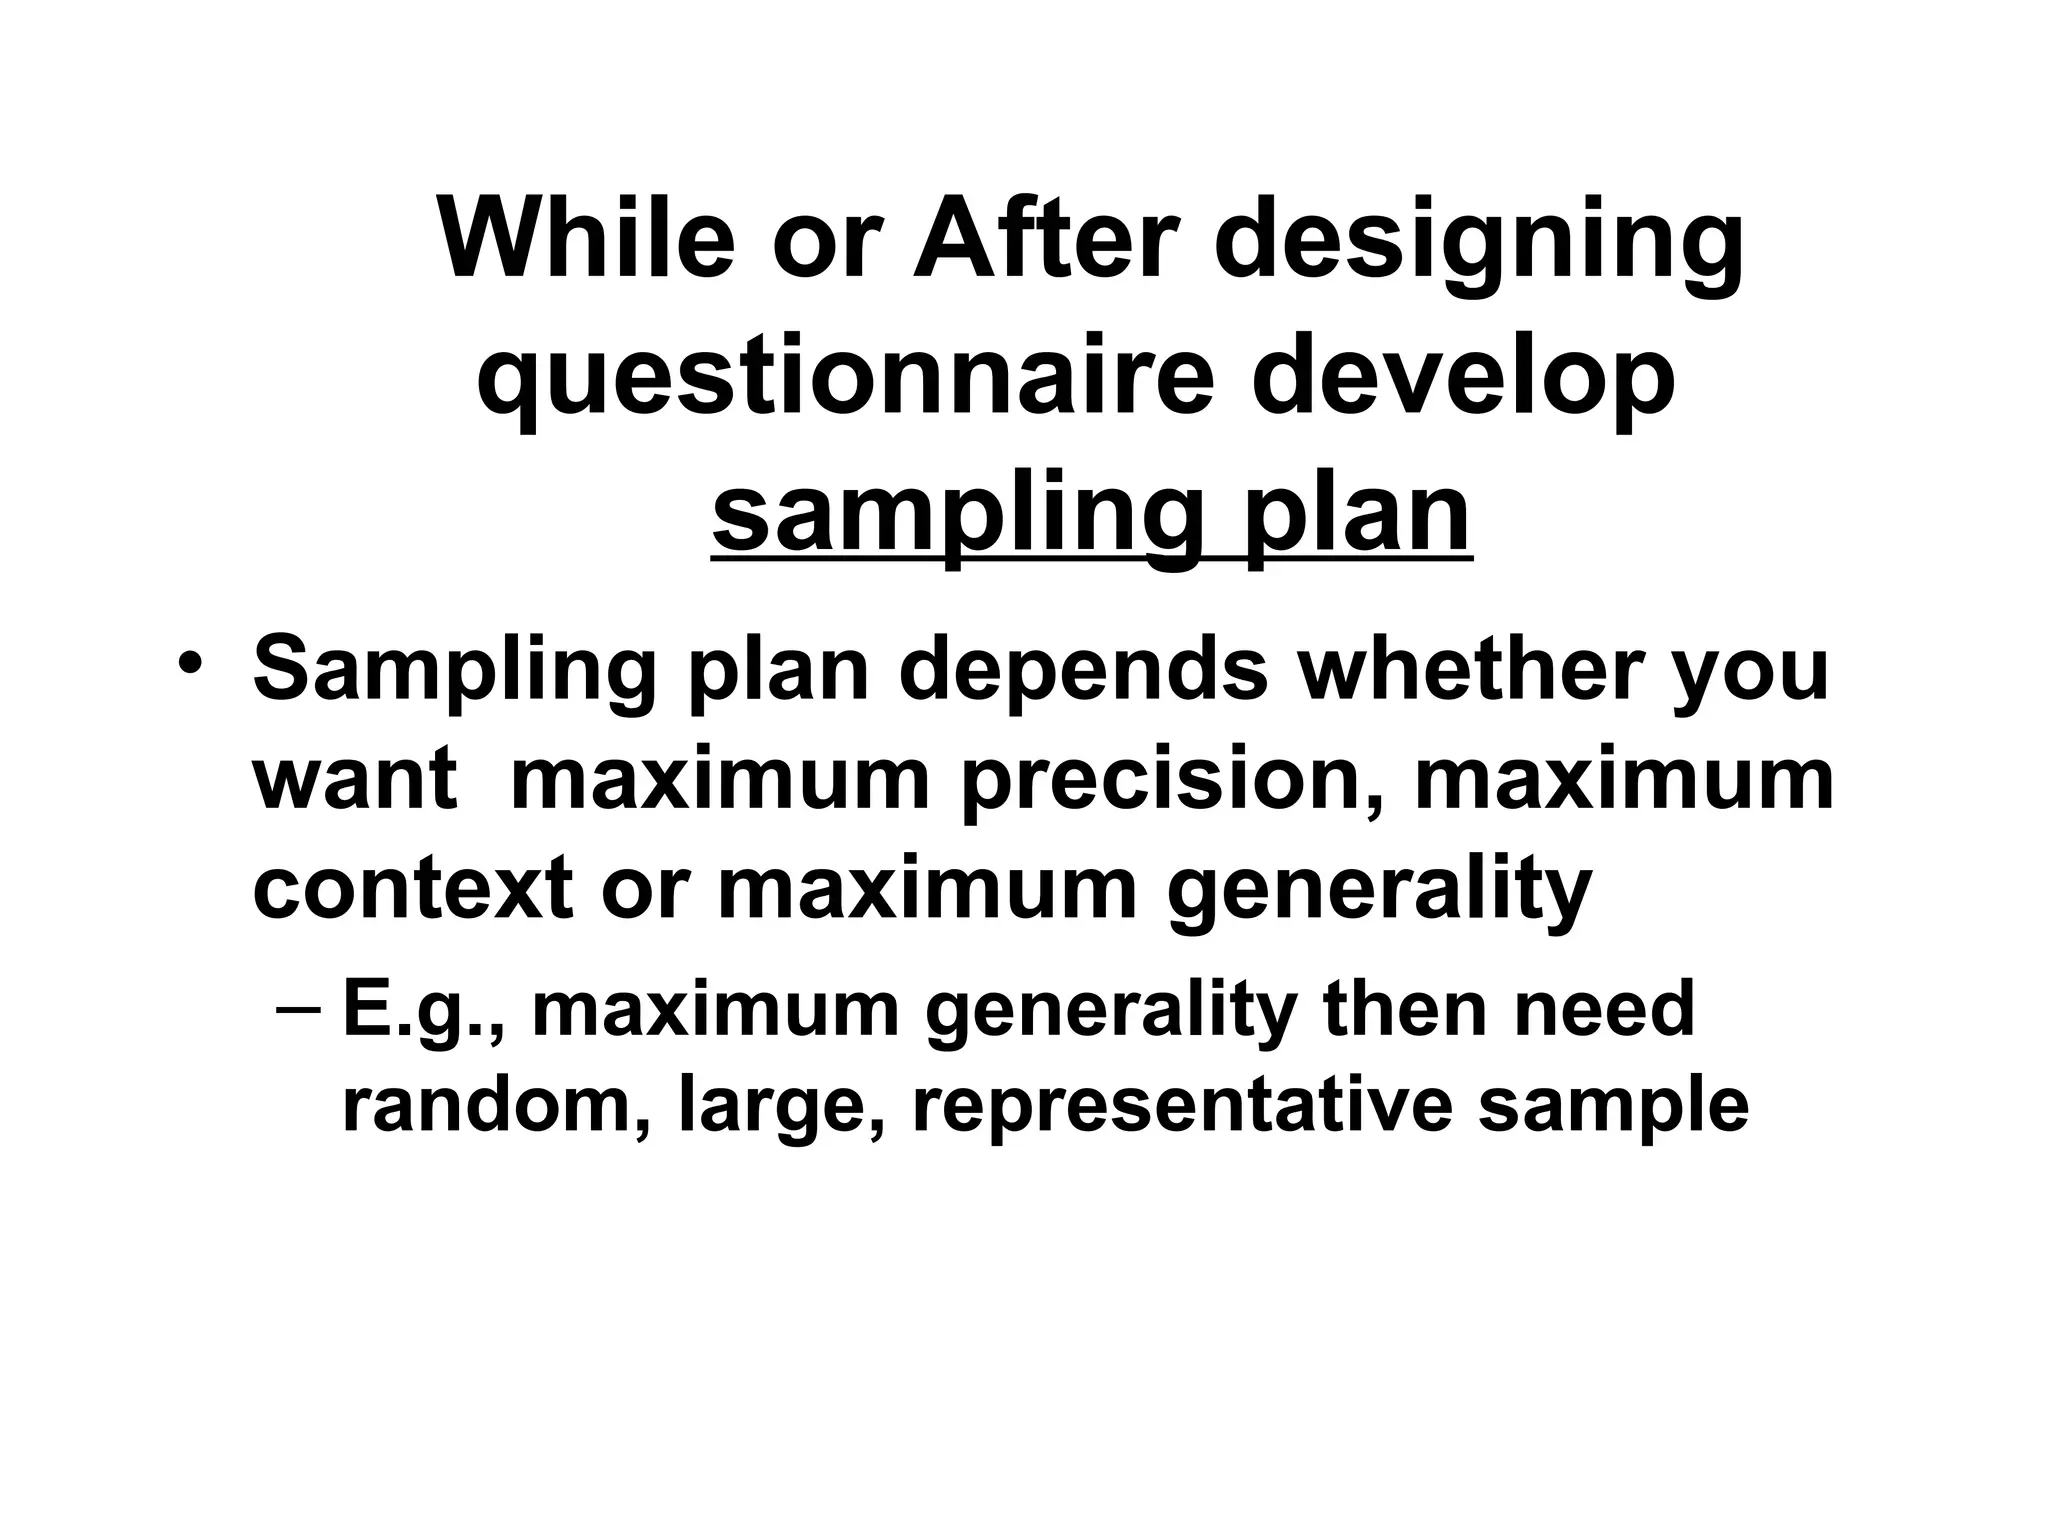
While or Afterdesigning
questionnaire develop
sampling plan
• Sampling plan depends whether you
want maximum precision, maximum
context or maximum generality
– E.g., maximum generality then need
random, large, representative sample
22.
Particular Behavior Systems
UniversalBehavior Systems
Obtrusive
Operations
Unobtrusive
Operations
Natural
Settings
Contrived
Settings
Field
Studies
Field
Experiments
Lab
Experiments
Maximum
Context
Maximum
Precision
Maximum
Generality
Formal
Theory
Sample
Surveys
Setting
Independent
Behavior not
measured
Computer
Simulations
Runkel
& McGrath,
1972
Experimental
Simulations
23.
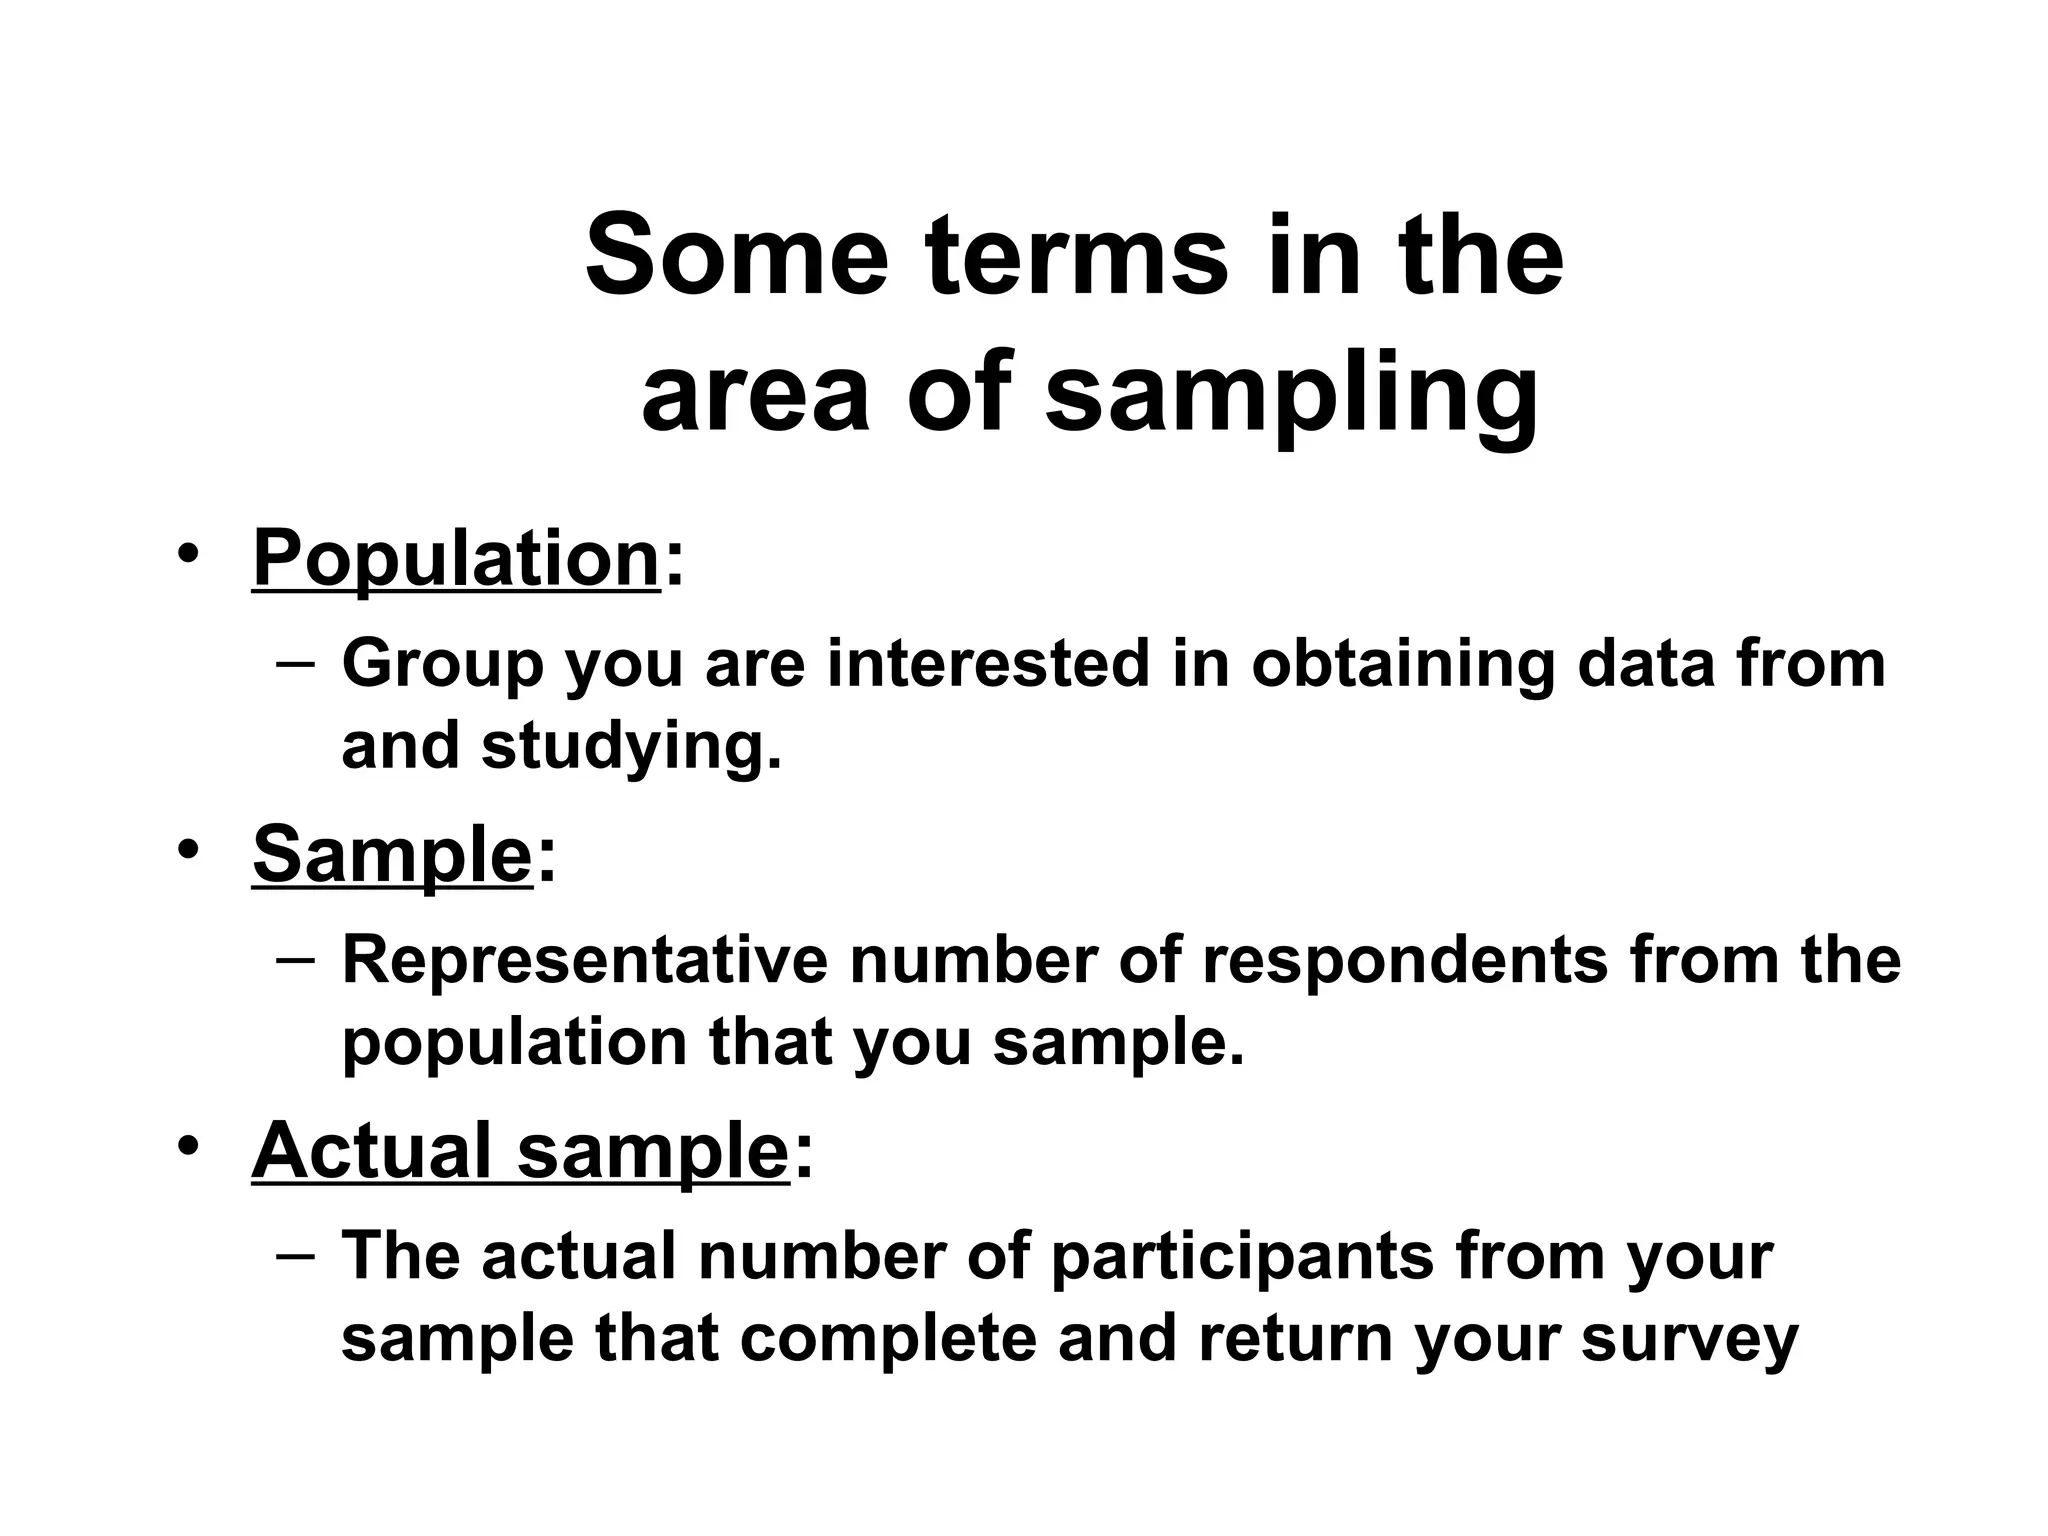
Some terms inthe
area of sampling
• Population:
– Group you are interested in obtaining data from
and studying.
• Sample:
– Representative number of respondents from the
population that you sample.
• Actual sample:
– The actual number of participants from your
sample that complete and return your survey
• Every personin the population has
exactly the same probability of being
included in the sample to avoid bias.
• Sample is representative of the larger
population.
• Representativeness can be checked by
comparing the characteristics of a
sample to those of the population
– e.g., gender, age, tenure
Random Sampling
26.
One Possible Modificationof
Random Sampling
• Stratification sampling:
– Population divided into groups called strata.
– Random selection from within groups.
– Ensures representation on some critical factor
in the sample (e.g., gender, job category).
27.
A Second PossibleModification
of Random Sampling
• Cluster sampling:
– Participants chosen as members of a group
rather than as individuals.
– Randomly select work teams, organizations,
factories, plans, facilities, etc.
28.
Convenience Sampling
(AKA whatyou will end up
doing for this course)
• Selection of participants based on easy
availability or accessibility.
• Snowball or chain sampling – people who
know people.
29.
How to geta good sample size
• Provide incentives before or after.
• Indicate support from stakeholders.
• Convincing reason to complete it.
• Promise of feedback.
• Reminders.
• Personalize correspondence.
• Return envelope with postage / web-
survey
30.
What you learnedtoday
• Is your study a field study (or field expt)
or a sample survey?
• Will you administer the questionnaire
yourself or collect archival data?
• For both data collection methods you
need to use data collected with, or
collect data with pre-existing valid &
reliable measures
– How to find reliable & valid measures
– Why use them
31.
• How todesign a good questionnaire
• What sampling plan you can hope to
use
– How to get a large enough sample with the
sampling plan you will use
What you learned today