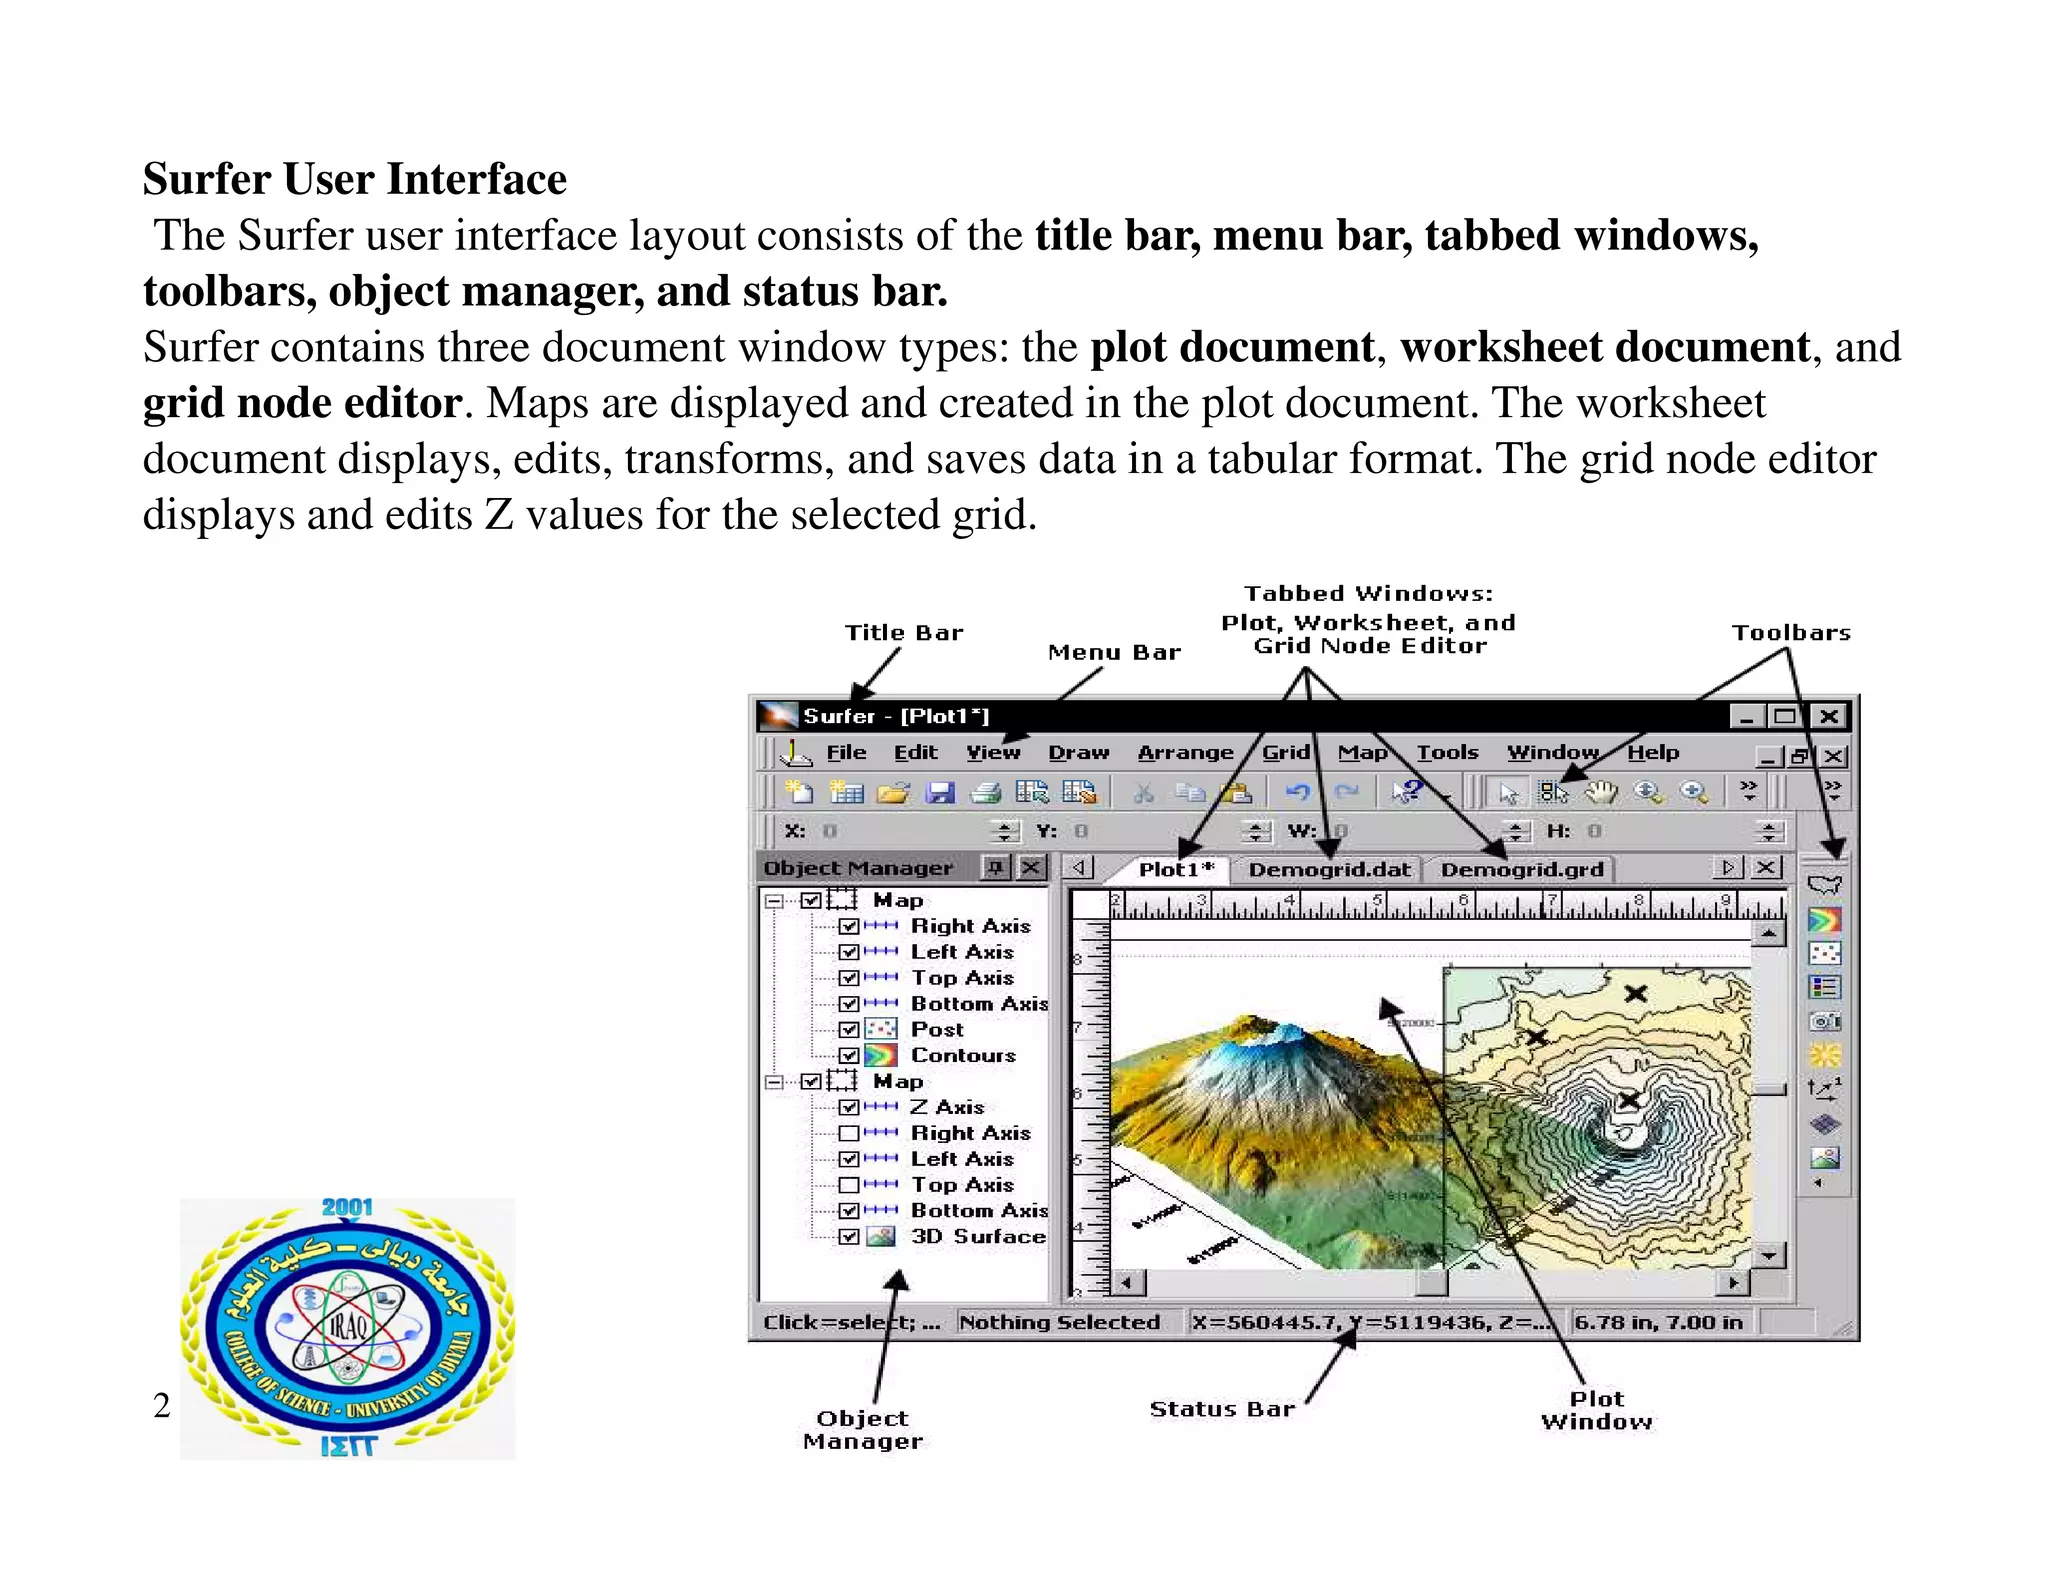
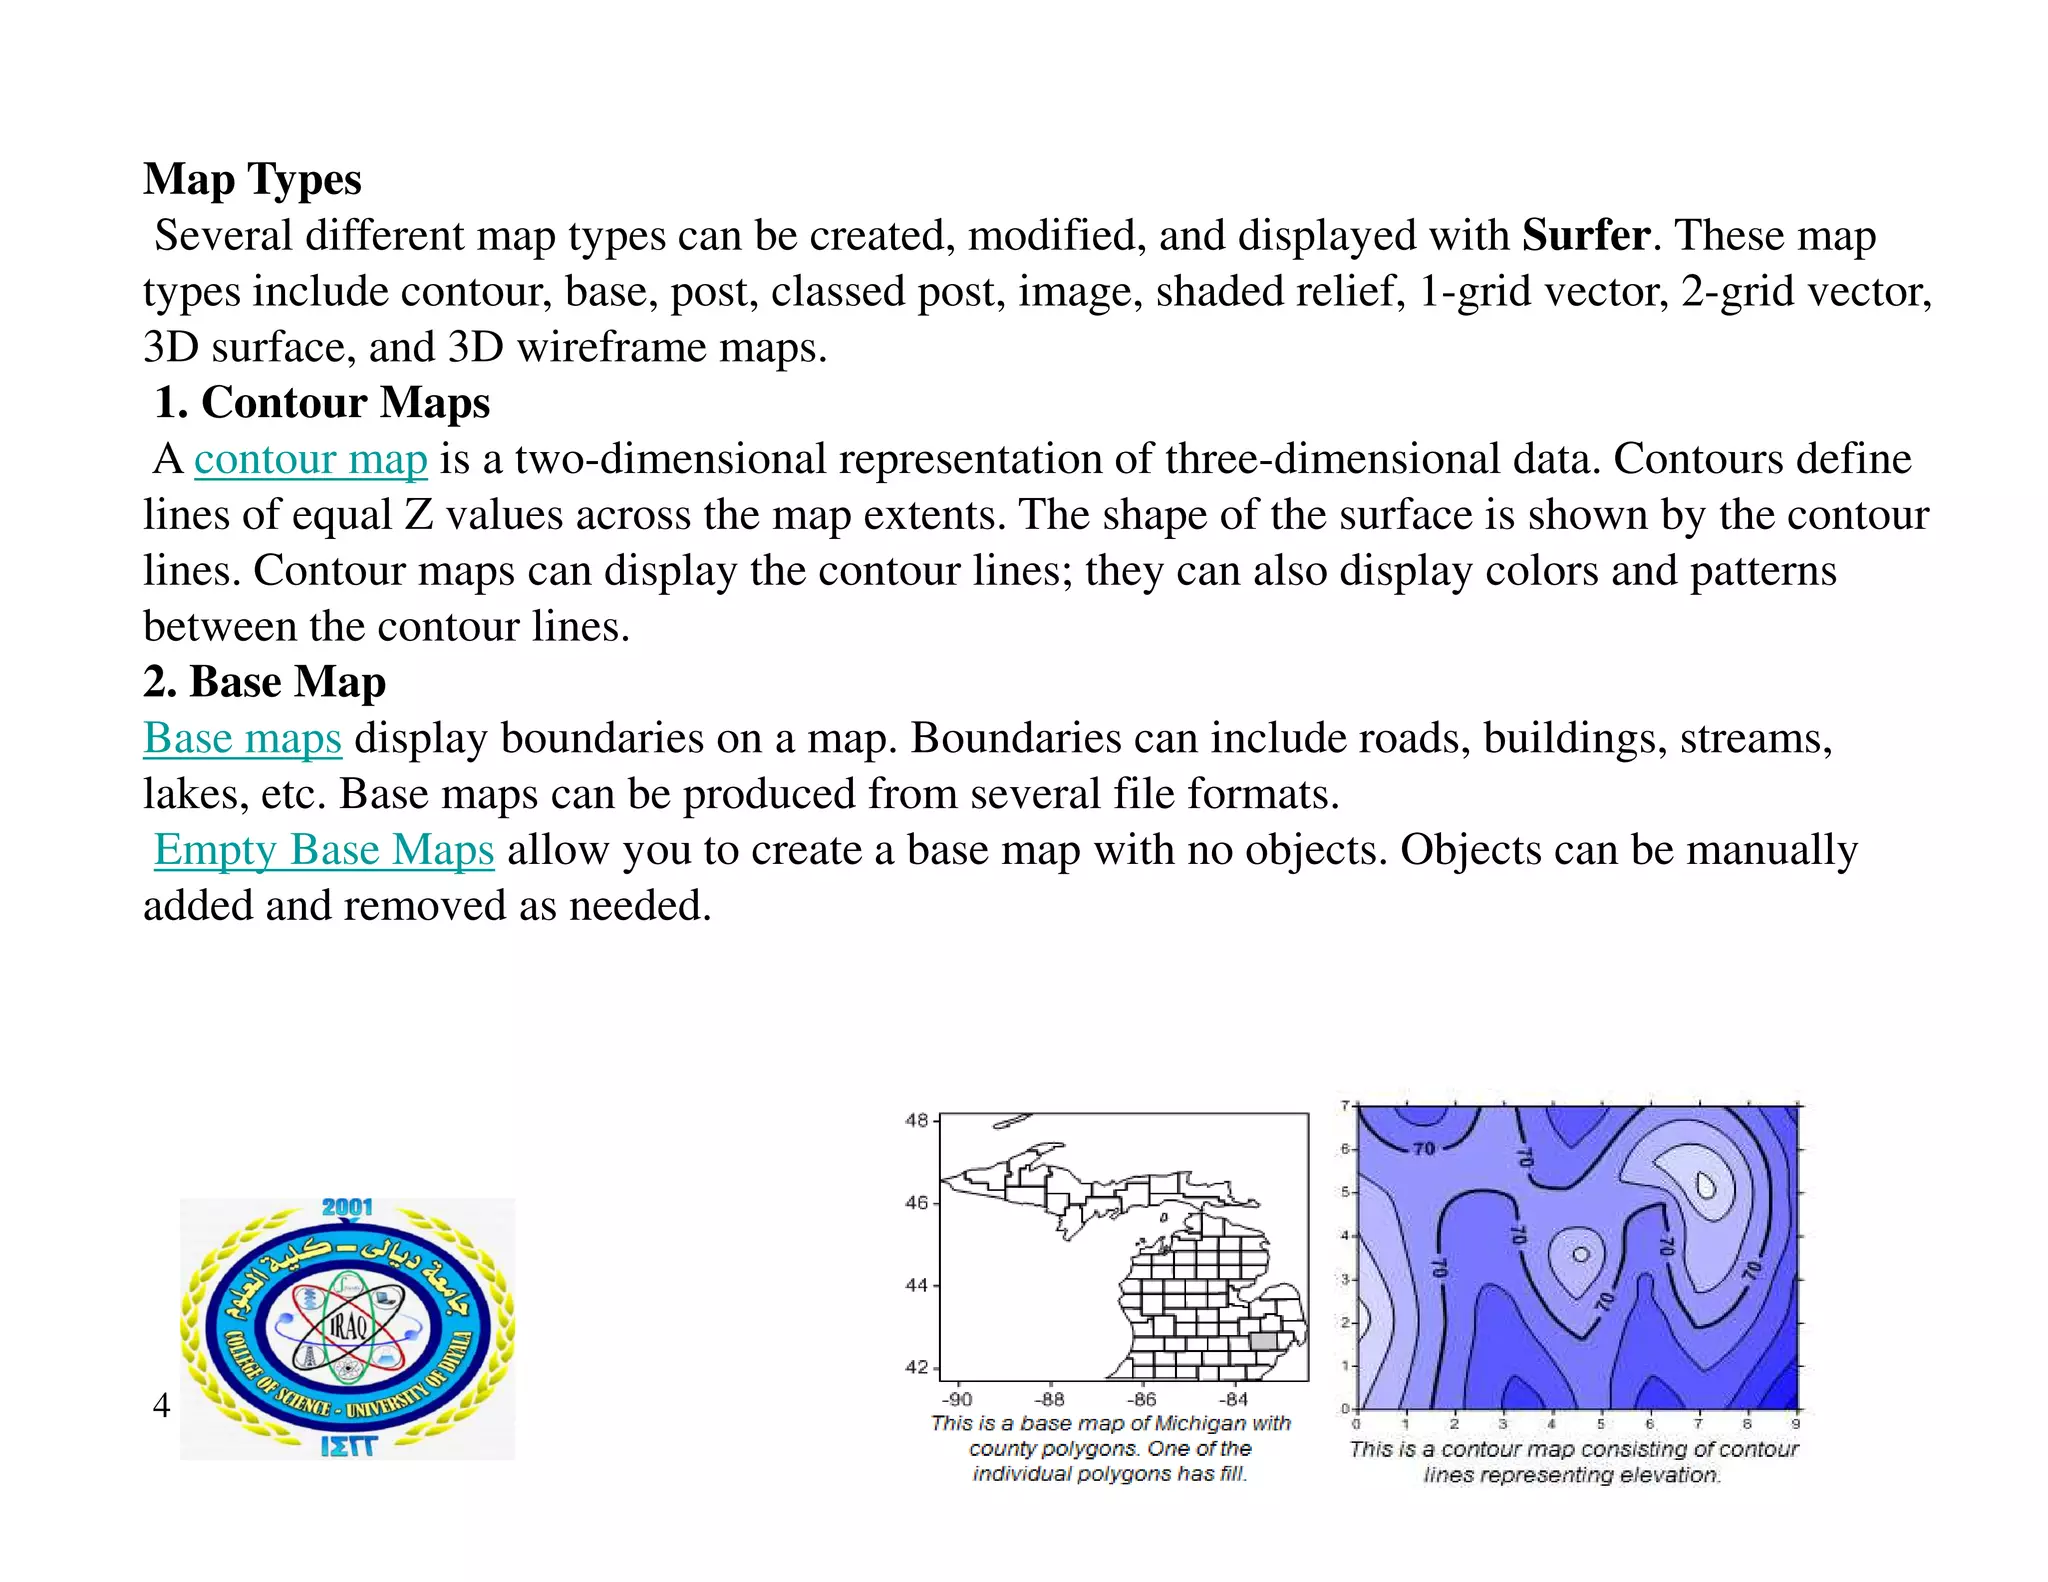
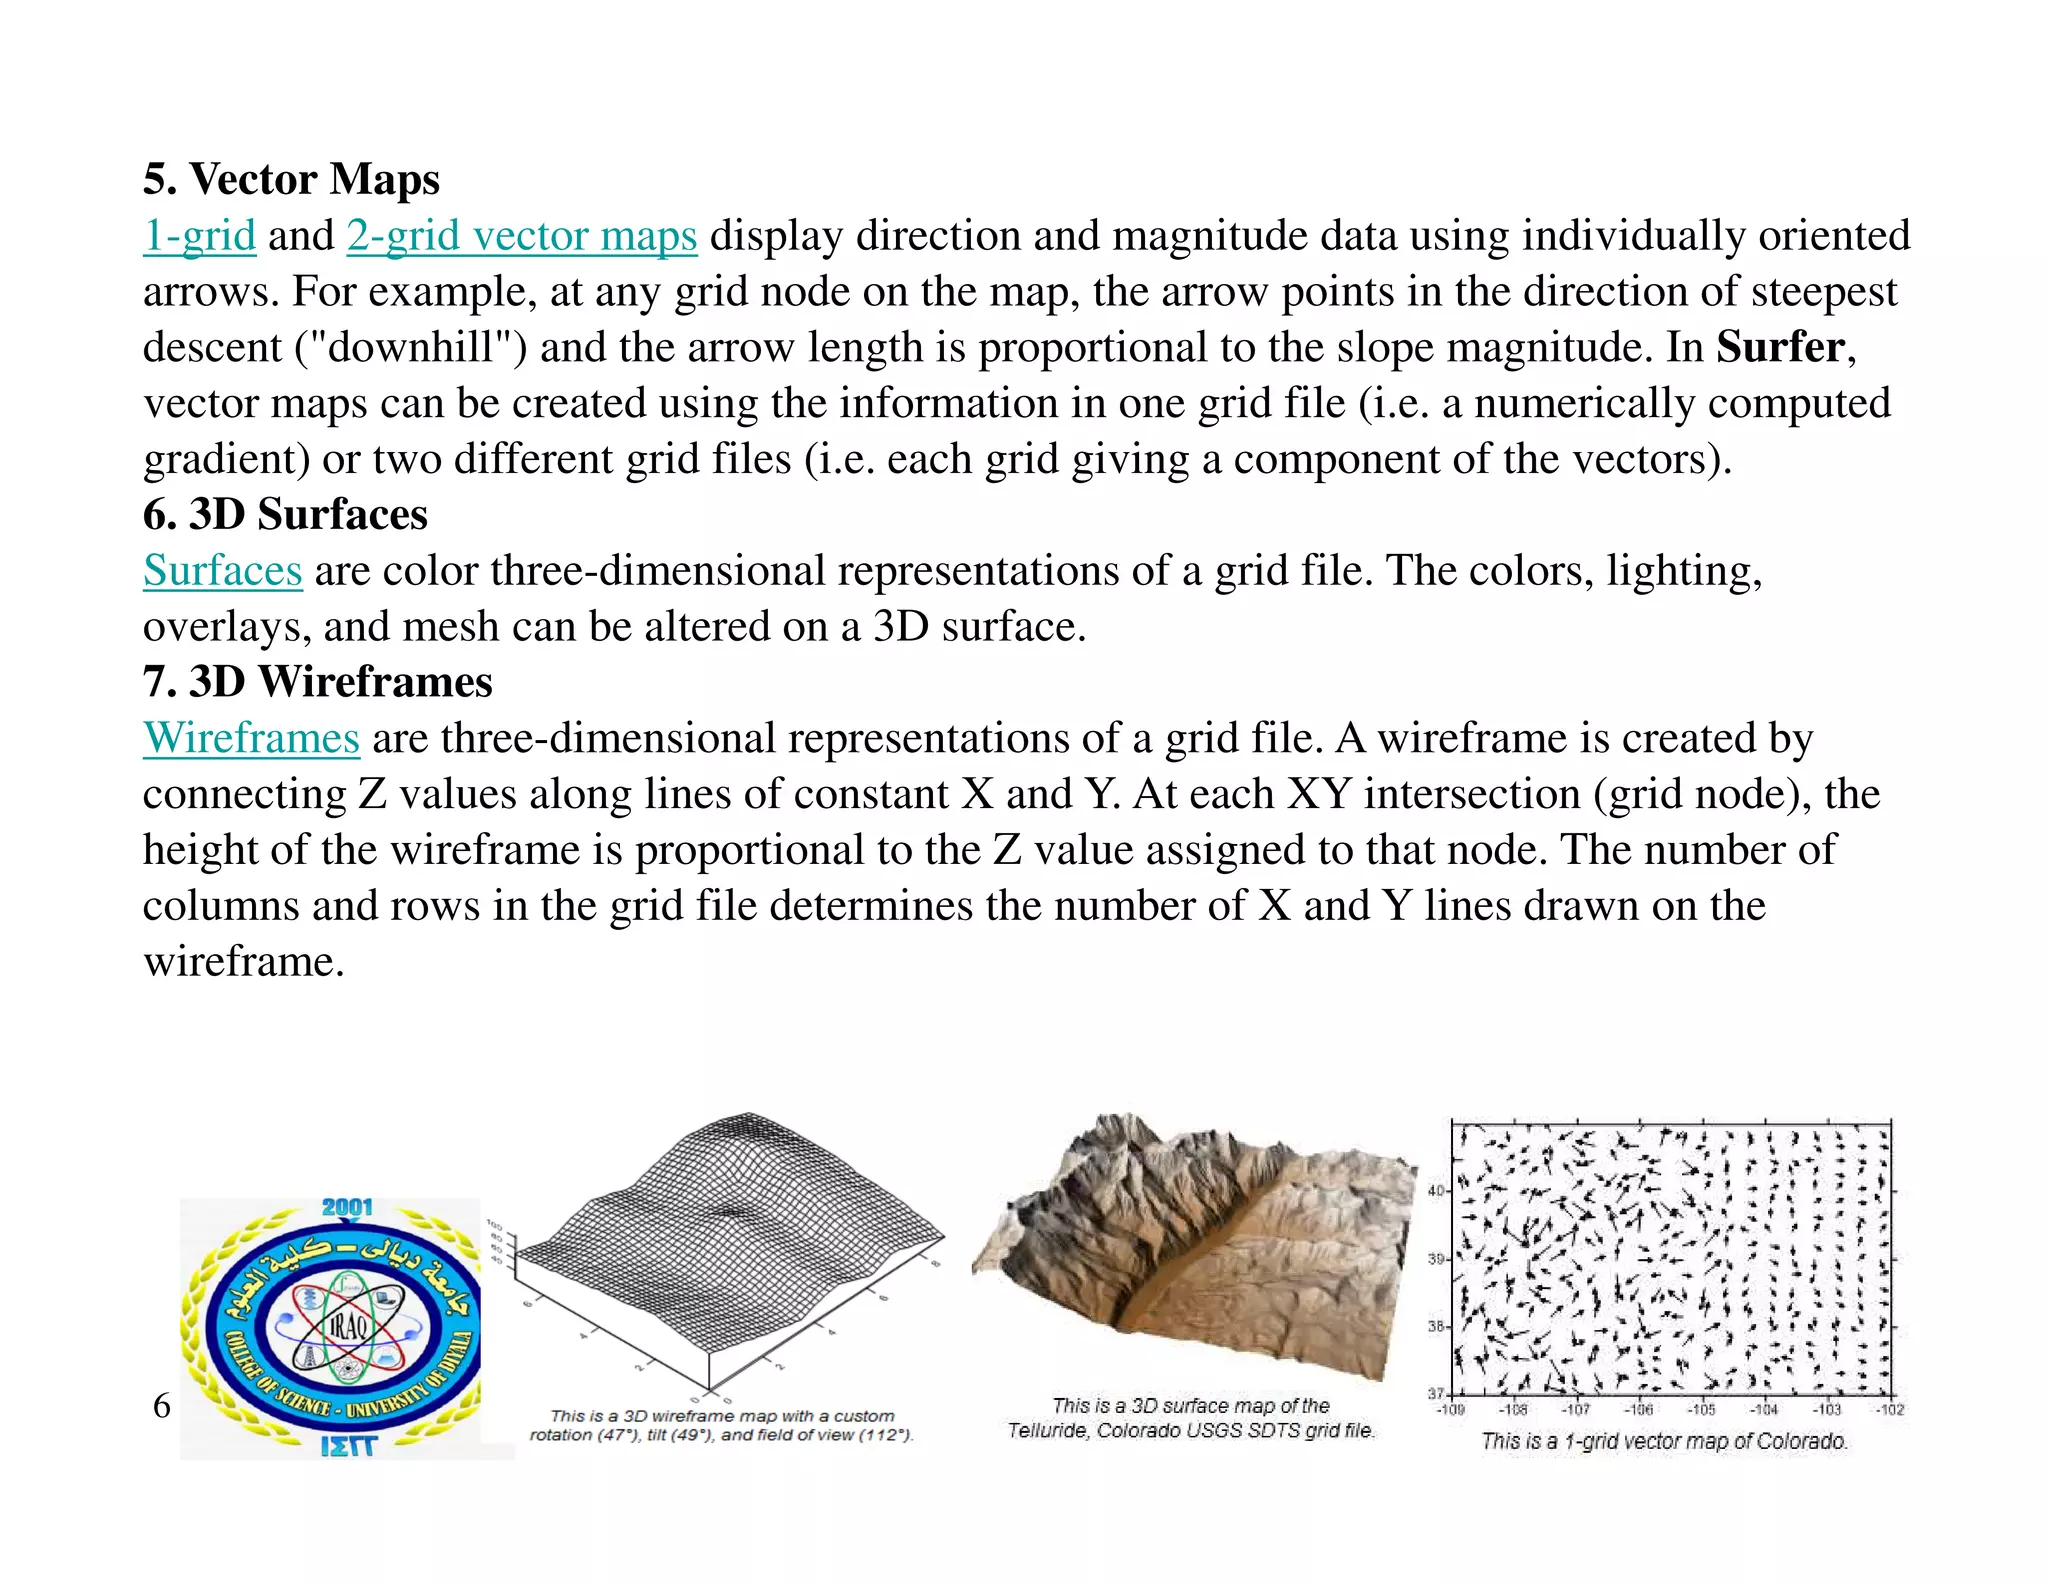
SlideShare a Scribd company logo
1 of 8
Download to read offline
Surfer-Surface Mapping Program
Surfer, a powerful contouring, gridding, and surface mapping package for scientists, engineers,
educators, or anyone who needs to generate maps quickly and easily. Producing publication
quality maps has never been quicker or easier. Maps can be displayed and enhanced in Surfer.
Adding multiple map layers, customizing the map display, and annotating with text can create
publication quality maps. Virtually all aspects of your maps can be customized to produce
exactly the presentation you want.
Surfer is a grid-based mapping program that interpolates irregularly spaced XYZ data into a
regularly spaced grid. Grids may also be imported from other sources, such as the United States
Geological Survey (USGS). The grid is used to produce different types of maps including
contour, vector, image, shaded relief, 3D surface, and 3D wireframe maps. Many gridding and
mapping options are available allowing you to produce the map that best represents your data
1
Surfer User Interface
The Surfer user interface layout consists of the title bar, menu bar, tabbed windows,
toolbars, object manager, and status bar.
Surfer contains three document window types: the plot document, worksheet document, and
grid node editor. Maps are displayed and created in the plot document. The worksheet
document displays, edits, transforms, and saves data in a tabular format. The grid node editor
displays and edits Z values for the selected grid.
2
3
Map Types
Several different map types can be created, modified, and displayed with Surfer. These map
types include contour, base, post, classed post, image, shaded relief, 1-grid vector, 2-grid vector,
3D surface, and 3D wireframe maps.
1. Contour Maps
A contour map is a two-dimensional representation of three-dimensional data. Contours define
lines of equal Z values across the map extents. The shape of the surface is shown by the contour
lines. Contour maps can display the contour lines; they can also display colors and patterns
between the contour lines.
2. Base Map
Base maps display boundaries on a map. Boundaries can include roads, buildings, streams,
lakes, etc. Base maps can be produced from several file formats.
Empty Base Maps allow you to create a base map with no objects. Objects can be manually
added and removed as needed.
4
3. Post Maps
Post maps and classed post maps show data locations on a map. Post symbols and the individual
post label positions can be customized.
4. Image Maps and Shaded Relief Maps
Image maps and shaded relief maps are raster images based on grid files. Image maps assign
colors based on Z values from a grid file. Shaded relief maps assign colors based on slope
orientation relative to a light source.
5
5. Vector Maps
1-grid and 2-grid vector maps display direction and magnitude data using individually oriented
arrows. For example, at any grid node on the map, the arrow points in the direction of steepest
descent ("downhill") and the arrow length is proportional to the slope magnitude. In Surfer,
vector maps can be created using the information in one grid file (i.e. a numerically computed
gradient) or two different grid files (i.e. each grid giving a component of the vectors).
6. 3D Surfaces
Surfaces are color three-dimensional representations of a grid file. The colors, lighting,
overlays, and mesh can be altered on a 3D surface.
7. 3D Wireframes
Wireframes are three-dimensional representations of a grid file. A wireframe is created by
connecting Z values along lines of constant X and Y. At each XY intersection (grid node), the
height of the wireframe is proportional to the Z value assigned to that node. The number of
columns and rows in the grid file determines the number of X and Y lines drawn on the
wireframe.
6
Surfer Flow Chart
This flow chart illustrates the relationship between XYZ data files, grid files and any grid
based map .This example displays only two of the grid based maps (i.e. contour and 3D
surface).
The general steps to create a grid-based map are as follows:
1. Create a XYZ data file. This file can be created in a Surfer worksheet window or outside
of Surfer (using an ASCII text editor, for example).
2. Create a grid file [.GRD] from the XYZ data file using the Grid | Data command.
3. To create a map, select the map type from the Map menu and use the grid file from step
two. Grid-based maps include contour, image, shaded relief, vector, 3D surface, and 3D
wireframe maps.
File | Save
7
4. Use File | Save to save the map as a Surfer file [SRF.].
8

More Related Content

Similar to Surfer 1.pdf

Surfer software
Surfer softwareSurfer software
Surfer softwareAqib Ahmed
 
Assignment vector raster
Assignment vector rasterAssignment vector raster
Assignment vector rasterfredsk2006
 
Raster data model
Raster data modelRaster data model
Raster data modelPramoda Raj
 
Raster data model
Raster data modelRaster data model
Raster data modelPramoda Raj
 
QGIS Training.pptx
QGIS Training.pptxQGIS Training.pptx
QGIS Training.pptxSeemaAjay7
 
spatial databases ADBMS ppt
spatial databases ADBMS pptspatial databases ADBMS ppt
spatial databases ADBMS pptRitaThakkar1
 
Scattered gis handbook
Scattered gis handbookScattered gis handbook
Scattered gis handbookWaleed Liaqat
 
Unit 4 Data Input and Analysis.pptx
Unit 4 Data Input and Analysis.pptxUnit 4 Data Input and Analysis.pptx
Unit 4 Data Input and Analysis.pptxe20ag004
 
Geographic information system (gis)
Geographic information system (gis)Geographic information system (gis)
Geographic information system (gis)Vandana Verma
 
the title of this course is Entitles as GIS and Remote sensing
the title of this course is Entitles as GIS and Remote sensingthe title of this course is Entitles as GIS and Remote sensing
the title of this course is Entitles as GIS and Remote sensingmulugeta48
 
From Polygons to Quadratics.pptx
From Polygons to Quadratics.pptxFrom Polygons to Quadratics.pptx
From Polygons to Quadratics.pptxyaswanthnaik27
 

Similar to Surfer 1.pdf (20)

Mapping toolbox
Mapping toolboxMapping toolbox
Mapping toolbox
 
Surfer software
Surfer softwareSurfer software
Surfer software
 
Assignment vector raster
Assignment vector rasterAssignment vector raster
Assignment vector raster
 
3D Analyst
3D Analyst3D Analyst
3D Analyst
 
Raster data model
Raster data modelRaster data model
Raster data model
 
Raster data model
Raster data modelRaster data model
Raster data model
 
QGIS Training.pptx
QGIS Training.pptxQGIS Training.pptx
QGIS Training.pptx
 
spatial databases ADBMS ppt
spatial databases ADBMS pptspatial databases ADBMS ppt
spatial databases ADBMS ppt
 
K10947 Vikas ct
K10947 Vikas ctK10947 Vikas ct
K10947 Vikas ct
 
Scattered gis handbook
Scattered gis handbookScattered gis handbook
Scattered gis handbook
 
Unit 4 Data Input and Analysis.pptx
Unit 4 Data Input and Analysis.pptxUnit 4 Data Input and Analysis.pptx
Unit 4 Data Input and Analysis.pptx
 
K10765 Matlab 3D Mesh Plots
K10765 Matlab 3D Mesh PlotsK10765 Matlab 3D Mesh Plots
K10765 Matlab 3D Mesh Plots
 
Geographic information system (gis)
Geographic information system (gis)Geographic information system (gis)
Geographic information system (gis)
 
the title of this course is Entitles as GIS and Remote sensing
the title of this course is Entitles as GIS and Remote sensingthe title of this course is Entitles as GIS and Remote sensing
the title of this course is Entitles as GIS and Remote sensing
 
GIS Data Types
GIS Data TypesGIS Data Types
GIS Data Types
 
map.ppt
map.pptmap.ppt
map.ppt
 
Día 3
Día 3Día 3
Día 3
 
From Polygons to Quadratics.pptx
From Polygons to Quadratics.pptxFrom Polygons to Quadratics.pptx
From Polygons to Quadratics.pptx
 
Spatial Data Model
Spatial Data ModelSpatial Data Model
Spatial Data Model
 
GIS_Intro_March_2014
GIS_Intro_March_2014GIS_Intro_March_2014
GIS_Intro_March_2014
 

Recently uploaded

APM Welcome, APM North West Network Conference, Synergies Across Sectors
APM Welcome, APM North West Network Conference, Synergies Across SectorsAPM Welcome, APM North West Network Conference, Synergies Across Sectors
APM Welcome, APM North West Network Conference, Synergies Across SectorsAssociation for Project Management
 
Paris 2024 Olympic Geographies - an activity
Paris 2024 Olympic Geographies - an activityParis 2024 Olympic Geographies - an activity
Paris 2024 Olympic Geographies - an activityGeoBlogs
 
Sports & Fitness Value Added Course FY..
Sports & Fitness Value Added Course FY..Sports & Fitness Value Added Course FY..
Sports & Fitness Value Added Course FY..Disha Kariya
 
General AI for Medical Educators April 2024
General AI for Medical Educators April 2024General AI for Medical Educators April 2024
General AI for Medical Educators April 2024Janet Corral
 
Q4-W6-Restating Informational Text Grade 3
Q4-W6-Restating Informational Text Grade 3Q4-W6-Restating Informational Text Grade 3
Q4-W6-Restating Informational Text Grade 3JemimahLaneBuaron
 
9548086042 for call girls in Indira Nagar with room service
9548086042  for call girls in Indira Nagar  with room service9548086042  for call girls in Indira Nagar  with room service
9548086042 for call girls in Indira Nagar with room servicediscovermytutordmt
 
SOCIAL AND HISTORICAL CONTEXT - LFTVD.pptx
SOCIAL AND HISTORICAL CONTEXT - LFTVD.pptxSOCIAL AND HISTORICAL CONTEXT - LFTVD.pptx
SOCIAL AND HISTORICAL CONTEXT - LFTVD.pptxiammrhaywood
 
Web & Social Media Analytics Previous Year Question Paper.pdf
Web & Social Media Analytics Previous Year Question Paper.pdfWeb & Social Media Analytics Previous Year Question Paper.pdf
Web & Social Media Analytics Previous Year Question Paper.pdfJayanti Pande
 
social pharmacy d-pharm 1st year by Pragati K. Mahajan
social pharmacy d-pharm 1st year by Pragati K. Mahajansocial pharmacy d-pharm 1st year by Pragati K. Mahajan
social pharmacy d-pharm 1st year by Pragati K. Mahajanpragatimahajan3
 
Explore beautiful and ugly buildings. Mathematics helps us create beautiful d...
Explore beautiful and ugly buildings. Mathematics helps us create beautiful d...Explore beautiful and ugly buildings. Mathematics helps us create beautiful d...
Explore beautiful and ugly buildings. Mathematics helps us create beautiful d...christianmathematics
 
Presentation by Andreas Schleicher Tackling the School Absenteeism Crisis 30 ...
Presentation by Andreas Schleicher Tackling the School Absenteeism Crisis 30 ...Presentation by Andreas Schleicher Tackling the School Absenteeism Crisis 30 ...
Presentation by Andreas Schleicher Tackling the School Absenteeism Crisis 30 ...EduSkills OECD
 
Student login on Anyboli platform.helpin
Student login on Anyboli platform.helpinStudent login on Anyboli platform.helpin
Student login on Anyboli platform.helpinRaunakKeshri1
 
BASLIQ CURRENT LOOKBOOK LOOKBOOK(1) (1).pdf
BASLIQ CURRENT LOOKBOOK  LOOKBOOK(1) (1).pdfBASLIQ CURRENT LOOKBOOK  LOOKBOOK(1) (1).pdf
BASLIQ CURRENT LOOKBOOK LOOKBOOK(1) (1).pdfSoniaTolstoy
 
Kisan Call Centre - To harness potential of ICT in Agriculture by answer farm...
Kisan Call Centre - To harness potential of ICT in Agriculture by answer farm...Kisan Call Centre - To harness potential of ICT in Agriculture by answer farm...
Kisan Call Centre - To harness potential of ICT in Agriculture by answer farm...Krashi Coaching
 
Z Score,T Score, Percential Rank and Box Plot Graph
Z Score,T Score, Percential Rank and Box Plot GraphZ Score,T Score, Percential Rank and Box Plot Graph
Z Score,T Score, Percential Rank and Box Plot GraphThiyagu K
 
microwave assisted reaction. General introduction
microwave assisted reaction. General introductionmicrowave assisted reaction. General introduction
microwave assisted reaction. General introductionMaksud Ahmed
 
Unit-IV- Pharma. Marketing Channels.pptx
Unit-IV- Pharma. Marketing Channels.pptxUnit-IV- Pharma. Marketing Channels.pptx
Unit-IV- Pharma. Marketing Channels.pptxVishalSingh1417
 
Measures of Dispersion and Variability: Range, QD, AD and SD
Measures of Dispersion and Variability: Range, QD, AD and SDMeasures of Dispersion and Variability: Range, QD, AD and SD
Measures of Dispersion and Variability: Range, QD, AD and SDThiyagu K
 

Recently uploaded (20)

APM Welcome, APM North West Network Conference, Synergies Across Sectors
APM Welcome, APM North West Network Conference, Synergies Across SectorsAPM Welcome, APM North West Network Conference, Synergies Across Sectors
APM Welcome, APM North West Network Conference, Synergies Across Sectors
 
Paris 2024 Olympic Geographies - an activity
Paris 2024 Olympic Geographies - an activityParis 2024 Olympic Geographies - an activity
Paris 2024 Olympic Geographies - an activity
 
Sports & Fitness Value Added Course FY..
Sports & Fitness Value Added Course FY..Sports & Fitness Value Added Course FY..
Sports & Fitness Value Added Course FY..
 
General AI for Medical Educators April 2024
General AI for Medical Educators April 2024General AI for Medical Educators April 2024
General AI for Medical Educators April 2024
 
Q4-W6-Restating Informational Text Grade 3
Q4-W6-Restating Informational Text Grade 3Q4-W6-Restating Informational Text Grade 3
Q4-W6-Restating Informational Text Grade 3
 
9548086042 for call girls in Indira Nagar with room service
9548086042  for call girls in Indira Nagar  with room service9548086042  for call girls in Indira Nagar  with room service
9548086042 for call girls in Indira Nagar with room service
 
SOCIAL AND HISTORICAL CONTEXT - LFTVD.pptx
SOCIAL AND HISTORICAL CONTEXT - LFTVD.pptxSOCIAL AND HISTORICAL CONTEXT - LFTVD.pptx
SOCIAL AND HISTORICAL CONTEXT - LFTVD.pptx
 
Web & Social Media Analytics Previous Year Question Paper.pdf
Web & Social Media Analytics Previous Year Question Paper.pdfWeb & Social Media Analytics Previous Year Question Paper.pdf
Web & Social Media Analytics Previous Year Question Paper.pdf
 
social pharmacy d-pharm 1st year by Pragati K. Mahajan
social pharmacy d-pharm 1st year by Pragati K. Mahajansocial pharmacy d-pharm 1st year by Pragati K. Mahajan
social pharmacy d-pharm 1st year by Pragati K. Mahajan
 
Explore beautiful and ugly buildings. Mathematics helps us create beautiful d...
Explore beautiful and ugly buildings. Mathematics helps us create beautiful d...Explore beautiful and ugly buildings. Mathematics helps us create beautiful d...
Explore beautiful and ugly buildings. Mathematics helps us create beautiful d...
 
Presentation by Andreas Schleicher Tackling the School Absenteeism Crisis 30 ...
Presentation by Andreas Schleicher Tackling the School Absenteeism Crisis 30 ...Presentation by Andreas Schleicher Tackling the School Absenteeism Crisis 30 ...
Presentation by Andreas Schleicher Tackling the School Absenteeism Crisis 30 ...
 
Student login on Anyboli platform.helpin
Student login on Anyboli platform.helpinStudent login on Anyboli platform.helpin
Student login on Anyboli platform.helpin
 
INDIA QUIZ 2024 RLAC DELHI UNIVERSITY.pptx
INDIA QUIZ 2024 RLAC DELHI UNIVERSITY.pptxINDIA QUIZ 2024 RLAC DELHI UNIVERSITY.pptx
INDIA QUIZ 2024 RLAC DELHI UNIVERSITY.pptx
 
BASLIQ CURRENT LOOKBOOK LOOKBOOK(1) (1).pdf
BASLIQ CURRENT LOOKBOOK  LOOKBOOK(1) (1).pdfBASLIQ CURRENT LOOKBOOK  LOOKBOOK(1) (1).pdf
BASLIQ CURRENT LOOKBOOK LOOKBOOK(1) (1).pdf
 
Kisan Call Centre - To harness potential of ICT in Agriculture by answer farm...
Kisan Call Centre - To harness potential of ICT in Agriculture by answer farm...Kisan Call Centre - To harness potential of ICT in Agriculture by answer farm...
Kisan Call Centre - To harness potential of ICT in Agriculture by answer farm...
 
Z Score,T Score, Percential Rank and Box Plot Graph
Z Score,T Score, Percential Rank and Box Plot GraphZ Score,T Score, Percential Rank and Box Plot Graph
Z Score,T Score, Percential Rank and Box Plot Graph
 
microwave assisted reaction. General introduction
microwave assisted reaction. General introductionmicrowave assisted reaction. General introduction
microwave assisted reaction. General introduction
 
Unit-IV- Pharma. Marketing Channels.pptx
Unit-IV- Pharma. Marketing Channels.pptxUnit-IV- Pharma. Marketing Channels.pptx
Unit-IV- Pharma. Marketing Channels.pptx
 
Advance Mobile Application Development class 07
Advance Mobile Application Development class 07Advance Mobile Application Development class 07
Advance Mobile Application Development class 07
 
Measures of Dispersion and Variability: Range, QD, AD and SD
Measures of Dispersion and Variability: Range, QD, AD and SDMeasures of Dispersion and Variability: Range, QD, AD and SD
Measures of Dispersion and Variability: Range, QD, AD and SD
 

Surfer 1.pdf

  • 1. Surfer-Surface Mapping Program Surfer, a powerful contouring, gridding, and surface mapping package for scientists, engineers, educators, or anyone who needs to generate maps quickly and easily. Producing publication quality maps has never been quicker or easier. Maps can be displayed and enhanced in Surfer. Adding multiple map layers, customizing the map display, and annotating with text can create publication quality maps. Virtually all aspects of your maps can be customized to produce exactly the presentation you want. Surfer is a grid-based mapping program that interpolates irregularly spaced XYZ data into a regularly spaced grid. Grids may also be imported from other sources, such as the United States regularly spaced grid. Grids may also be imported from other sources, such as the United States Geological Survey (USGS). The grid is used to produce different types of maps including contour, vector, image, shaded relief, 3D surface, and 3D wireframe maps. Many gridding and mapping options are available allowing you to produce the map that best represents your data 1
  • 2. Surfer User Interface The Surfer user interface layout consists of the title bar, menu bar, tabbed windows, toolbars, object manager, and status bar. Surfer contains three document window types: the plot document, worksheet document, and grid node editor. Maps are displayed and created in the plot document. The worksheet document displays, edits, transforms, and saves data in a tabular format. The grid node editor displays and edits Z values for the selected grid. 2
  • 3. 3
  • 4. Map Types Several different map types can be created, modified, and displayed with Surfer. These map types include contour, base, post, classed post, image, shaded relief, 1-grid vector, 2-grid vector, 3D surface, and 3D wireframe maps. 1. Contour Maps A contour map is a two-dimensional representation of three-dimensional data. Contours define lines of equal Z values across the map extents. The shape of the surface is shown by the contour lines. Contour maps can display the contour lines; they can also display colors and patterns between the contour lines. 2. Base Map Base maps display boundaries on a map. Boundaries can include roads, buildings, streams, lakes, etc. Base maps can be produced from several file formats. lakes, etc. Base maps can be produced from several file formats. Empty Base Maps allow you to create a base map with no objects. Objects can be manually added and removed as needed. 4
  • 5. 3. Post Maps Post maps and classed post maps show data locations on a map. Post symbols and the individual post label positions can be customized. 4. Image Maps and Shaded Relief Maps 4. Image Maps and Shaded Relief Maps Image maps and shaded relief maps are raster images based on grid files. Image maps assign colors based on Z values from a grid file. Shaded relief maps assign colors based on slope orientation relative to a light source. 5
  • 6. 5. Vector Maps 1-grid and 2-grid vector maps display direction and magnitude data using individually oriented arrows. For example, at any grid node on the map, the arrow points in the direction of steepest descent ("downhill") and the arrow length is proportional to the slope magnitude. In Surfer, vector maps can be created using the information in one grid file (i.e. a numerically computed gradient) or two different grid files (i.e. each grid giving a component of the vectors). 6. 3D Surfaces Surfaces are color three-dimensional representations of a grid file. The colors, lighting, overlays, and mesh can be altered on a 3D surface. 7. 3D Wireframes Wireframes are three-dimensional representations of a grid file. A wireframe is created by connecting Z values along lines of constant X and Y. At each XY intersection (grid node), the connecting Z values along lines of constant X and Y. At each XY intersection (grid node), the height of the wireframe is proportional to the Z value assigned to that node. The number of columns and rows in the grid file determines the number of X and Y lines drawn on the wireframe. 6
  • 7. Surfer Flow Chart This flow chart illustrates the relationship between XYZ data files, grid files and any grid based map .This example displays only two of the grid based maps (i.e. contour and 3D surface). The general steps to create a grid-based map are as follows: 1. Create a XYZ data file. This file can be created in a Surfer worksheet window or outside of Surfer (using an ASCII text editor, for example). 2. Create a grid file [.GRD] from the XYZ data file using the Grid | Data command. 3. To create a map, select the map type from the Map menu and use the grid file from step two. Grid-based maps include contour, image, shaded relief, vector, 3D surface, and 3D wireframe maps. File | Save 7 4. Use File | Save to save the map as a Surfer file [SRF.].
  • 8. 8