Download as PDF, PPTX
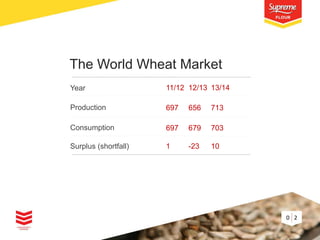
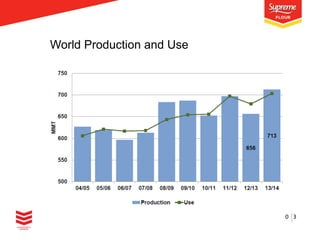
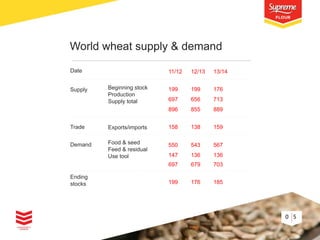
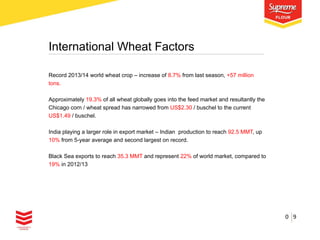
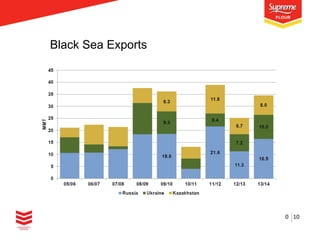
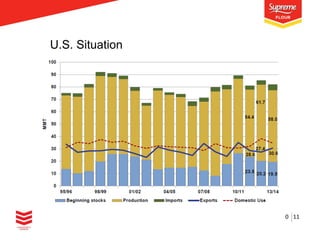
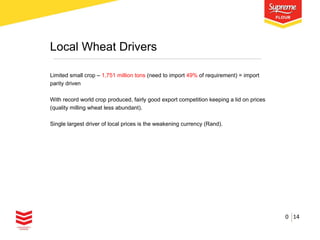

The report details global wheat supply and demand for the years 2011/12 to 2013/14, highlighting a significant increase in world wheat production by 8.7% for the 2013/14 season. India is noted for its higher role in the export market with production reaching 92.5 million tons, while Black Sea exports have also risen to 35.3 million tons. The U.S. and South Africa face unique challenges, with the latter requiring substantial imports due to a limited local crop.


