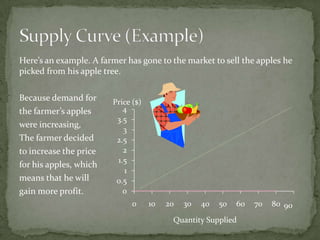
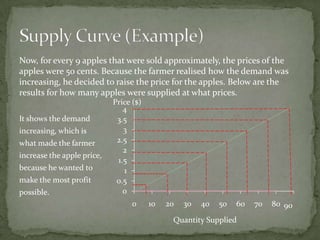
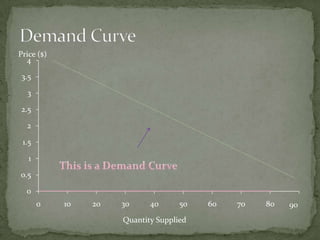
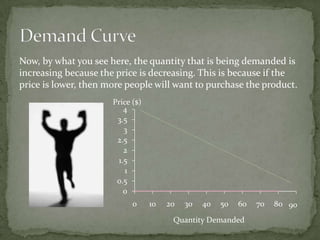
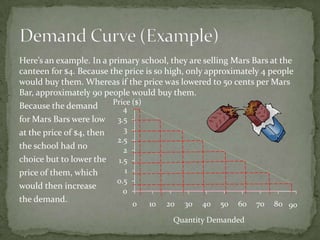
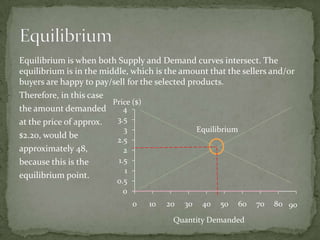
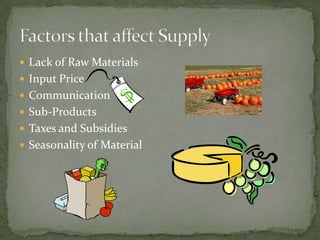
By Flavio Alves 13I
 When businesses are considering the price of their products

and services, they will sometimes go and look at Supply and
Demand.
 Supply looks at the price setting point, from the view of the

business.
 Demand looks at the same process, but from the

consumer/customer’s views.
What is it?
 Definition – Supply is the amount of goods that
producers are willing to supply or sell at a given price.
What is it?
 Definition – Demand is an amount that an individual
or individuals are willing to buy at a given price.
What is it?
 Equilibrium is when the Demand and Supply are
equal.
Price ($)
4
3.5
3
2.5
2

1.5
1
0.5

0
0

10

20

30

40

50

Quantity Supplied

60

70

80

90
Now, by what you see here, the quantity that is being
supplied is raising, therefore meaning that the price is also
raising, because the demand is increasing.
Price ($)
4
3.5
3
2.5
2
1.5
1
0.5
0
0

10

20

30

40

50

60

Quantity Supplied

70

80 90
Here’s an example. A farmer has gone to the market to sell the apples he
picked from his apple tree.
Because demand for
the farmer’s apples
were increasing,
The farmer decided
to increase the price
for his apples, which
means that he will
gain more profit.

Price ($)
4
3.5
3
2.5
2
1.5
1
0.5
0
0

10

20

30

40

50

60

Quantity Supplied

70

80 90
Now, for every 9 apples that were sold approximately, the prices of the
apples were 50 cents. Because the farmer realised how the demand was
increasing, he decided to raise the price for the apples. Below are the
results for how many apples were supplied at what prices.
It shows the demand
increasing, which is
what made the farmer
increase the apple price,
because he wanted to
make the most profit

possible.

Price ($)
4
3.5
3
2.5
2
1.5
1 -----------0.5 ----0
0

10

20

30

40

50

60

Quantity Supplied

70

80 90
Price ($)
4
3.5
3
2.5
2

1.5
1
0.5

0
0

10

20

30

40

50

Quantity Supplied

60

70

80

90
Now, by what you see here, the quantity that is being demanded is
increasing because the price is decreasing. This is because if the
price is lower, then more people will want to purchase the product.
Price ($)
4
3.5
3
2.5
2
1.5
1
0.5
0
0

10

20

30

40

50

60

Quantity Demanded

70

80 90
Here’s an example. In a primary school, they are selling Mars Bars at the
canteen for $4. Because the price is so high, only approximately 4 people
would buy them. Whereas if the price was lowered to 50 cents per Mars
Bar, approximately 90 people would buy them.
Price ($)
Because the demand
4
for Mars Bars were low 3.5
3
at the price of $4, then
2.5
the school had no
2
choice but to lower the 1.5
1
price of them, which
0.5
would then increase
0
the demand.
0
10 20 30 40 50 60 70 80

90

Quantity Demanded
Equilibrium is when both Supply and Demand curves intersect. The
equilibrium is in the middle, which is the amount that the sellers and/or
buyers are happy to pay/sell for the selected products.
Therefore, in this case
Price ($)
the amount demanded
4
3.5
at the price of approx.
Equilibrium
3
$2.20, would be
2.5
approximately 48,
2
1.5
because this is the
1
equilibrium point.
0.5
0

0

10

20

30

40

50

60

Quantity Demanded

70

80 90
 Lack of Raw Materials
 Input Price
 Communication
 Sub-Products
 Taxes and Subsidies
 Seasonality of Material
 Seasonality of Products
 Disposable Income
 State of Economy
 Competitors
 Demographic
 Price
 Complimentary Product

Supply and Demand Presentation

  • 1.
  • 2.
     When businessesare considering the price of their products and services, they will sometimes go and look at Supply and Demand.  Supply looks at the price setting point, from the view of the business.  Demand looks at the same process, but from the consumer/customer’s views.
  • 3.
    What is it? Definition – Supply is the amount of goods that producers are willing to supply or sell at a given price.
  • 4.
    What is it? Definition – Demand is an amount that an individual or individuals are willing to buy at a given price.
  • 5.
    What is it? Equilibrium is when the Demand and Supply are equal.
  • 6.
  • 7.
    Now, by whatyou see here, the quantity that is being supplied is raising, therefore meaning that the price is also raising, because the demand is increasing. Price ($) 4 3.5 3 2.5 2 1.5 1 0.5 0 0 10 20 30 40 50 60 Quantity Supplied 70 80 90
  • 8.
    Here’s an example.A farmer has gone to the market to sell the apples he picked from his apple tree. Because demand for the farmer’s apples were increasing, The farmer decided to increase the price for his apples, which means that he will gain more profit. Price ($) 4 3.5 3 2.5 2 1.5 1 0.5 0 0 10 20 30 40 50 60 Quantity Supplied 70 80 90
  • 9.
    Now, for every9 apples that were sold approximately, the prices of the apples were 50 cents. Because the farmer realised how the demand was increasing, he decided to raise the price for the apples. Below are the results for how many apples were supplied at what prices. It shows the demand increasing, which is what made the farmer increase the apple price, because he wanted to make the most profit possible. Price ($) 4 3.5 3 2.5 2 1.5 1 -----------0.5 ----0 0 10 20 30 40 50 60 Quantity Supplied 70 80 90
  • 10.
  • 11.
    Now, by whatyou see here, the quantity that is being demanded is increasing because the price is decreasing. This is because if the price is lower, then more people will want to purchase the product. Price ($) 4 3.5 3 2.5 2 1.5 1 0.5 0 0 10 20 30 40 50 60 Quantity Demanded 70 80 90
  • 12.
    Here’s an example.In a primary school, they are selling Mars Bars at the canteen for $4. Because the price is so high, only approximately 4 people would buy them. Whereas if the price was lowered to 50 cents per Mars Bar, approximately 90 people would buy them. Price ($) Because the demand 4 for Mars Bars were low 3.5 3 at the price of $4, then 2.5 the school had no 2 choice but to lower the 1.5 1 price of them, which 0.5 would then increase 0 the demand. 0 10 20 30 40 50 60 70 80 90 Quantity Demanded
  • 13.
    Equilibrium is whenboth Supply and Demand curves intersect. The equilibrium is in the middle, which is the amount that the sellers and/or buyers are happy to pay/sell for the selected products. Therefore, in this case Price ($) the amount demanded 4 3.5 at the price of approx. Equilibrium 3 $2.20, would be 2.5 approximately 48, 2 1.5 because this is the 1 equilibrium point. 0.5 0 0 10 20 30 40 50 60 Quantity Demanded 70 80 90
  • 14.
     Lack ofRaw Materials  Input Price  Communication  Sub-Products  Taxes and Subsidies  Seasonality of Material
  • 15.
     Seasonality ofProducts  Disposable Income  State of Economy  Competitors  Demographic  Price  Complimentary Product