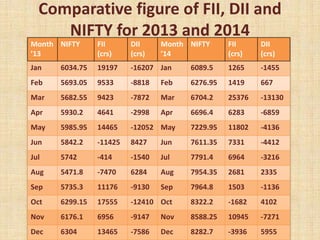
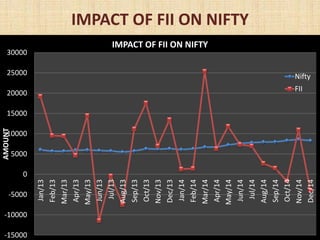
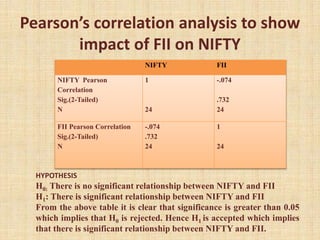
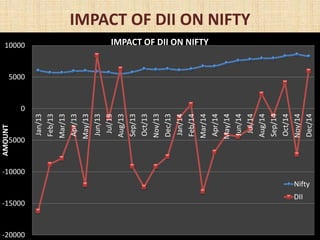
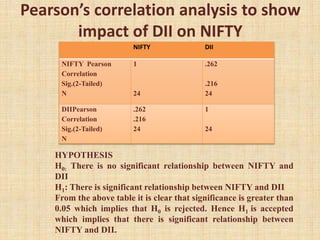
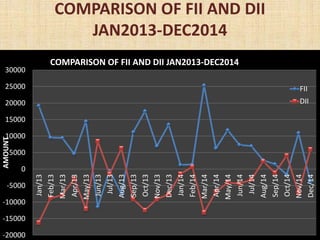
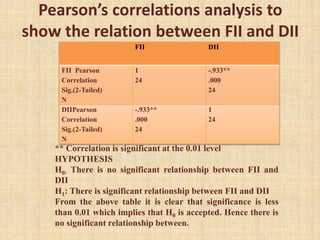
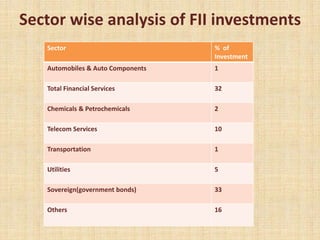
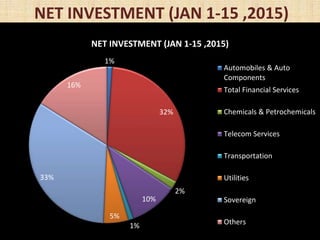
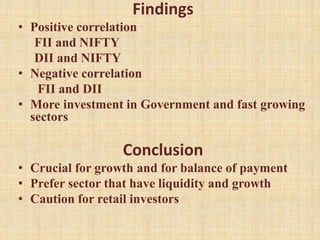
STUDY ON FII AND DII
With reference to flow of funds in Indian
stock market
By
R.Mirnalini
R.Nithya
Introduction
Who are FIIs ?
Foreign Institutional Investor (FII) is “An
institution established or incorporated outside
India which proposes to make investment in
securities in India”.
Who are DIIs?
Domestic Institutional Investors (DII) refers to
institutions that undertake investment in
securities and other financial assets of the
country in which they are based.
What is NIFTY ?
• It is the index of National Stock Exchange
• It reflects the market movements
• It is the tool for measuring risk and return
• It is a basis for introducing index based
derivatives
•Ghosh and Srinivasan
They concluded that DII impact on BSE is limited and BSE
index cannot be predicted by FII or DII activity.
•Sharma
One of her finding was FII investments are concentrated on
a very few companies.
•Halalen
He concluded that FII play a significant role in driving the
Indian stock market.
•Patnik and Shah
They concluded that DII poses a superior investment
technology than FII.
Literature Review
Objectives
• To identify the relationship between FII and
NIFTY index movements.
• To indentify the relationship between DII
and NIFTY.
• To identify the relationship between FII and
DII.
• Analysis of different sectors with FII
investments in India.
Scope
•Index of National stock exchange NIFTY is
considered other indexes can also be
considered.
•The net sale and purchase made by
Foreign Institutional Investors and Domestic
Institutional Investors for the period January
2013 to December 2014 is considered.
•Relationship between FII, DII and market is
analysed using correlation.
Research Methodology
• Data for this study is taken from NSE and
Money Control websites
• Time period considered is from January 2013
to December 2014
• For sector analysis time period is taken from
January 1st to 15th 2015
• Correlation between FII , DII and NIFTY has
been found using SPSS 18.0
Limitation
• Period of analysis taken is only from 2013 to
2014.
• Other indexes are not considered.
Comparative figure of FII, DII and
NIFTY for 2013 and 2014
Month
’13
NIFTY FII
(crs)
DII
(crs)
Month
’14
NIFTY FII
(crs)
DII
(crs)
Jan 6034.75 19197 -16207 Jan 6089.5 1265 -1455
Feb 5693.05 9533 -8818 Feb 6276.95 1419 667
Mar 5682.55 9423 -7872 Mar 6704.2 25376 -13130
Apr 5930.2 4641 -2998 Apr 6696.4 6283 -6859
May 5985.95 14465 -12052 May 7229.95 11802 -4136
Jun 5842.2 -11425 8427 Jun 7611.35 7331 -4412
Jul 5742 -414 -1540 Jul 7791.4 6964 -3216
Aug 5471.8 -7470 6284 Aug 7954.35 2681 2335
Sep 5735.3 11176 -9130 Sep 7964.8 1503 -1136
Oct 6299.15 17555 -12410 Oct 8322.2 -1682 4102
Nov 6176.1 6956 -9147 Nov 8588.25 10945 -7271
Dec 6304 13465 -7586 Dec 8282.7 -3936 5955
IMPACT OF FII ON NIFTY
-15000
-10000
-5000
0
5000
10000
15000
20000
25000
30000
Jan/13
Feb/13
Mar/13
Apr/13
May/13
Jun/13
Jul/13
Aug/13
Sep/13
Oct/13
Nov/13
Dec/13
Jan/14
Feb/14
Mar/14
Apr/14
May/14
Jun/14
Jul/14
Aug/14
Sep/14
Oct/14
Nov/14
Dec/14
AMOUNT
IMPACT OF FII ON NIFTY
Nifty
FII
Pearson’s correlation analysis to show
impact of FII on NIFTY
NIFTY FII
NIFTY Pearson
Correlation
Sig.(2-Tailed)
N
1
24
-.074
.732
24
FII Pearson Correlation
Sig.(2-Tailed)
N
-.074
.732
24
1
24
HYPOTHESIS
H0: There is no significant relationship between NIFTY and FII
H1: There is significant relationship between NIFTY and FII
From the above table it is clear that significance is greater than 0.05
which implies that H0 is rejected. Hence H1 is accepted which implies
that there is significant relationship between NIFTY and FII.
IMPACT OF DII ON NIFTY
-20000
-15000
-10000
-5000
0
5000
10000
Jan/13
Feb/13
Mar/13
Apr/13
May/13
Jun/13
Jul/13
Aug/13
Sep/13
Oct/13
Nov/13
Dec/13
Jan/14
Feb/14
Mar/14
Apr/14
May/14
Jun/14
Jul/14
Aug/14
Sep/14
Oct/14
Nov/14
Dec/14
AMOUNT
IMPACT OF DII ON NIFTY
Nifty
DII
Pearson’s correlation analysis to show
impact of DII on NIFTY
NIFTY DII
NIFTY Pearson
Correlation
Sig.(2-Tailed)
N
1
24
.262
.216
24
DIIPearson
Correlation
Sig.(2-Tailed)
N
.262
.216
24
1
24
HYPOTHESIS
H0: There is no significant relationship between NIFTY and
DII
H1: There is significant relationship between NIFTY and DII
From the above table it is clear that significance is greater than
0.05 which implies that H0 is rejected. Hence H1 is accepted
which implies that there is significant relationship between
NIFTY and DII.
COMPARISON OF FII AND DII
JAN2013-DEC2014
-20000
-15000
-10000
-5000
0
5000
10000
15000
20000
25000
30000
Jan/13
Feb/13
Mar/13
Apr/13
May/13
Jun/13
Jul/13
Aug/13
Sep/13
Oct/13
Nov/13
Dec/13
Jan/14
Feb/14
Mar/14
Apr/14
May/14
Jun/14
Jul/14
Aug/14
Sep/14
Oct/14
Nov/14
Dec/14
AMOUNT
COMPARISON OF FII AND DII JAN2013-DEC2014
FII
DII
Pearson’s correlations analysis to
show the relation between FII and DII
FII DII
FII Pearson
Correlation
Sig.(2-Tailed)
N
1
24
-.933**
.000
24
DIIPearson
Correlation
Sig.(2-Tailed)
N
-.933**
.000
24
1
24
** Correlation is significant at the 0.01 level
HYPOTHESIS
H0: There is no significant relationship between FII and
DII
H1: There is significant relationship between FII and DII
From the above table it is clear that significance is less
than 0.01 which implies that H0 is accepted. Hence there is
no significant relationship between.
Sector wise analysis of FII investments
Sector % of
Investment
Automobiles & Auto Components 1
Total Financial Services 32
Chemicals & Petrochemicals 2
Telecom Services 10
Transportation 1
Utilities 5
Sovereign(government bonds) 33
Others 16
NET INVESTMENT (JAN 1-15 ,2015)
1%
32%
2%
10%
1%
5%
33%
16%
NET INVESTMENT (JAN 1-15 ,2015)
Automobiles & Auto
Components
Total Financial Services
Chemicals & Petrochemicals
Telecom Services
Transportation
Utilities
Sovereign
Others
Findings
• Positive correlation
FII and NIFTY
DII and NIFTY
• Negative correlation
FII and DII
• More investment in Government and fast growing
sectors
Conclusion
• Crucial for growth and for balance of payment
• Prefer sector that have liquidity and growth
• Caution for retail investors
Study on FII and DII

Study on FII and DII

  • 1.
    STUDY ON FIIAND DII With reference to flow of funds in Indian stock market By R.Mirnalini R.Nithya
  • 2.
    Introduction Who are FIIs? Foreign Institutional Investor (FII) is “An institution established or incorporated outside India which proposes to make investment in securities in India”. Who are DIIs? Domestic Institutional Investors (DII) refers to institutions that undertake investment in securities and other financial assets of the country in which they are based.
  • 3.
    What is NIFTY? • It is the index of National Stock Exchange • It reflects the market movements • It is the tool for measuring risk and return • It is a basis for introducing index based derivatives
  • 4.
    •Ghosh and Srinivasan Theyconcluded that DII impact on BSE is limited and BSE index cannot be predicted by FII or DII activity. •Sharma One of her finding was FII investments are concentrated on a very few companies. •Halalen He concluded that FII play a significant role in driving the Indian stock market. •Patnik and Shah They concluded that DII poses a superior investment technology than FII. Literature Review
  • 5.
    Objectives • To identifythe relationship between FII and NIFTY index movements. • To indentify the relationship between DII and NIFTY. • To identify the relationship between FII and DII. • Analysis of different sectors with FII investments in India.
  • 6.
    Scope •Index of Nationalstock exchange NIFTY is considered other indexes can also be considered. •The net sale and purchase made by Foreign Institutional Investors and Domestic Institutional Investors for the period January 2013 to December 2014 is considered. •Relationship between FII, DII and market is analysed using correlation.
  • 7.
    Research Methodology • Datafor this study is taken from NSE and Money Control websites • Time period considered is from January 2013 to December 2014 • For sector analysis time period is taken from January 1st to 15th 2015 • Correlation between FII , DII and NIFTY has been found using SPSS 18.0
  • 8.
    Limitation • Period ofanalysis taken is only from 2013 to 2014. • Other indexes are not considered.
  • 10.
    Comparative figure ofFII, DII and NIFTY for 2013 and 2014 Month ’13 NIFTY FII (crs) DII (crs) Month ’14 NIFTY FII (crs) DII (crs) Jan 6034.75 19197 -16207 Jan 6089.5 1265 -1455 Feb 5693.05 9533 -8818 Feb 6276.95 1419 667 Mar 5682.55 9423 -7872 Mar 6704.2 25376 -13130 Apr 5930.2 4641 -2998 Apr 6696.4 6283 -6859 May 5985.95 14465 -12052 May 7229.95 11802 -4136 Jun 5842.2 -11425 8427 Jun 7611.35 7331 -4412 Jul 5742 -414 -1540 Jul 7791.4 6964 -3216 Aug 5471.8 -7470 6284 Aug 7954.35 2681 2335 Sep 5735.3 11176 -9130 Sep 7964.8 1503 -1136 Oct 6299.15 17555 -12410 Oct 8322.2 -1682 4102 Nov 6176.1 6956 -9147 Nov 8588.25 10945 -7271 Dec 6304 13465 -7586 Dec 8282.7 -3936 5955
  • 11.
    IMPACT OF FIION NIFTY -15000 -10000 -5000 0 5000 10000 15000 20000 25000 30000 Jan/13 Feb/13 Mar/13 Apr/13 May/13 Jun/13 Jul/13 Aug/13 Sep/13 Oct/13 Nov/13 Dec/13 Jan/14 Feb/14 Mar/14 Apr/14 May/14 Jun/14 Jul/14 Aug/14 Sep/14 Oct/14 Nov/14 Dec/14 AMOUNT IMPACT OF FII ON NIFTY Nifty FII
  • 12.
    Pearson’s correlation analysisto show impact of FII on NIFTY NIFTY FII NIFTY Pearson Correlation Sig.(2-Tailed) N 1 24 -.074 .732 24 FII Pearson Correlation Sig.(2-Tailed) N -.074 .732 24 1 24 HYPOTHESIS H0: There is no significant relationship between NIFTY and FII H1: There is significant relationship between NIFTY and FII From the above table it is clear that significance is greater than 0.05 which implies that H0 is rejected. Hence H1 is accepted which implies that there is significant relationship between NIFTY and FII.
  • 13.
    IMPACT OF DIION NIFTY -20000 -15000 -10000 -5000 0 5000 10000 Jan/13 Feb/13 Mar/13 Apr/13 May/13 Jun/13 Jul/13 Aug/13 Sep/13 Oct/13 Nov/13 Dec/13 Jan/14 Feb/14 Mar/14 Apr/14 May/14 Jun/14 Jul/14 Aug/14 Sep/14 Oct/14 Nov/14 Dec/14 AMOUNT IMPACT OF DII ON NIFTY Nifty DII
  • 14.
    Pearson’s correlation analysisto show impact of DII on NIFTY NIFTY DII NIFTY Pearson Correlation Sig.(2-Tailed) N 1 24 .262 .216 24 DIIPearson Correlation Sig.(2-Tailed) N .262 .216 24 1 24 HYPOTHESIS H0: There is no significant relationship between NIFTY and DII H1: There is significant relationship between NIFTY and DII From the above table it is clear that significance is greater than 0.05 which implies that H0 is rejected. Hence H1 is accepted which implies that there is significant relationship between NIFTY and DII.
  • 15.
    COMPARISON OF FIIAND DII JAN2013-DEC2014 -20000 -15000 -10000 -5000 0 5000 10000 15000 20000 25000 30000 Jan/13 Feb/13 Mar/13 Apr/13 May/13 Jun/13 Jul/13 Aug/13 Sep/13 Oct/13 Nov/13 Dec/13 Jan/14 Feb/14 Mar/14 Apr/14 May/14 Jun/14 Jul/14 Aug/14 Sep/14 Oct/14 Nov/14 Dec/14 AMOUNT COMPARISON OF FII AND DII JAN2013-DEC2014 FII DII
  • 16.
    Pearson’s correlations analysisto show the relation between FII and DII FII DII FII Pearson Correlation Sig.(2-Tailed) N 1 24 -.933** .000 24 DIIPearson Correlation Sig.(2-Tailed) N -.933** .000 24 1 24 ** Correlation is significant at the 0.01 level HYPOTHESIS H0: There is no significant relationship between FII and DII H1: There is significant relationship between FII and DII From the above table it is clear that significance is less than 0.01 which implies that H0 is accepted. Hence there is no significant relationship between.
  • 17.
    Sector wise analysisof FII investments Sector % of Investment Automobiles & Auto Components 1 Total Financial Services 32 Chemicals & Petrochemicals 2 Telecom Services 10 Transportation 1 Utilities 5 Sovereign(government bonds) 33 Others 16
  • 18.
    NET INVESTMENT (JAN1-15 ,2015) 1% 32% 2% 10% 1% 5% 33% 16% NET INVESTMENT (JAN 1-15 ,2015) Automobiles & Auto Components Total Financial Services Chemicals & Petrochemicals Telecom Services Transportation Utilities Sovereign Others
  • 19.
    Findings • Positive correlation FIIand NIFTY DII and NIFTY • Negative correlation FII and DII • More investment in Government and fast growing sectors Conclusion • Crucial for growth and for balance of payment • Prefer sector that have liquidity and growth • Caution for retail investors