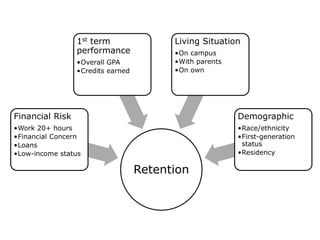
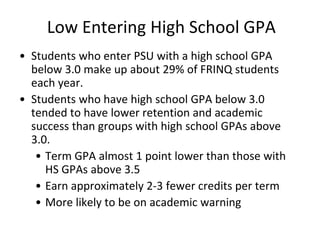
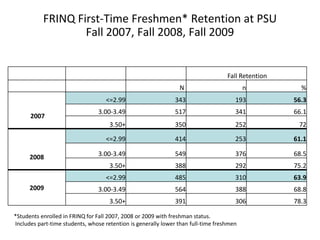
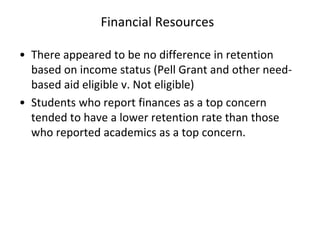
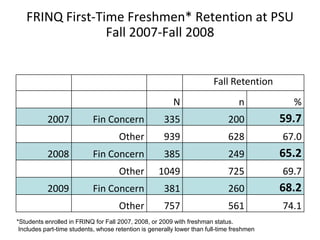
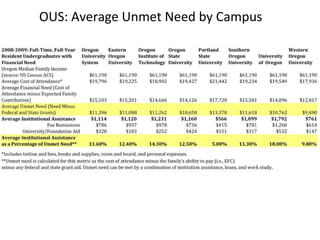
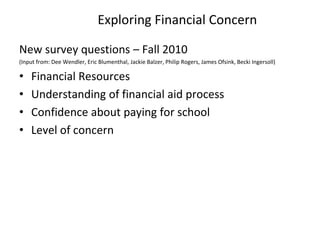
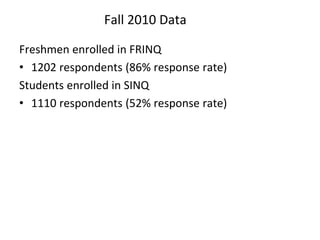
Freshman Inquiry Retention Updated Findings Updated FindingsSukhwant Jhaj, Rowanna CarpenterUniversity StudiesPortland State UniversityJanuary 13, 2011
Evolving Assessment StructurePrior Learning Survey--Student background characteristics--Student rating of academic skills--Student current life situation End of Year Survey--Course evaluation--Academic Plans--SatisfactionE-Portfolio Assessment--Student learning re: UNST goals
Evolving Assessment StructurePrior Learning SurveyEnd of Year SurveyE-Portfolio AssessmentUniversity Student Data Warehouse  - Student Retention  - Academic Performance, Fin. Aid
Focus on First-Time Freshmen in FRINQ2708 Freshmen
1274 Fall 2007, 1434 Fall 2008, 1440 Fall 2009
Enrolled in a FRINQ course Fall term
Includes both full-time and part-time students
NOT
Honors, Liberal Studies, Pre-nursing or others not required to take UNST
3458 completed the Prior Learning Survey
83.4% response rateStudent Success
Presentation FocusData AnalysisFall 2007, 2008, 2009 cohorts analyzed together
Data from SINQ Groups of InterestFreshmen with entering HS GPAs below 3.0
Freshmen who indicate finances as a top concern
Freshmen living with parents compared with those living on campus or on their own
Low Entering High School GPAStudents who enter PSU with a high school GPA below 3.0 make up about 29% of FRINQ students each year.
Students who have high school GPA below 3.0 tended to have lower retention and academic success than groups with high school GPAs above 3.0.
Term GPA almost 1 point lower than those with HS GPAs above 3.5
Earn approximately 2-3 fewer credits per term
More likely to be on academic warningFRINQ First-Time Freshmen* Retention at PSU Fall 2007, Fall 2008, Fall 2009
Financial ResourcesThere appeared to be no difference in retention based on income status (Pell Grant and other need-based aid eligible v. Not eligible)
Students who report finances as a top concern tended to have a lower retention rate than those who reported academics as a top concern.FRINQ First-Time Freshmen* Retention at PSU Fall 2007-Fall 2008
OUS: Average Unmet Need by Campus
Exploring Financial ConcernNew survey questions – Fall 2010(Input from: Dee Wendler, Eric Blumenthal, Jackie Balzer, Philip Rogers, James Ofsink, Becki Ingersoll)Financial Resources
Understanding of financial aid process
Confidence about paying for school
Level of concernFall 2010 DataFreshmen enrolled in FRINQ1202 respondents (86% response rate)Students enrolled in SINQ1110 respondents (52% response rate)Top Concern by UNST Level
FRINQ Financial ResourcesStudents with financial concern pay for school with more types of resources (own money, grants, loans)
Students with other concerns have more access to family resourcesSINQ Financial ResourcesStudents with financial concern are more likely to rely on loans
Both groups rely equally on their own resources

Student Retention: Updated Findings 2011

Editor's Notes

  • #7 N = 1142
  • #8 These groups of students have shown lower retention for both yearsThey seem to be distinct groups