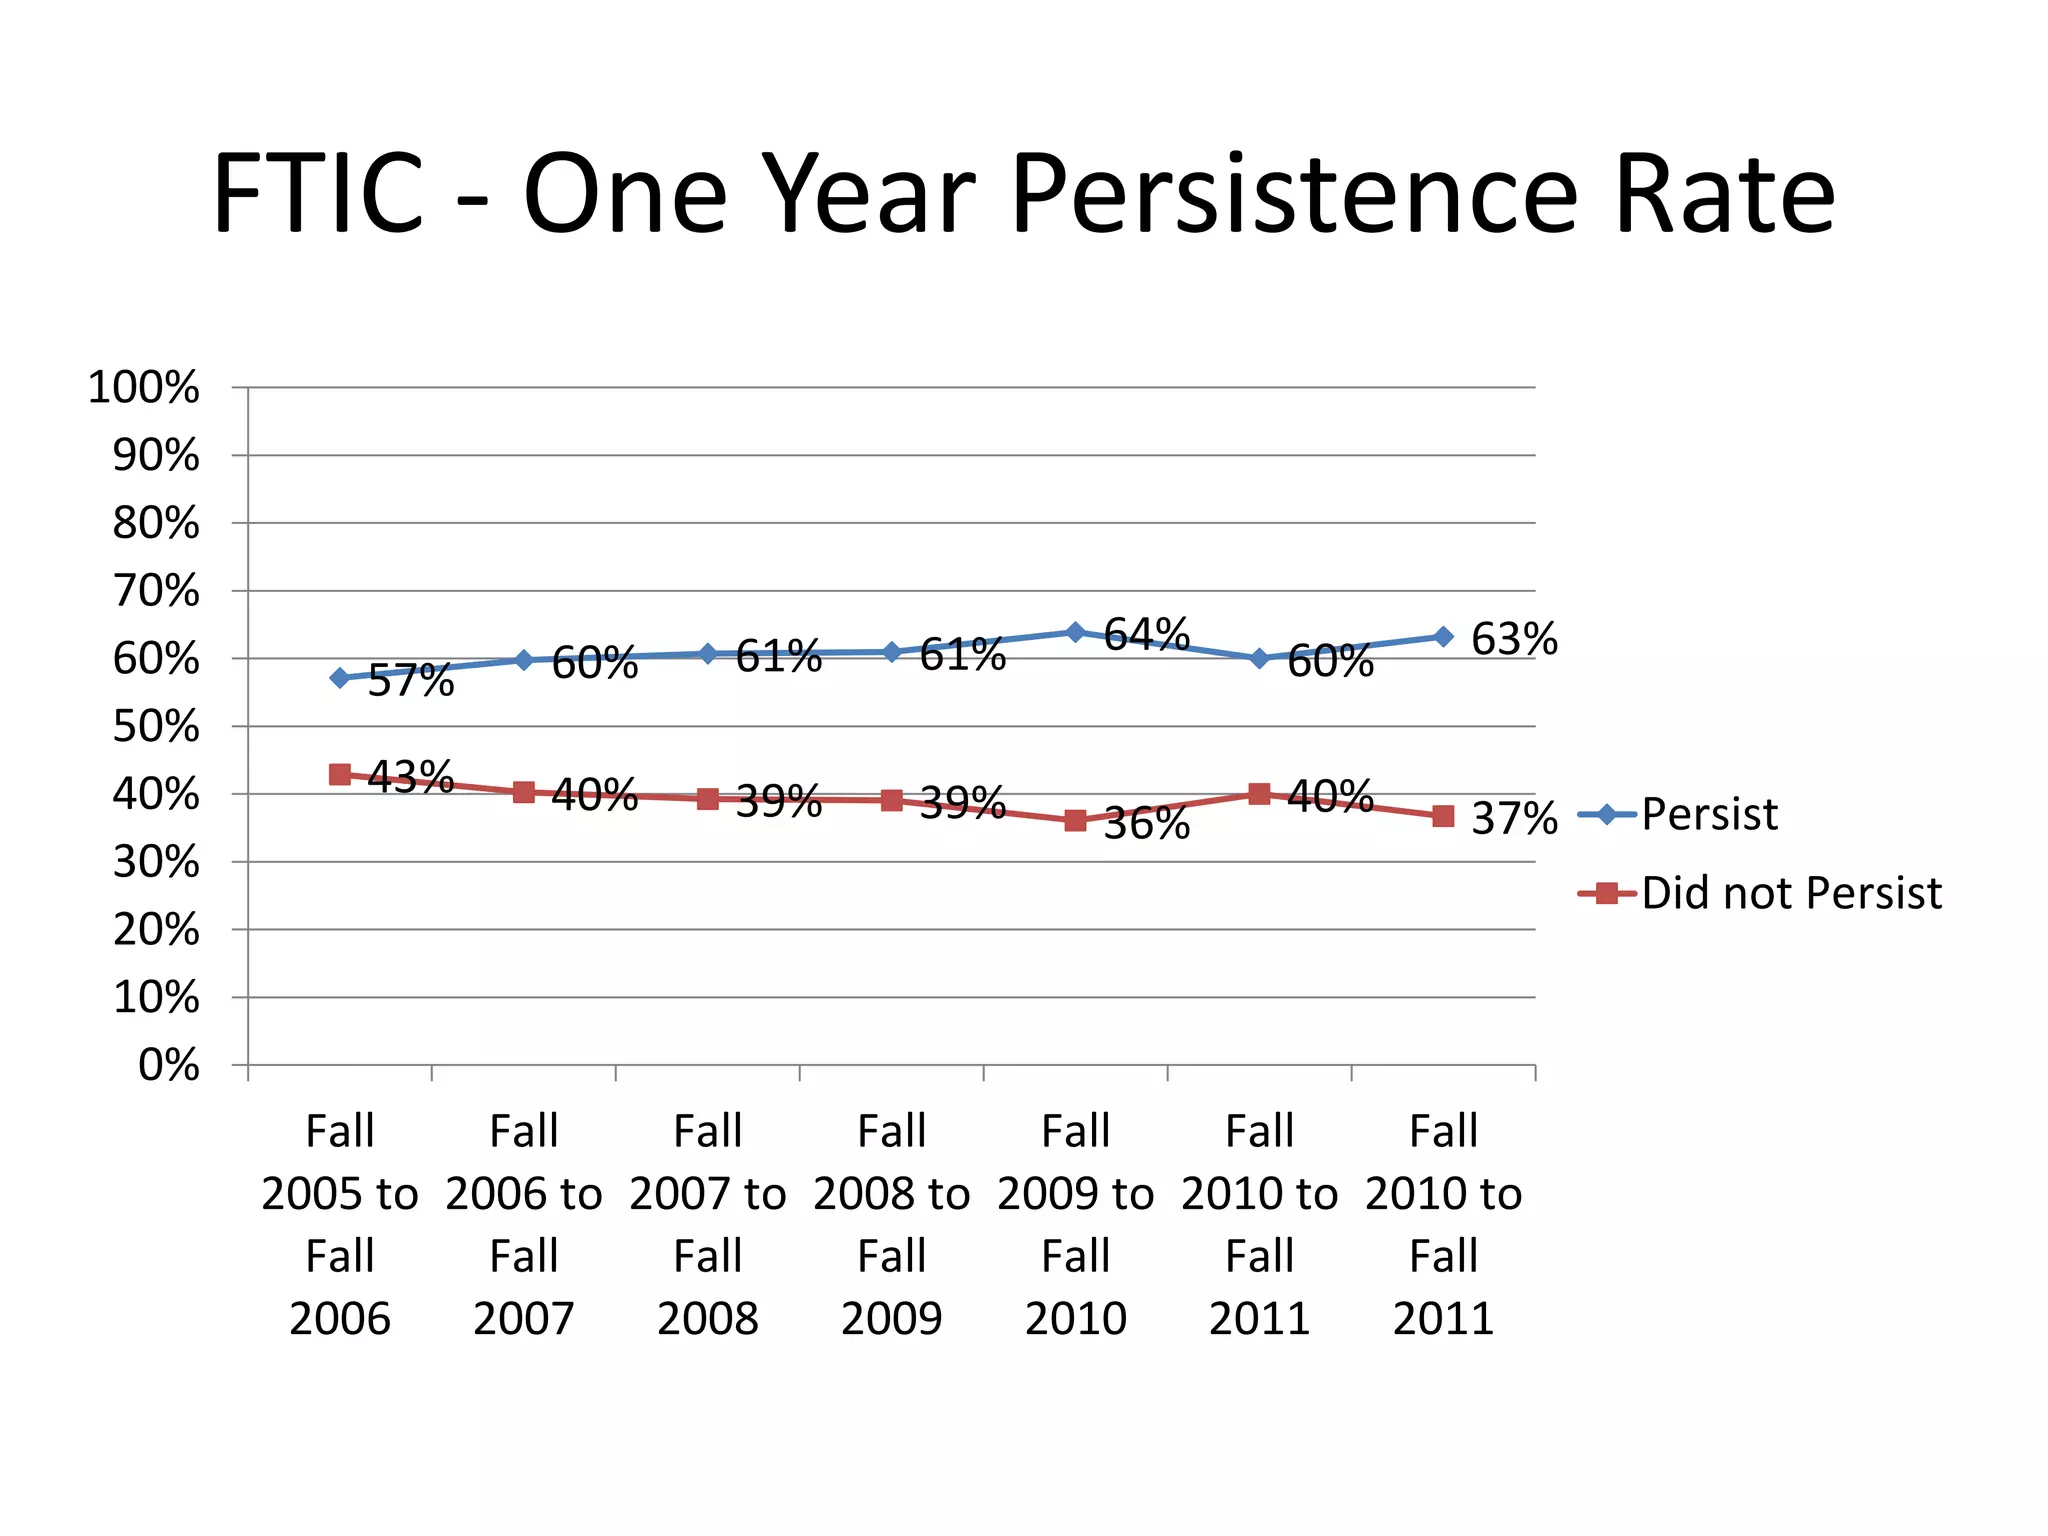
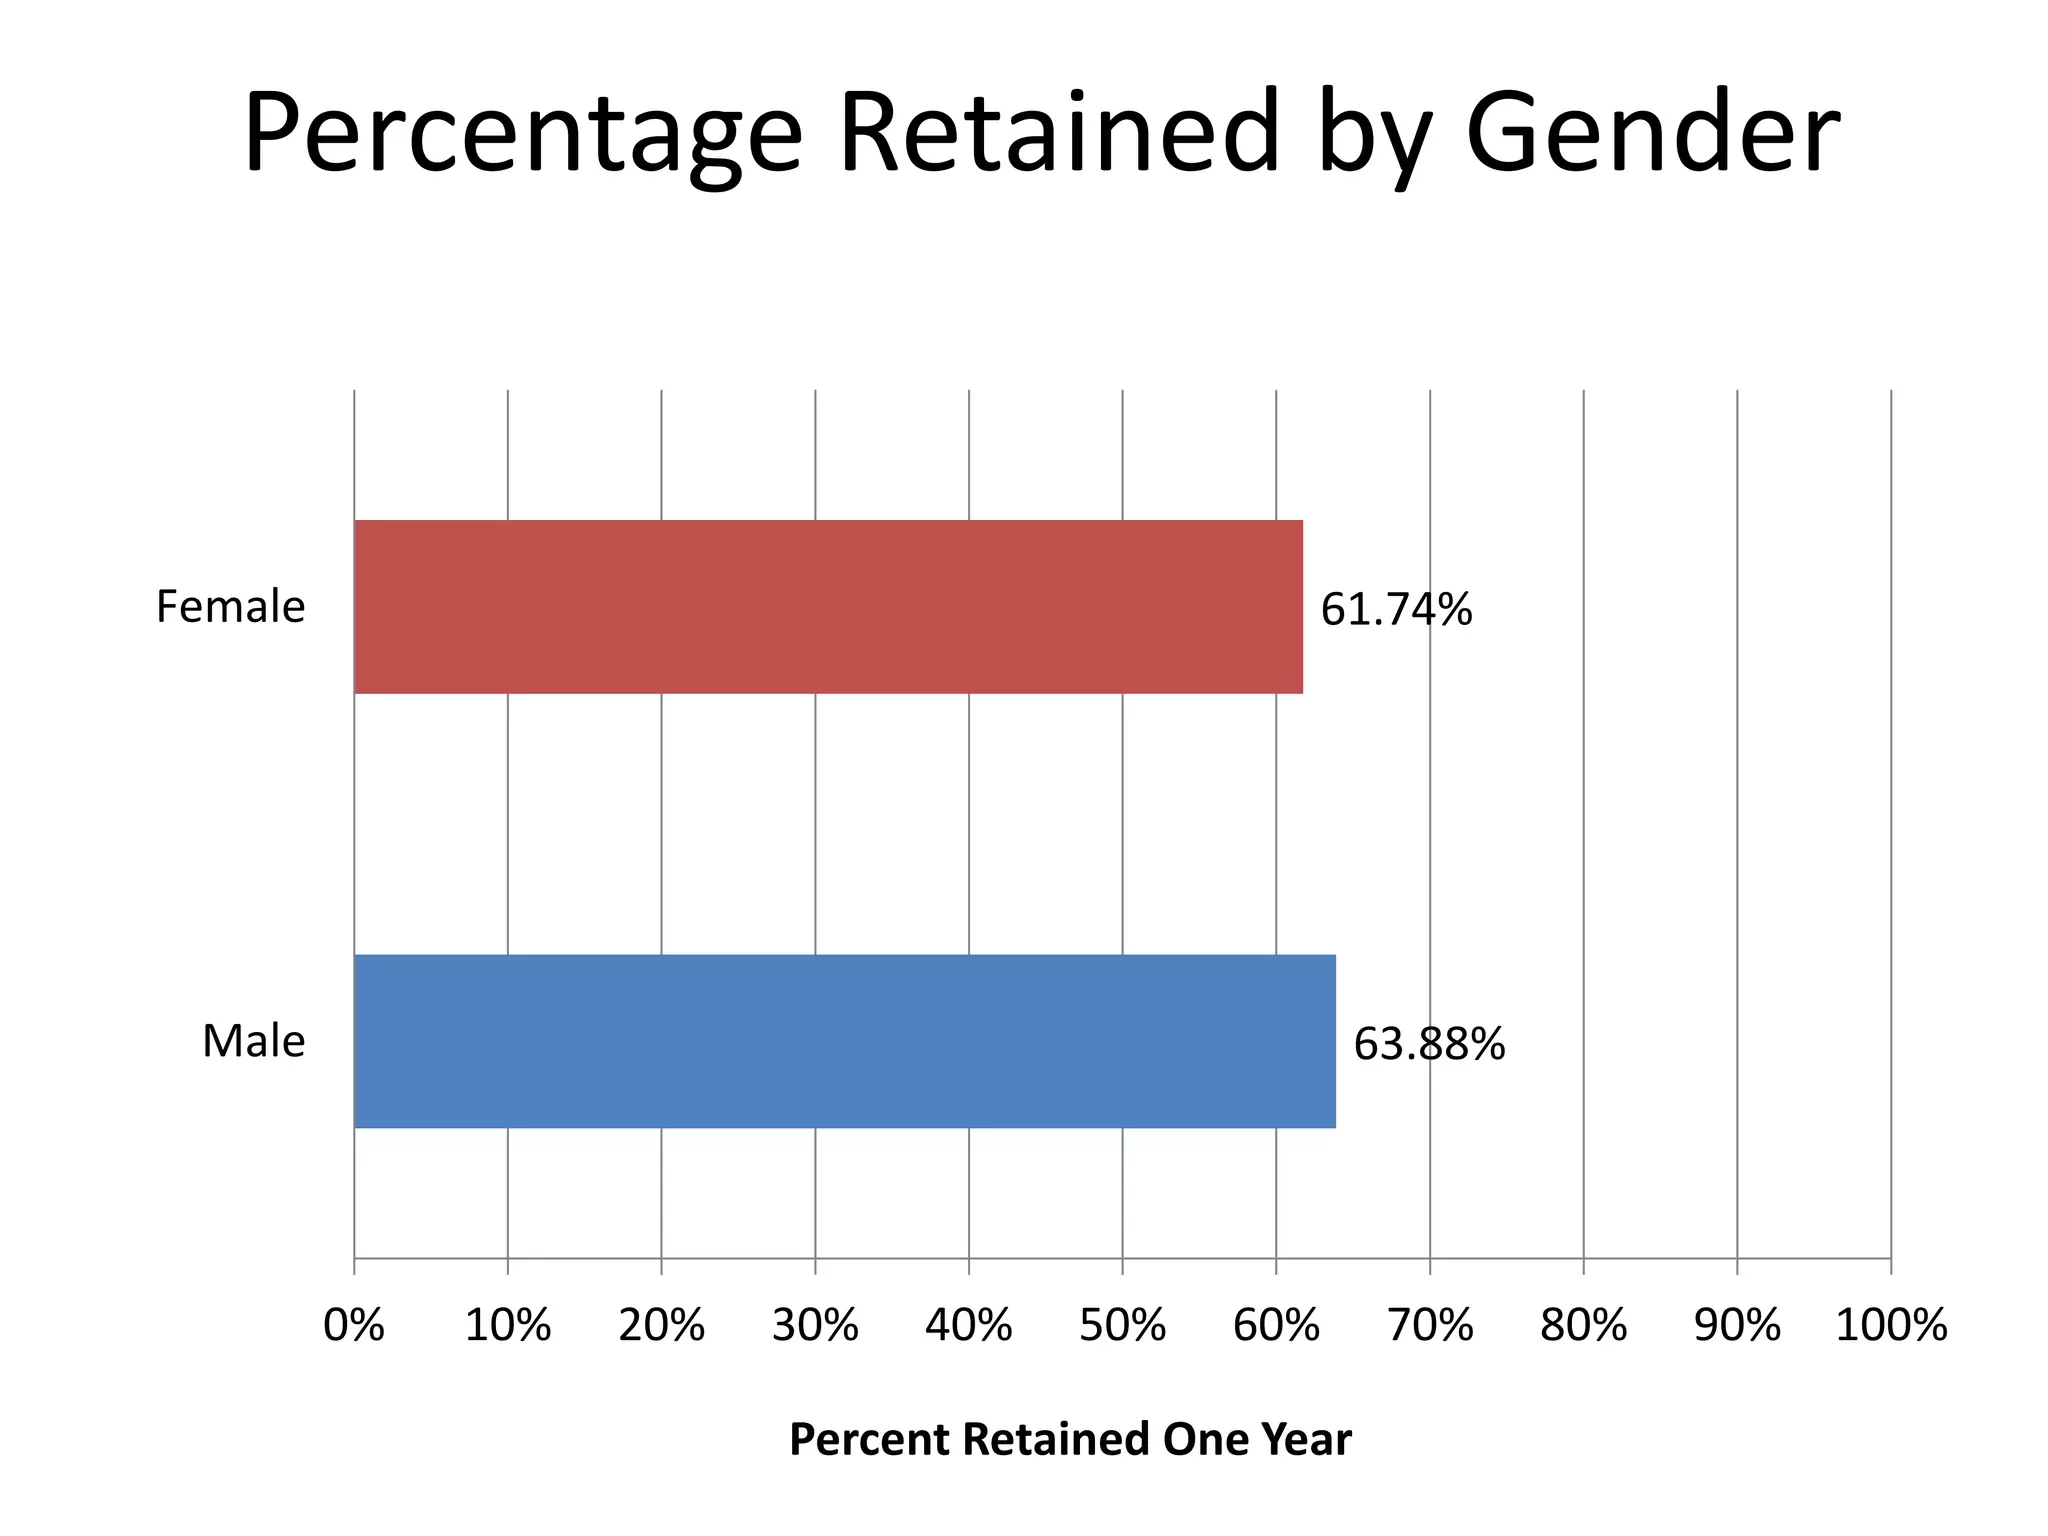
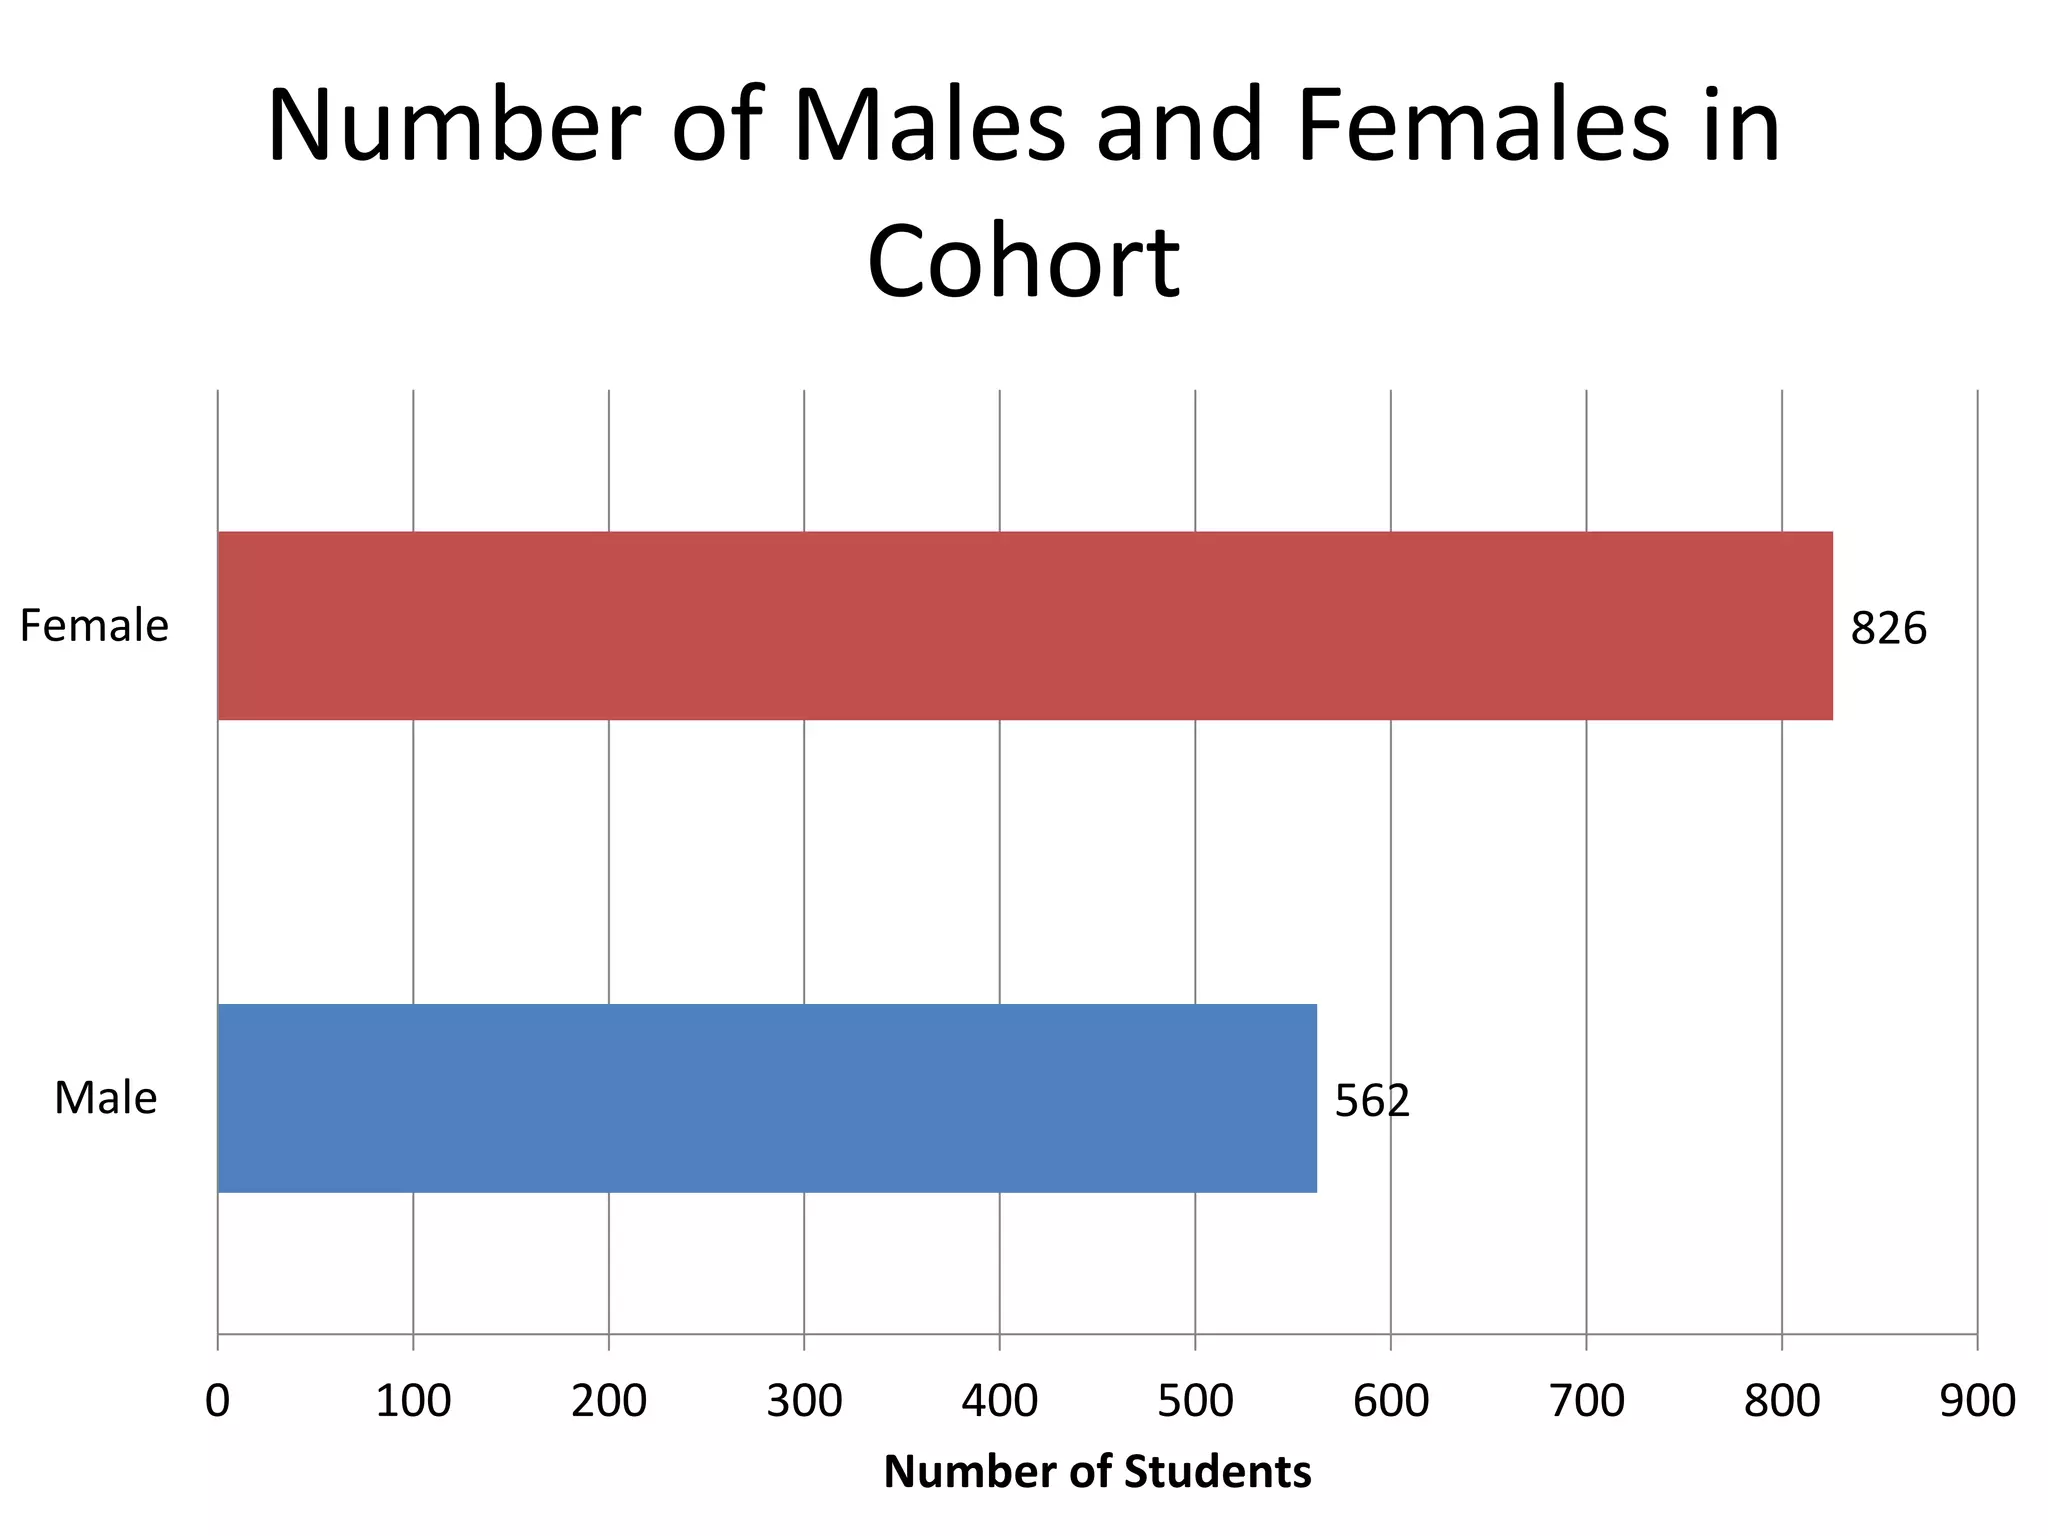
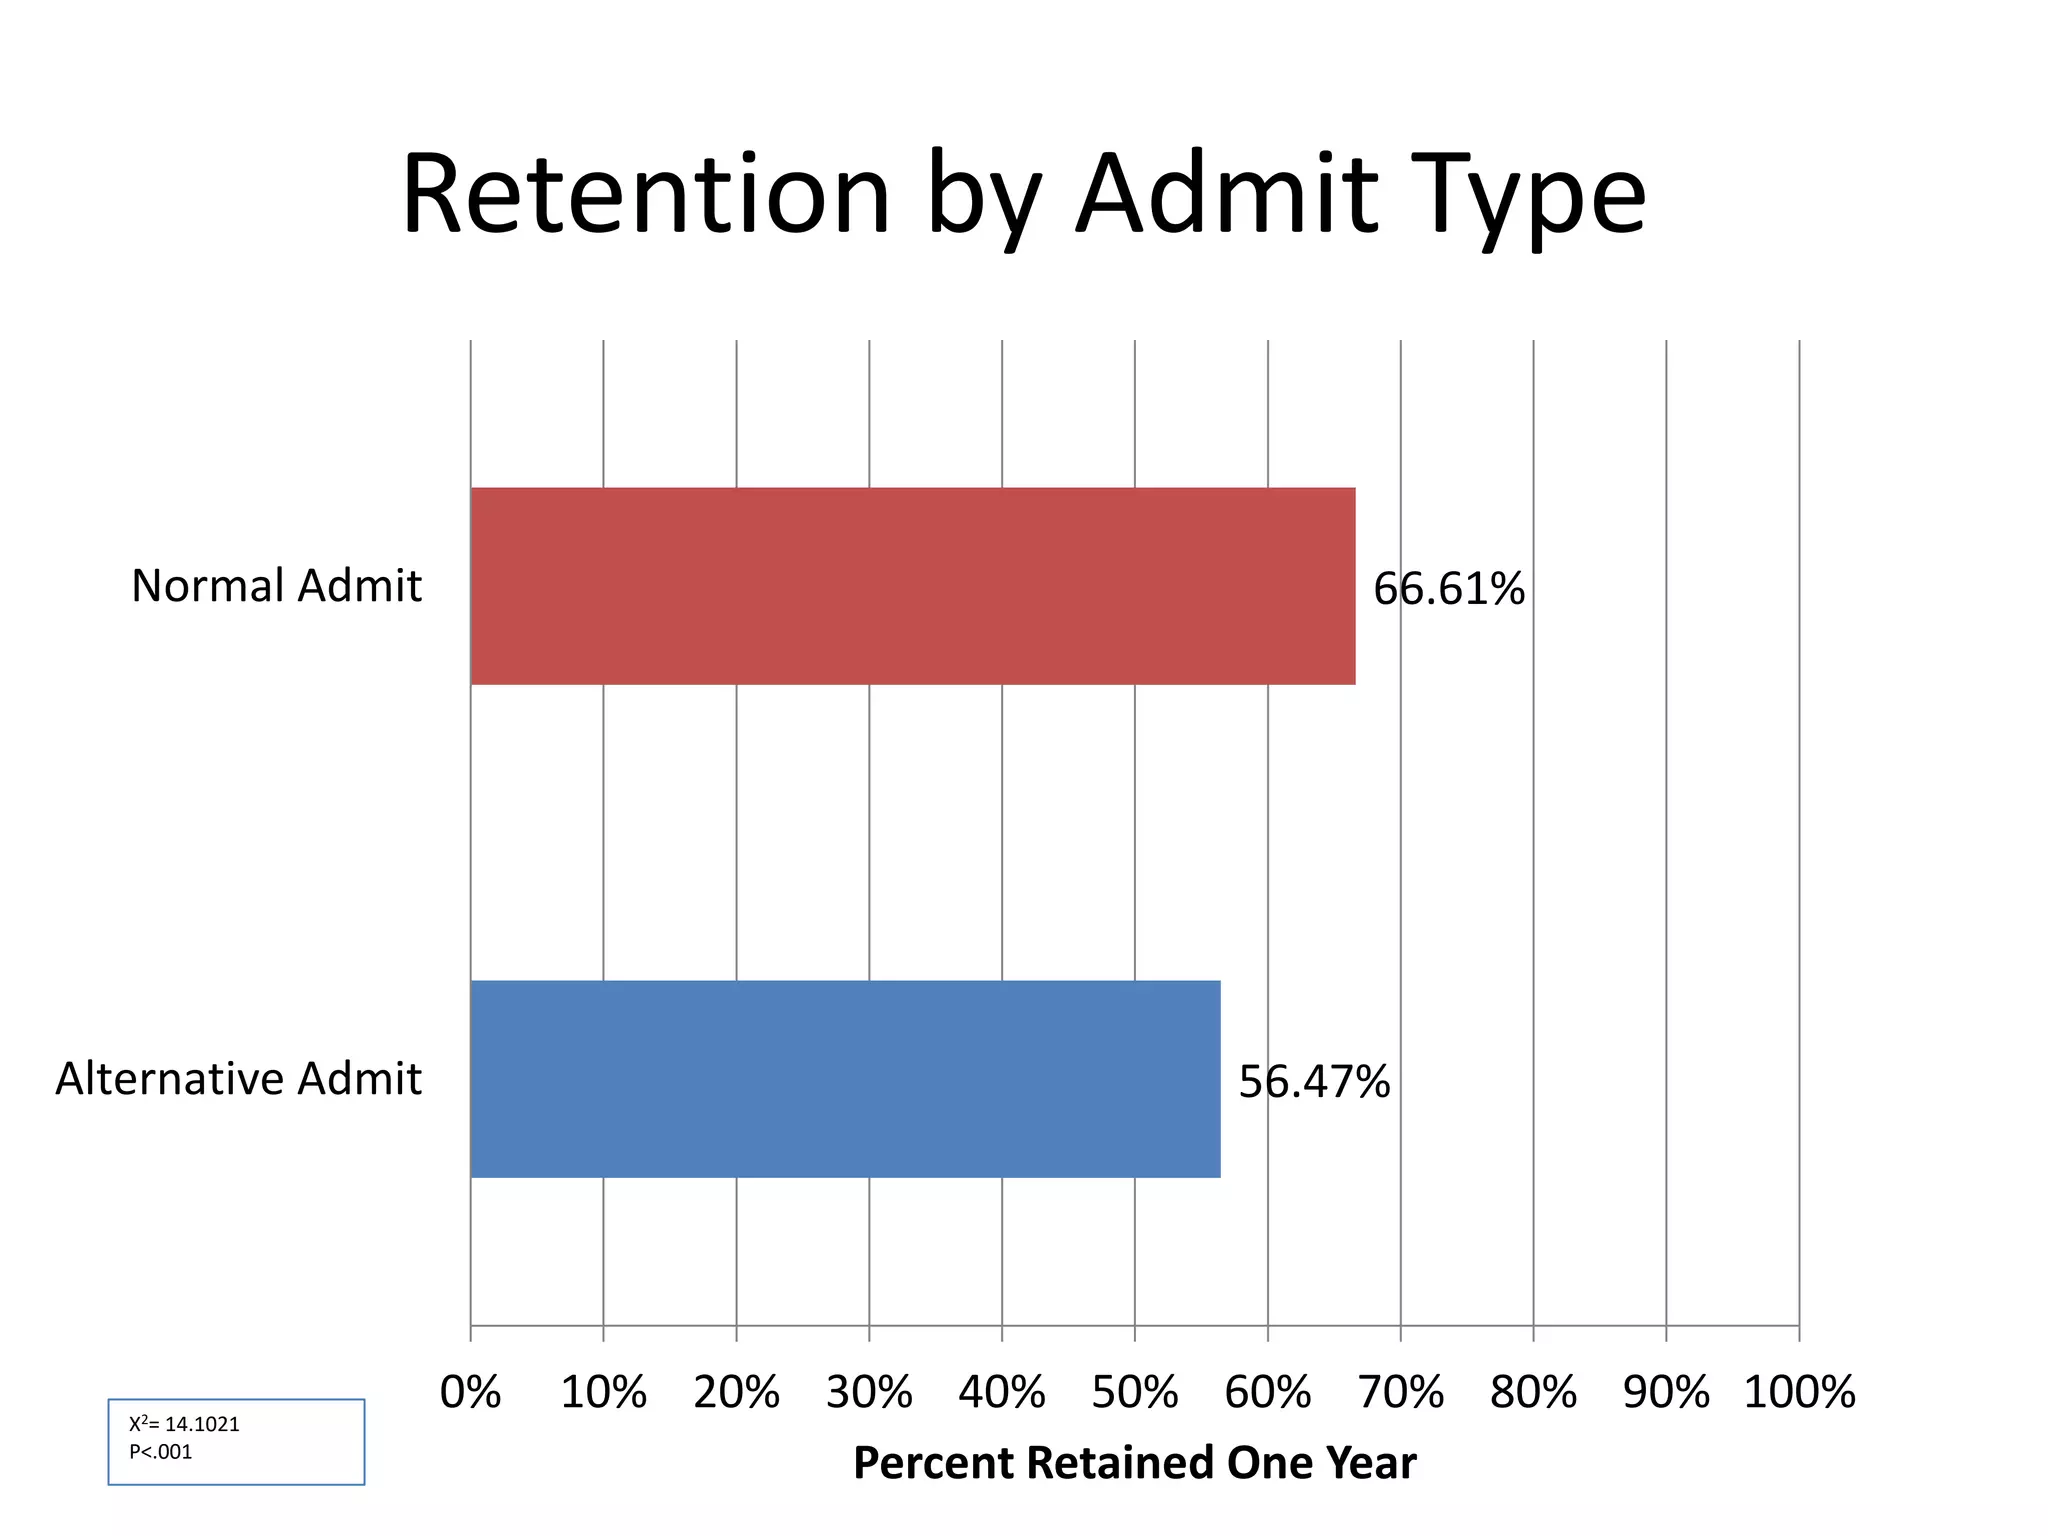
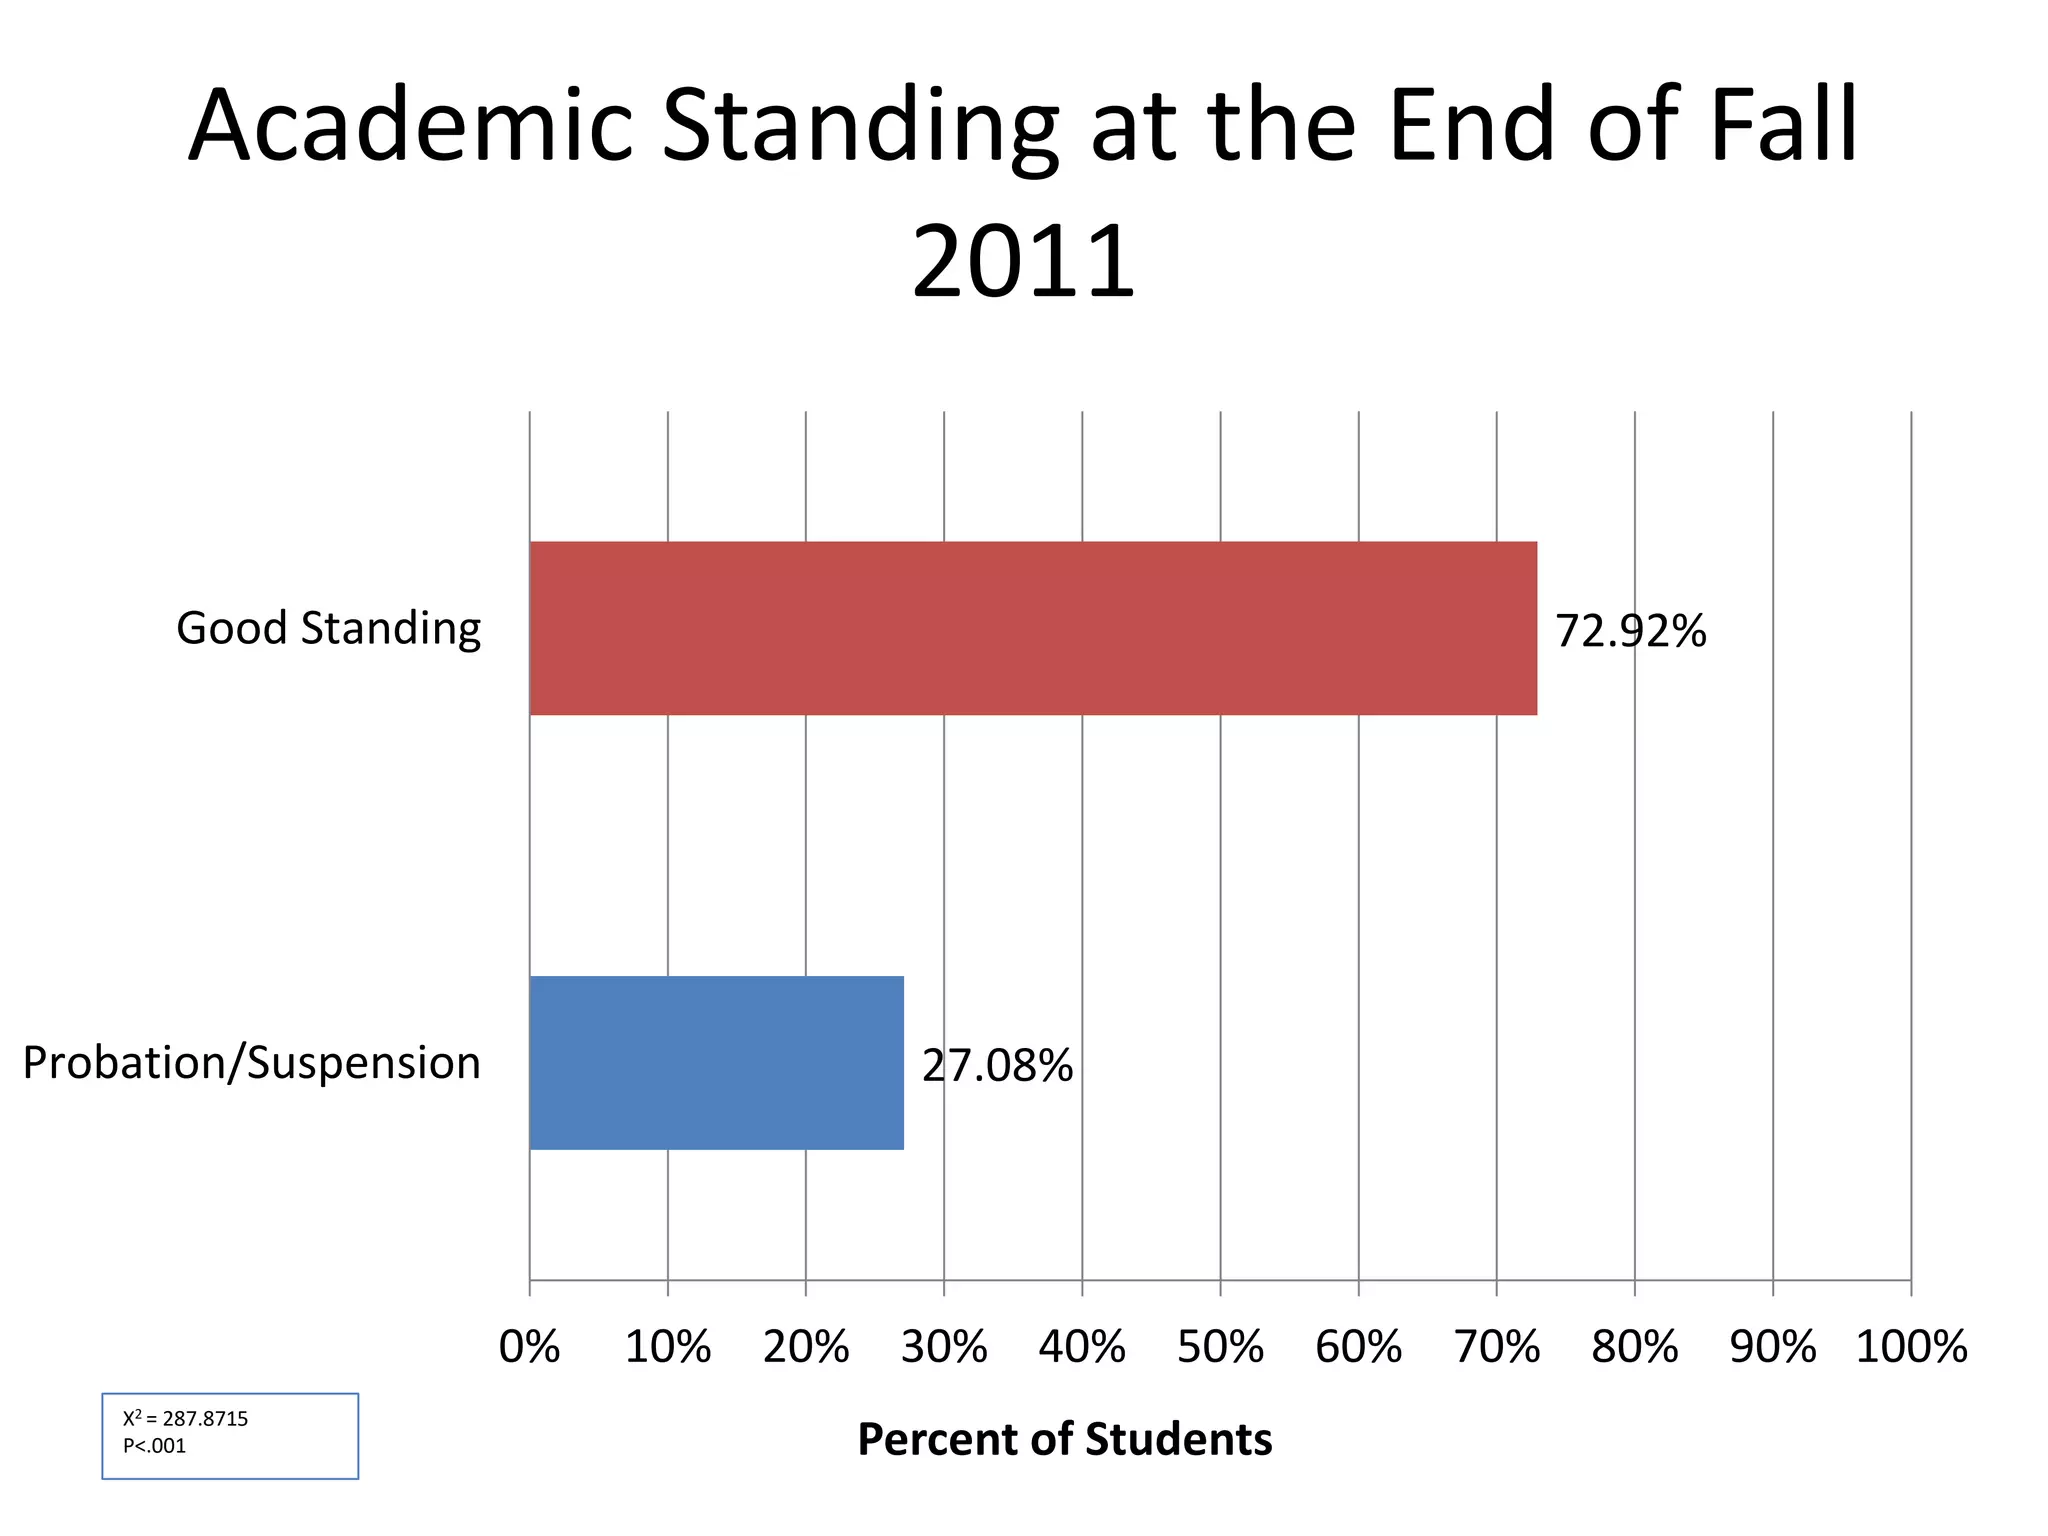
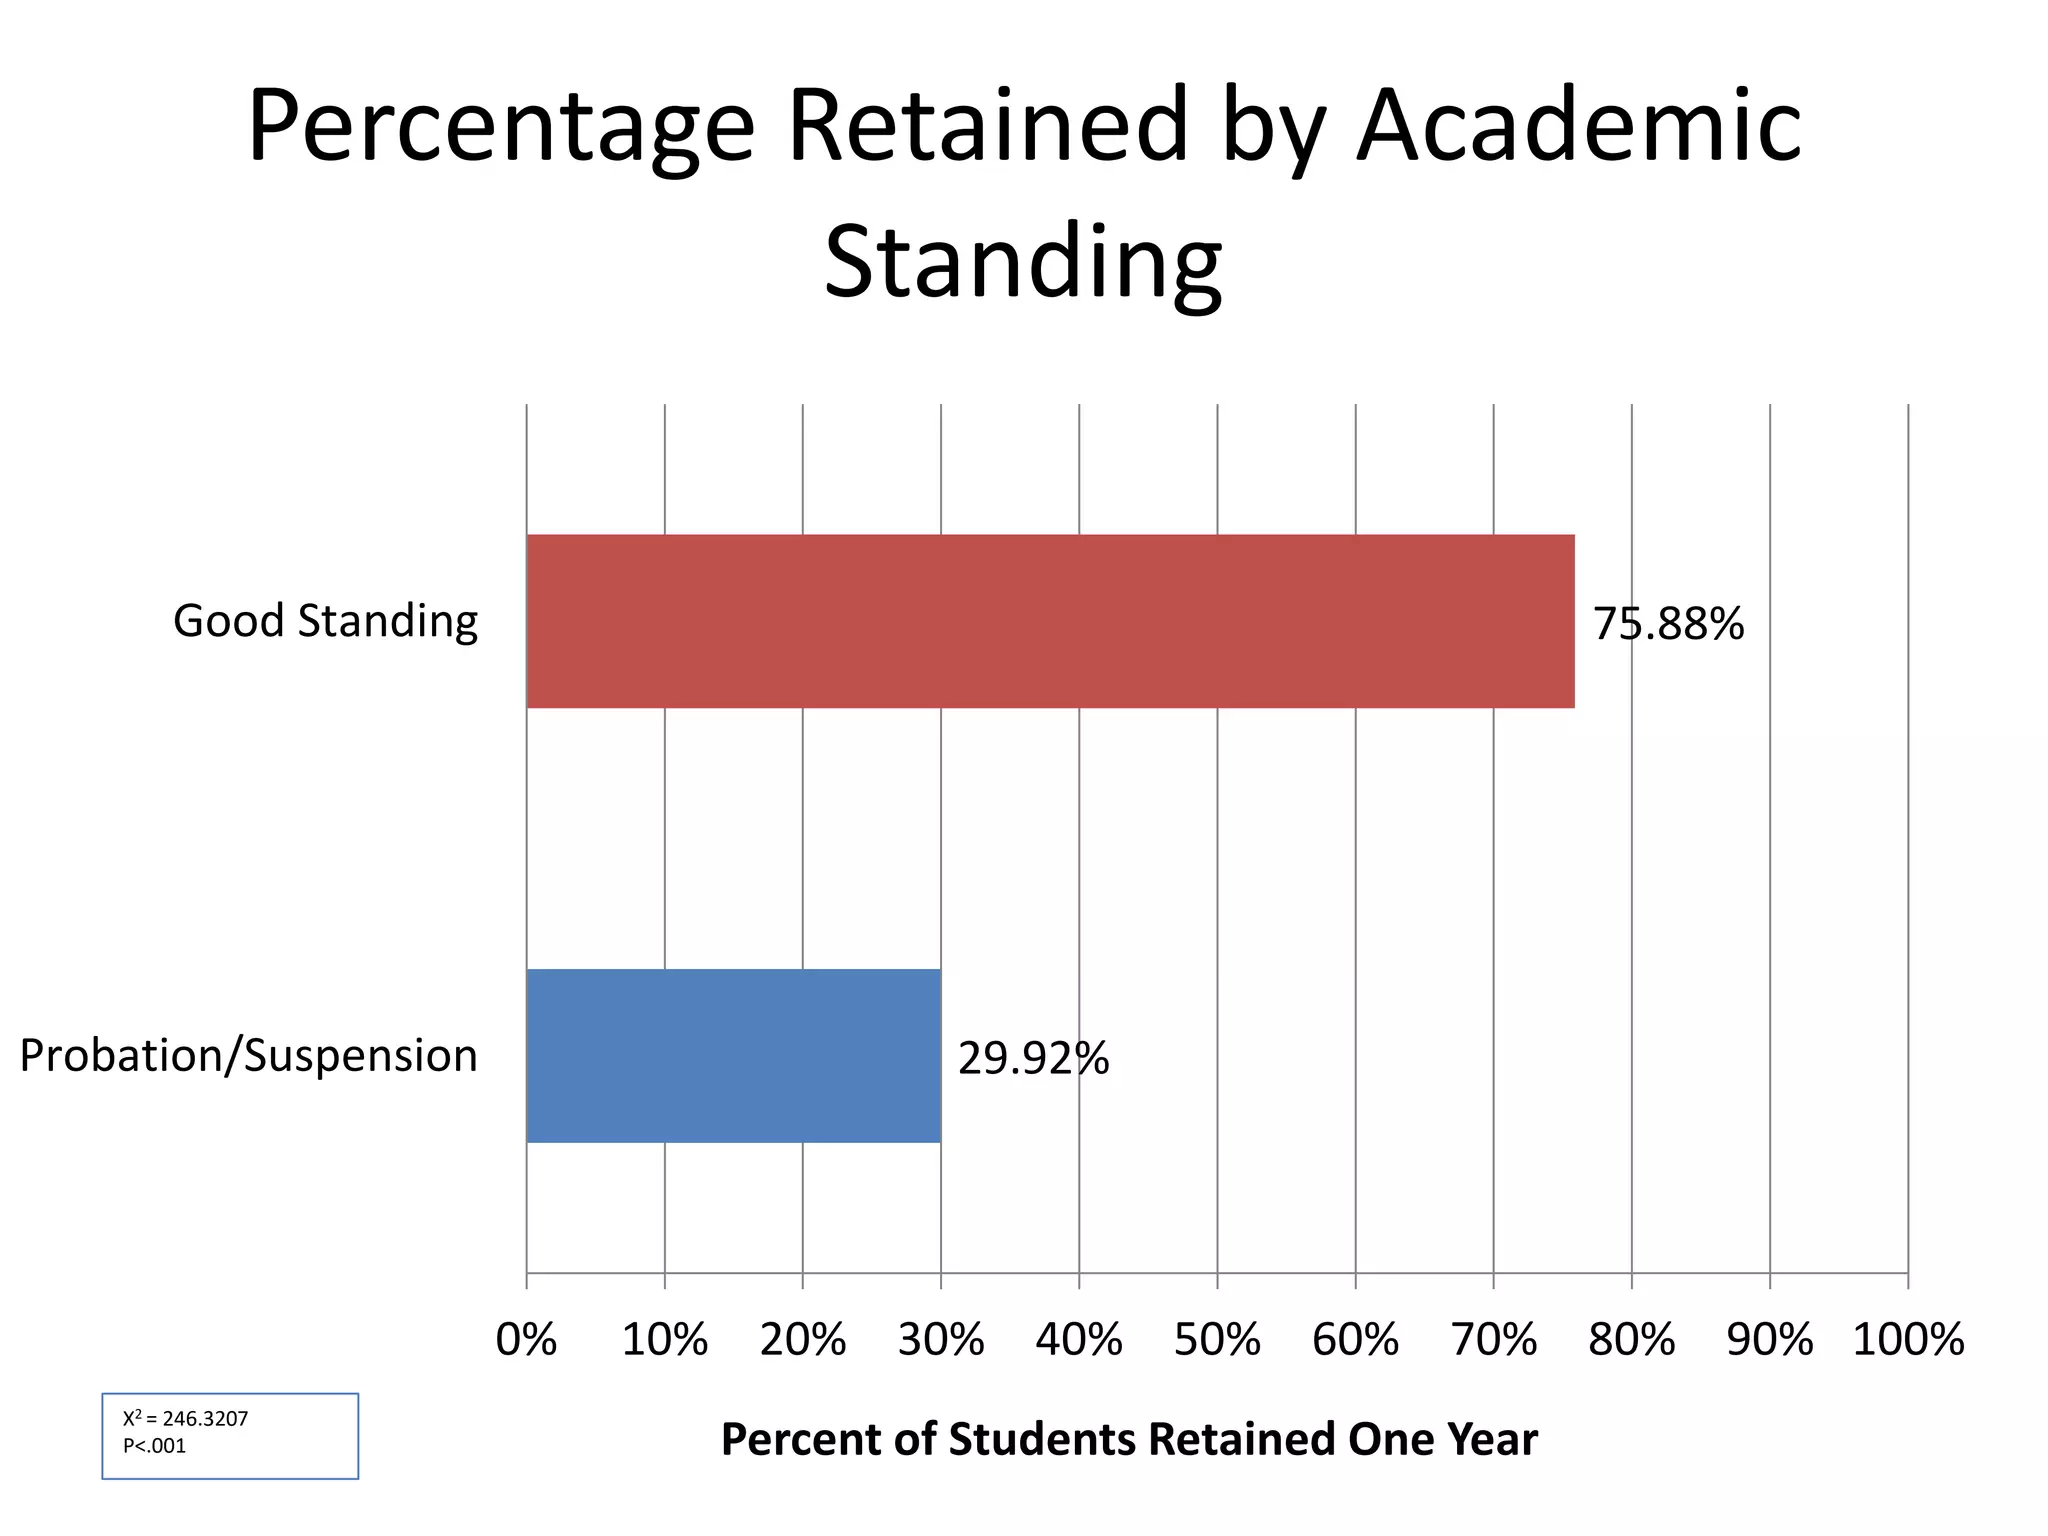
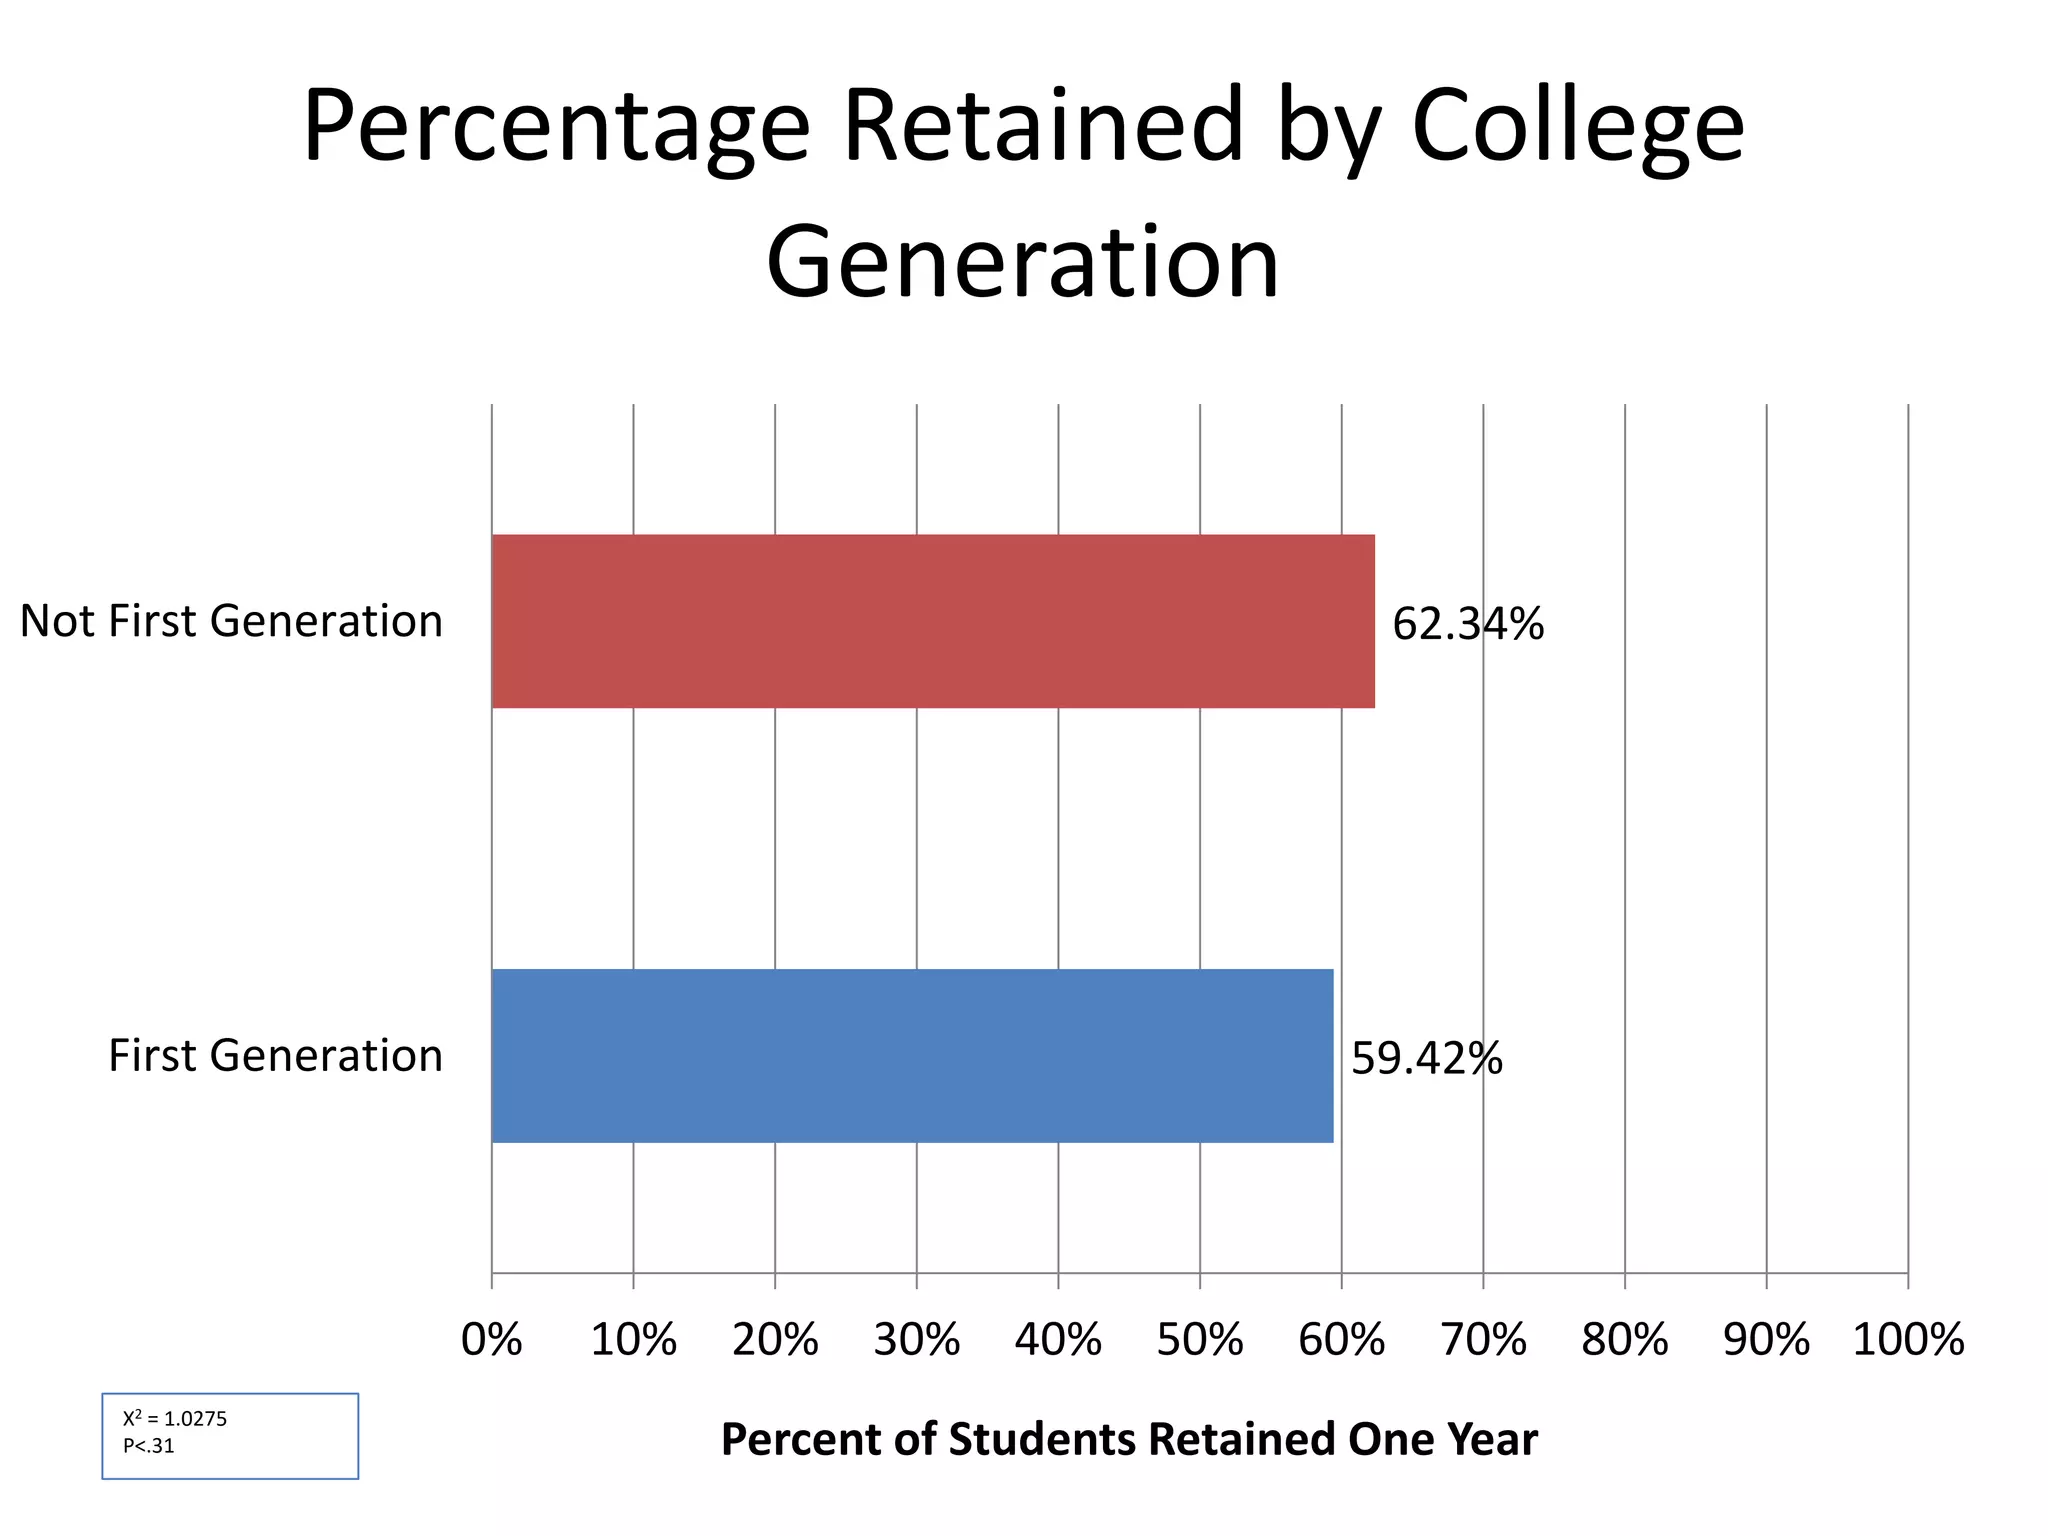
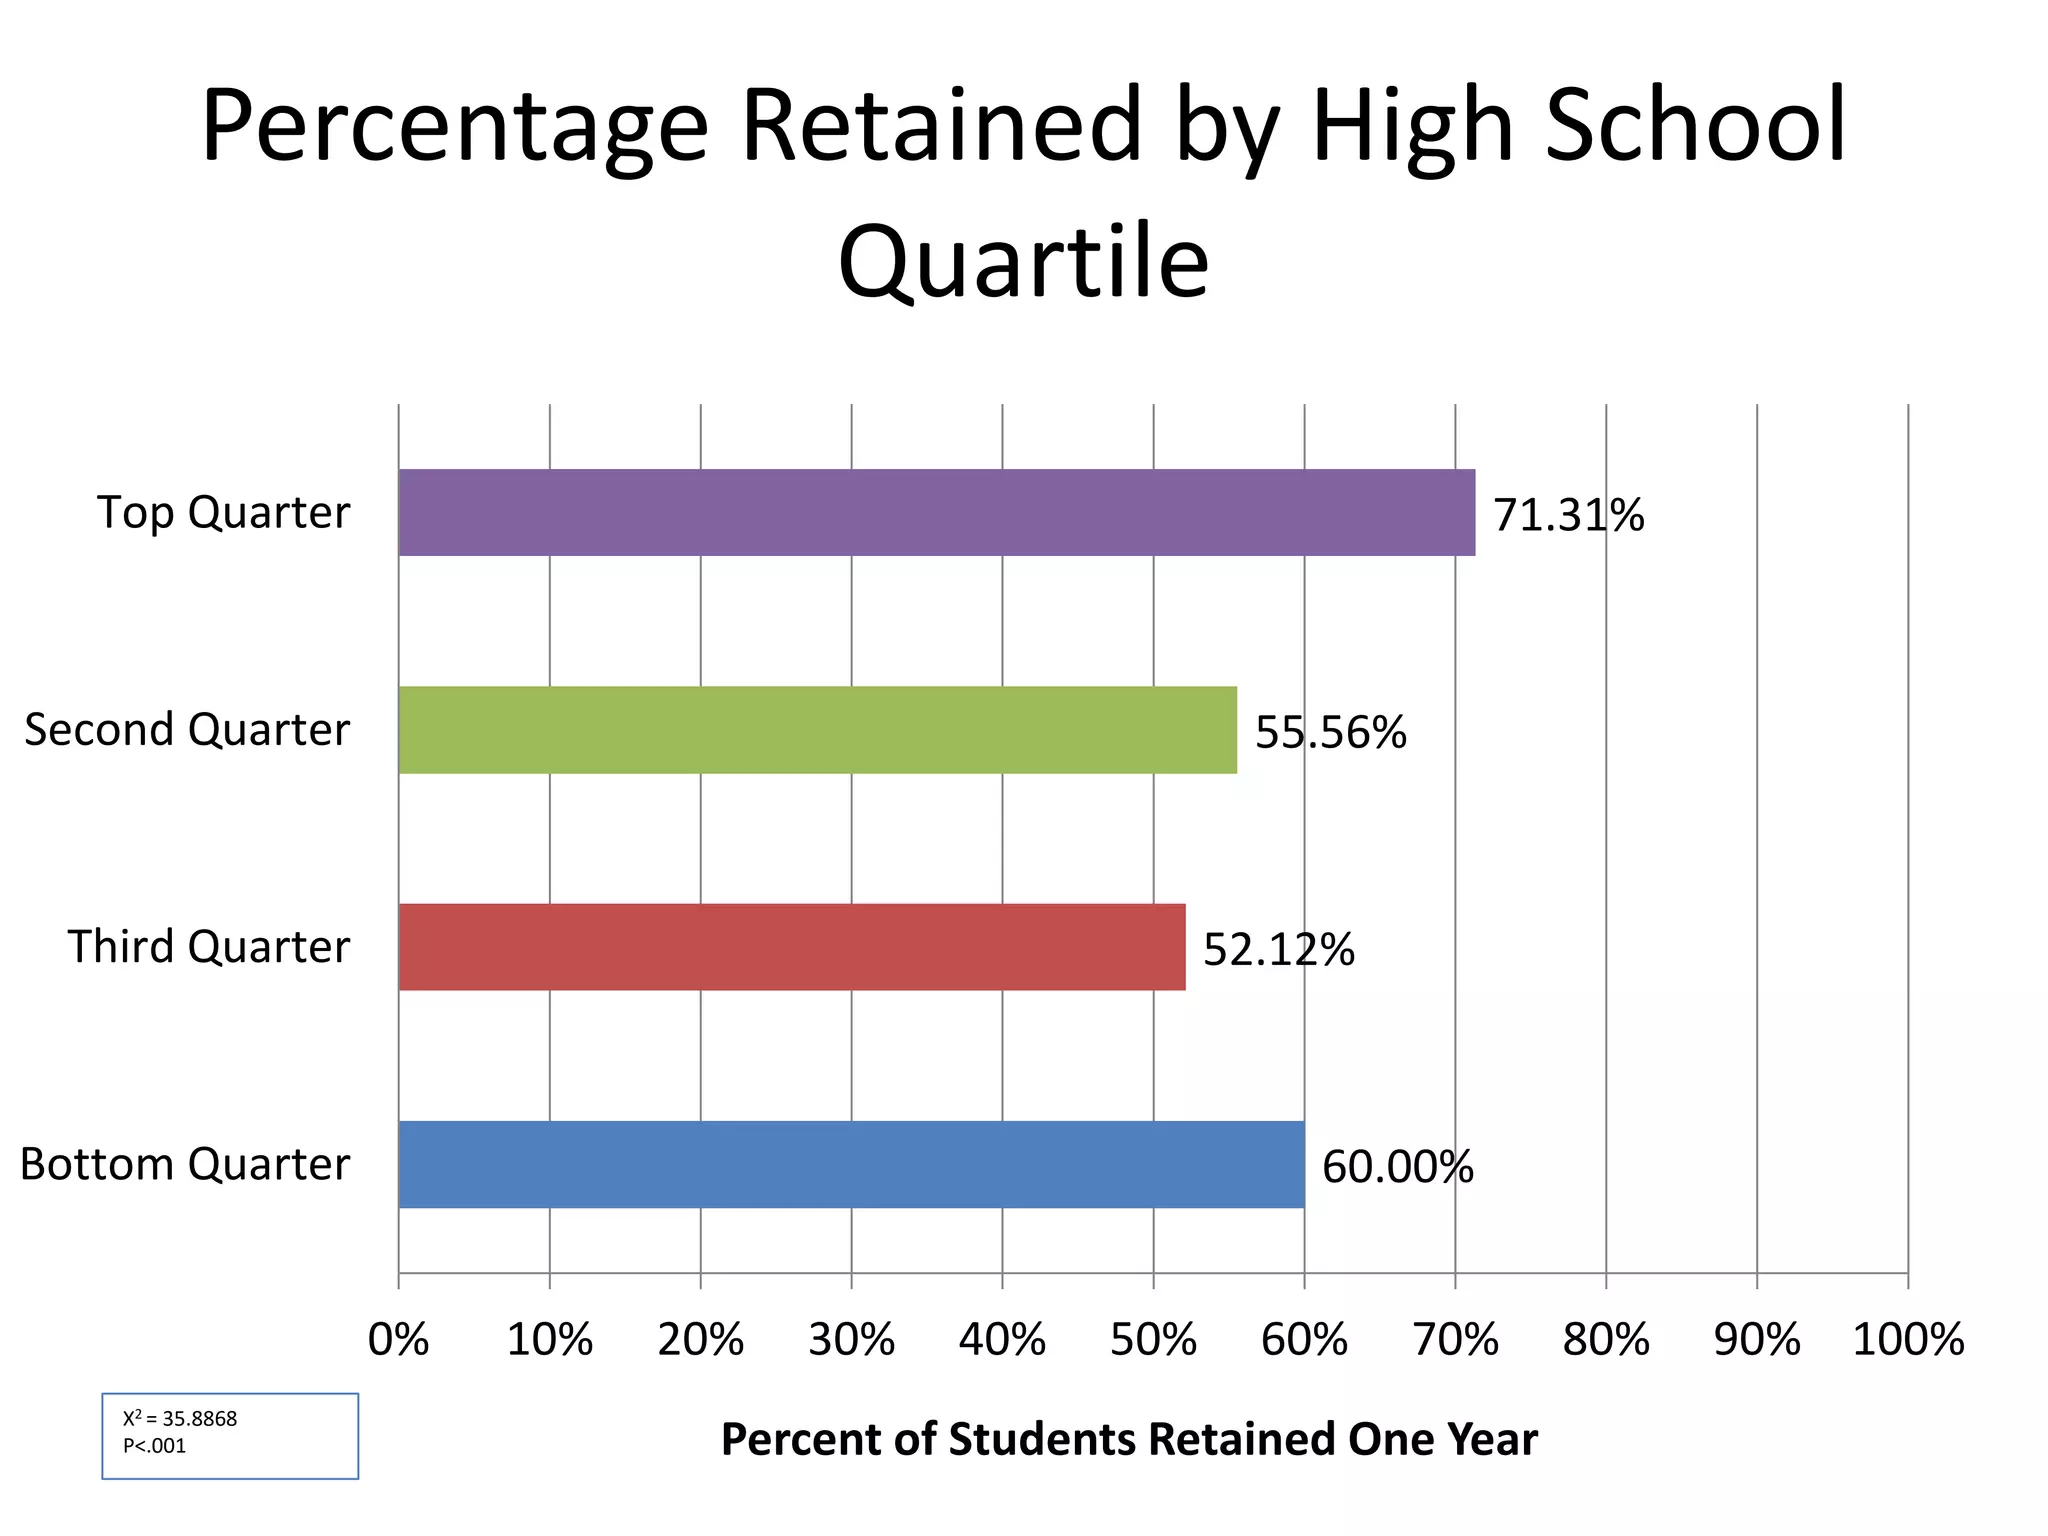
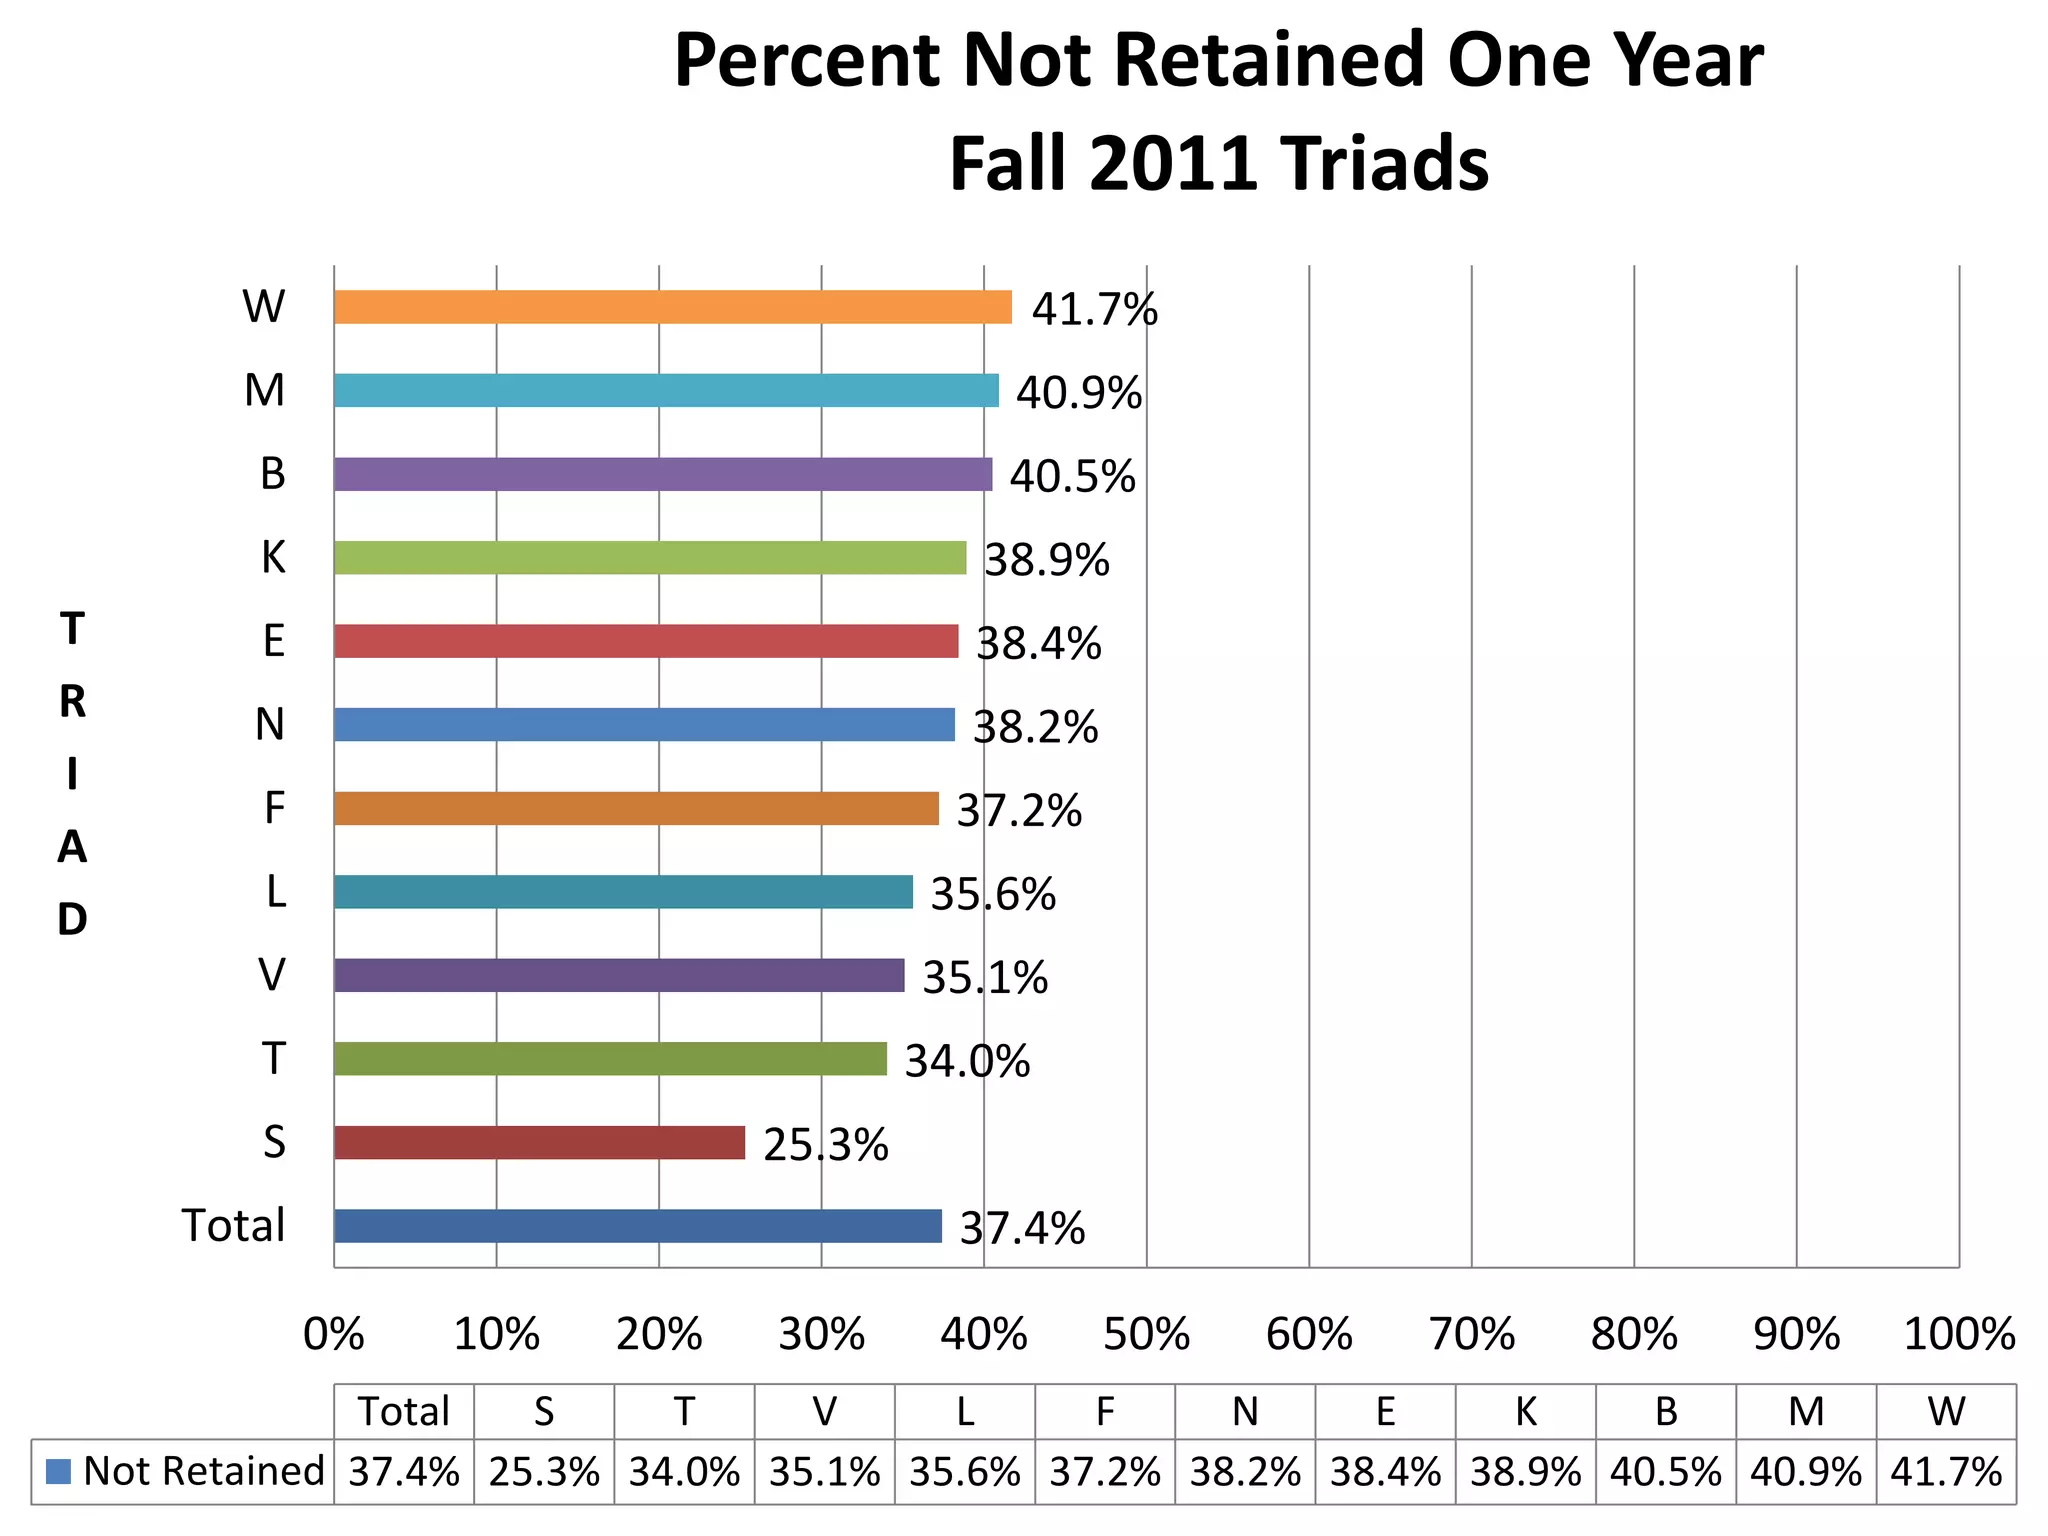
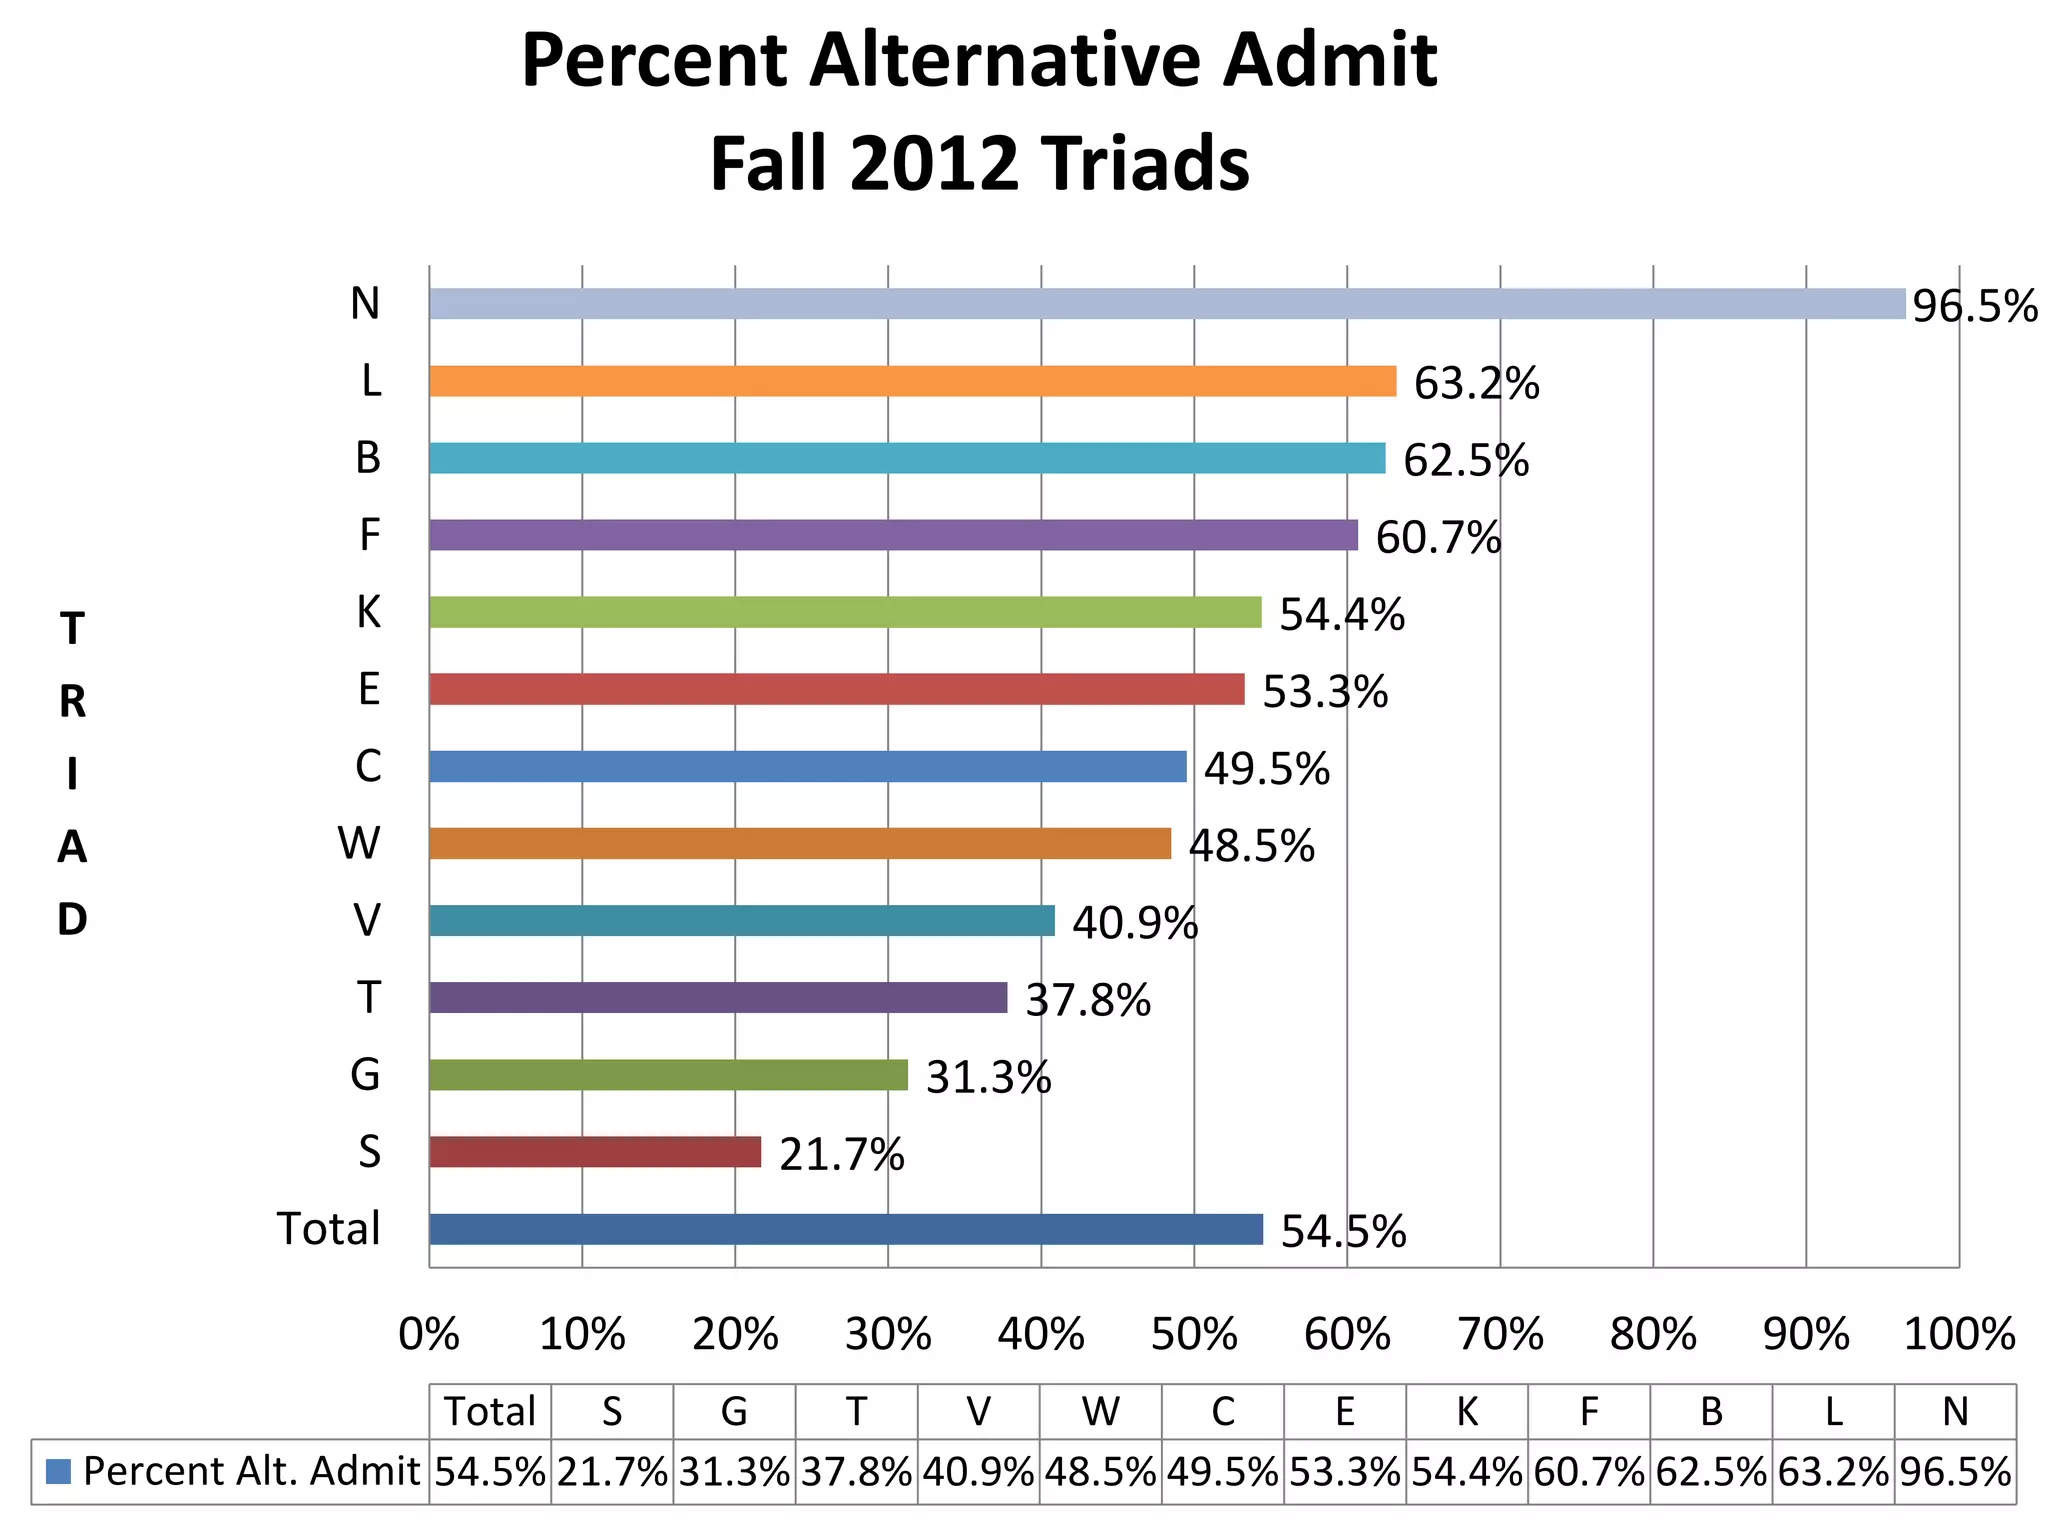
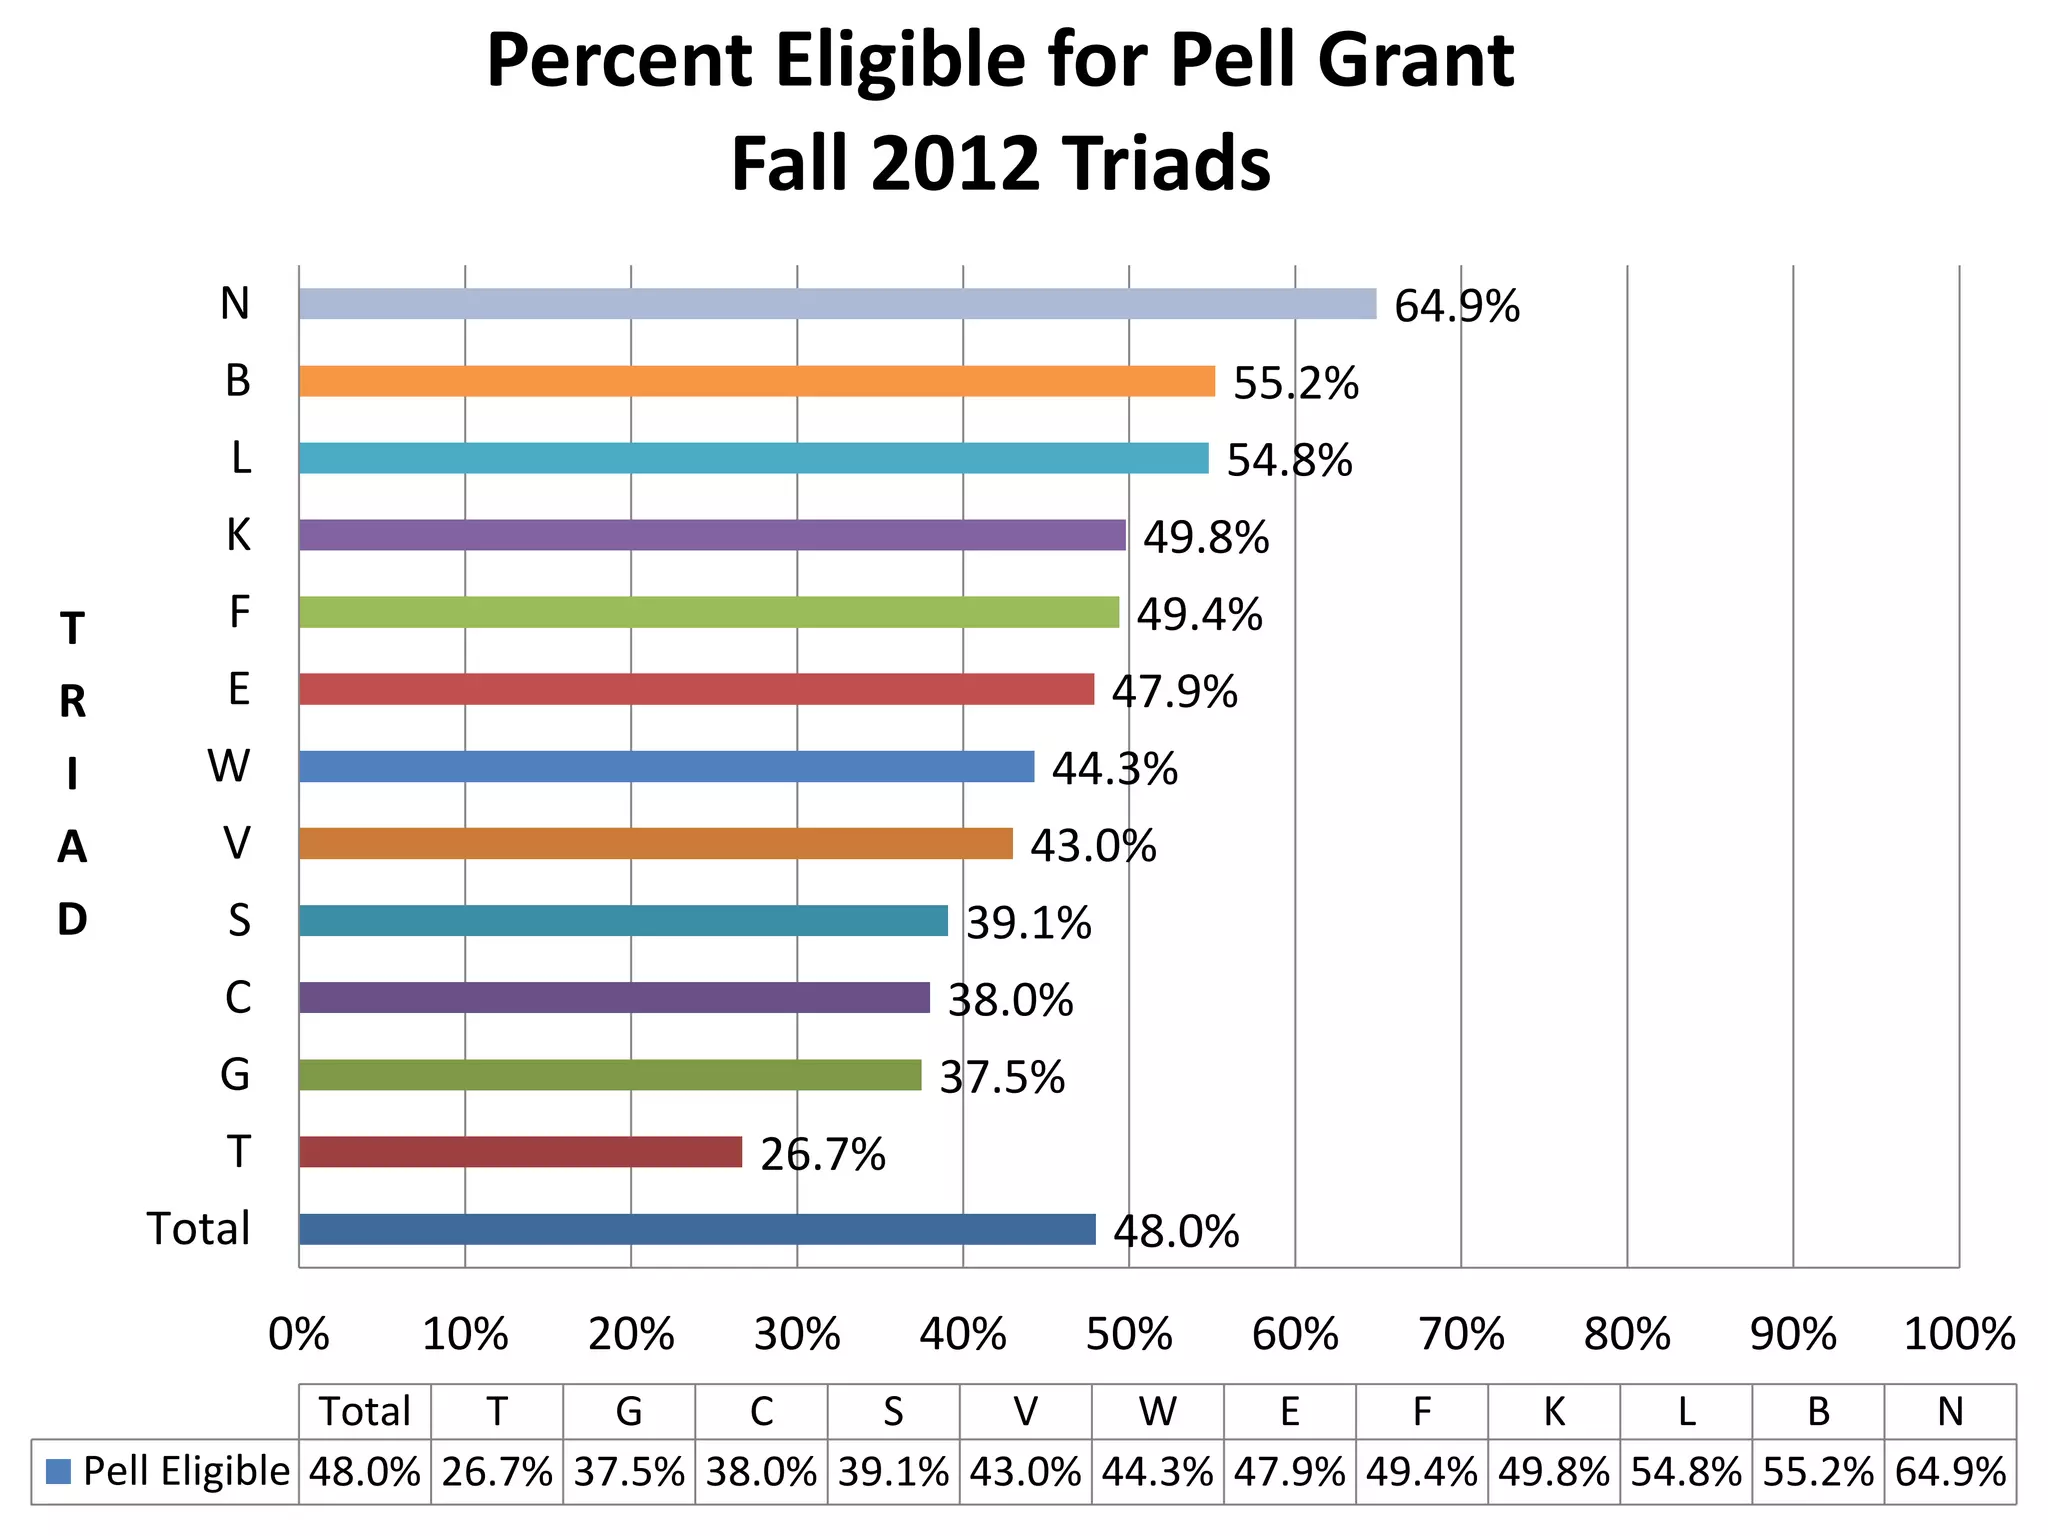
Understanding Student
Retention with Data
Building Better Data Resources
FTIC - One Year Persistence Rate
57% 60% 61% 61% 64%
60% 63%
43% 40% 39% 39% 36%
40% 37%
0%
10%
20%
30%
40%
50%
60%
70%
80%
90%
100%
Fall
2005 to
Fall
2006
Fall
2006 to
Fall
2007
Fall
2007 to
Fall
2008
Fall
2008 to
Fall
2009
Fall
2009 to
Fall
2010
Fall
2010 to
Fall
2011
Fall
2010 to
Fall
2011
Persist
Did not Persist
FALL 2011 COHORT
First Things
• We are using a Learning Community Cohort.
• We are not using the THECB first time in college
cohort.
• Why?
– THECB Cohort is artificial where the Learning
Community Cohort is not
– Learning Community cohort is easier to understand.
– Learning Communities is where the “rubber meets the
work” in retention.
– However, the Learning Community and THECB cohort
is a close match.
Percentage Retained by Gender
63.88%
61.74%
0% 10% 20% 30% 40% 50% 60% 70% 80% 90% 100%
Male
Female
Percent Retained One Year
Number of Males and Females in
Cohort
562
826
0 100 200 300 400 500 600 700 800 900
Male
Female
Number of Students
Colleges by Gender
5.05%
9.36%
13.05%
19.83%
24.38%
28.33%
9.87%
18.67%
10.05%
15.62%
36.80%
8.98%
0% 10% 20% 30% 40% 50%
Undeclared
Business
Education
Liberal Arts
Science &
Engineering
Nursing & Health
Sciences
Male
Female
Χ2= 116.2821
P < .001
Average Total SAT Score by Gender
1398.54
1424.48
600 800 1000 1200 1400 1600 1800 2000 2200 2400
Female
Male
Average Total ScoreIncludes converted
ACT scores.
Colleges by SAT Score
1,435.50
1,385.87
1,369.13
1,405.94
1,435.95
1,369.08
1,405.00
1,380.20
1,362.32
1,441.51
1,480.49
1,361.22
600 1,200 1,800 2,400
Undeclared
Business
Education
Liberal Arts
Science &
Engineering
Nursing & Health
Sciences
Male
Female
ScoreIncludes converted
ACT scores.
Retention by Admit Type
56.47%
66.61%
0% 10% 20% 30% 40% 50% 60% 70% 80% 90% 100%
Alternative Admit
Normal Admit
Percent Retained One Year
Χ2= 14.1021
P<.001
Percentage Retained by Pell Eligibility
58.07%
67.15%
0% 10% 20% 30% 40% 50% 60% 70% 80% 90% 100%
Pell Eligible
Not Pell Eligible
Percent Retained One Year
Χ2 = 12.2147
P<.001
Academic Standing at the End of Fall
2011
27.08%
72.92%
0% 10% 20% 30% 40% 50% 60% 70% 80% 90% 100%
Probation/Suspension
Good Standing
Percent of Students
Χ2 = 287.8715
P<.001
Percentage Retained by Academic
Standing
29.92%
75.88%
0% 10% 20% 30% 40% 50% 60% 70% 80% 90% 100%
Probation/Suspension
Good Standing
Percent of Students Retained One Year
Χ2 = 246.3207
P<.001
Percentage Retained by College
Generation
59.42%
62.34%
0% 10% 20% 30% 40% 50% 60% 70% 80% 90% 100%
First Generation
Not First Generation
Percent of Students Retained One Year
Χ2 = 1.0275
P<.31
Percentage Retained by High School
Quartile
60.00%
52.12%
55.56%
71.31%
0% 10% 20% 30% 40% 50% 60% 70% 80% 90% 100%
Bottom Quarter
Third Quarter
Second Quarter
Top Quarter
Percent of Students Retained One Year
Χ2 = 35.8868
P<.001
54.1%
31.5%
46.8%
50.0%
54.8%
57.1%
58.5%
60.5%
61.2%
64.6%
68.8%
0% 10% 20% 30% 40% 50% 60% 70% 80% 90% 100%
Total
N
M
T
F
V
B
E
K
L
W
T
R
I
A
D
Total N M T F V B E K L W
Failed 54.1% 31.5% 46.8% 50.0% 54.8% 57.1% 58.5% 60.5% 61.2% 64.6% 68.8%
Percent of Students who received either D,F, or W in a
Developmental Education Course
Fall 2011 Triads (Student in DE)
25.3%
0.0%
7.4%
8.5%
16.7%
22.0%
22.6%
24.4%
25.5%
30.2%
42.7%
98.2%
0% 10% 20% 30% 40% 50% 60% 70% 80% 90% 100%
Total
S
V
T
W
F
E
B
L
K
M
N
T
R
I
A
D
Total S V T W F E B L K M N
Enrolled in DE 25.3% 0.0% 7.4% 8.5% 16.7% 22.0% 22.6% 24.4% 25.5% 30.2% 42.7% 98.2%
Percent Enrolled in Developmental Education
Fall 2011 Triads
37.4%
25.3%
34.0%
35.1%
35.6%
37.2%
38.2%
38.4%
38.9%
40.5%
40.9%
41.7%
0% 10% 20% 30% 40% 50% 60% 70% 80% 90% 100%
Total
S
T
V
L
F
N
E
K
B
M
W
T
R
I
A
D
Total S T V L F N E K B M W
Not Retained 37.4% 25.3% 34.0% 35.1% 35.6% 37.2% 38.2% 38.4% 38.9% 40.5% 40.9% 41.7%
Percent Not Retained One Year
Fall 2011 Triads
RISK FACTORS BY TRIAD
FALL 2012
Not all Triads are created equal
54.5%
21.7%
31.3%
37.8%
40.9%
48.5%
49.5%
53.3%
54.4%
60.7%
62.5%
63.2%
96.5%
0% 10% 20% 30% 40% 50% 60% 70% 80% 90% 100%
Total
S
G
T
V
W
C
E
K
F
B
L
N
T
R
I
A
D
Total S G T V W C E K F B L N
Percent Alt. Admit 54.5% 21.7% 31.3% 37.8% 40.9% 48.5% 49.5% 53.3% 54.4% 60.7% 62.5% 63.2% 96.5%
Percent Alternative Admit
Fall 2012 Triads
48.0%
26.7%
37.5%
38.0%
39.1%
43.0%
44.3%
47.9%
49.4%
49.8%
54.8%
55.2%
64.9%
0% 10% 20% 30% 40% 50% 60% 70% 80% 90% 100%
Total
T
G
C
S
V
W
E
F
K
L
B
N
T
R
I
A
D
Total T G C S V W E F K L B N
Pell Eligible 48.0% 26.7% 37.5% 38.0% 39.1% 43.0% 44.3% 47.9% 49.4% 49.8% 54.8% 55.2% 64.9%
Percent Eligible for Pell Grant
Fall 2012 Triads
39.5%
23.9%
28.9%
31.3%
33.0%
34.4%
35.1%
38.3%
39.7%
42.1%
43.7%
46.9%
47.4%
0% 10% 20% 30% 40% 50% 60% 70% 80% 90% 100%
Total
S
T
G
W
V
K
E
C
N
F
L
B
T
R
I
A
D
Total S T G W V K E C N F L B
First Generation 39.5% 23.9% 28.9% 31.3% 33.0% 34.4% 35.1% 38.3% 39.7% 42.1% 43.7% 46.9% 47.4%
Percent First Generation
Fall 2012 Triads
23.7%
6.5%
15.4%
18.3%
21.8%
21.9%
24.0%
24.5%
26.1%
26.3%
26.6%
28.0%
40.4%
0% 10% 20% 30% 40% 50%
Total
S
W
V
K
G
E
C
B
F
T
L
N
T
R
I
A
D
Total S W V K G E C B F T L N
Bottom Half 23.7% 6.5% 15.4%18.3%21.8%21.9%24.0%24.5%26.1%26.3%26.6%28.0%40.4%
Percent Ranked in Bottom Half of High School
Fall 2012 Triads
493
394
481
482
482
488
489
499
505
519
522
536
561
200 300 400 500 600 700 800
Total
N
B
F
L
K
W
E
C
G
V
S
T
T
R
I
A
D
Total N B F L K W E C G V S T
Avg. SAT Math 493 394 481 482 482 488 489 499 505 519 522 536 561
Average SAT Math
Fall 2012 Triads
1,427
1,188
1,378
1,399
1,402
1,420
1,432
1,453
1,461
1,508
1,511
1,539
1,561
600 800 1,000 1,200 1,400 1,600 1,800 2,000 2,200 2,400
Total
N
L
B
F
K
E
C
W
V
G
T
S
T
R
I
A
D
Total N L B F K E C W V G T S
Avg. Total Score 1,427 1,188 1,378 1,399 1,402 1,420 1,432 1,453 1,461 1,508 1,511 1,539 1,561
Average Total SAT Score
Fall 2012 Triads
20
16
19
19
20
20
20
21
21
21
21
22
23
1 6 11 16 21 26 31 36
Total
N
F
L
B
C
K
E
T
V
W
G
S
T
R
I
A
D
Total N F L B C K E T V W G S
Avg. Act Composite 20 16 19 19 20 20 20 21 21 21 21 22 23
Average ACT Composite
Fall 2012 Triads
57.45%
59.32%
64.60%
66.15%
69.88%
70.50%
72.05%
72.98%
73.29%
74.84%
0% 10% 20% 30% 40% 50% 60% 70% 80% 90% 100%
Motivation
Information Processing
Self Testing**
Anxiety
Test Strategies**
Concentration
Time Management**
Study Aids**
Attitude
Selecting Main Ideas**
L
a
s
s
i
S
c
a
l
e
s
Percentage of TAMU-CC Students that Did
Not Meet Expectations of LASSI Creators*
*Percentage of TAMU-CC Students
Worse than 50-55% Percent of
Those in the Normed Sample Fall
2012
**Bottom 55th Percentile
Coming Soon
• This presentation in the tip of the iceberg
• Beginning College Survey of Student
Engagement – Data Push
• New Course Evaluation Pilot
• Predictive Models of Student Success using
data from multiple time points
• Focus Groups
• New survey instruments

First Learning Community Presentation Final 10-23-2012

  • 1.
    Understanding Student Retention withData Building Better Data Resources
  • 2.
    FTIC - OneYear Persistence Rate 57% 60% 61% 61% 64% 60% 63% 43% 40% 39% 39% 36% 40% 37% 0% 10% 20% 30% 40% 50% 60% 70% 80% 90% 100% Fall 2005 to Fall 2006 Fall 2006 to Fall 2007 Fall 2007 to Fall 2008 Fall 2008 to Fall 2009 Fall 2009 to Fall 2010 Fall 2010 to Fall 2011 Fall 2010 to Fall 2011 Persist Did not Persist
  • 3.
  • 4.
    First Things • Weare using a Learning Community Cohort. • We are not using the THECB first time in college cohort. • Why? – THECB Cohort is artificial where the Learning Community Cohort is not – Learning Community cohort is easier to understand. – Learning Communities is where the “rubber meets the work” in retention. – However, the Learning Community and THECB cohort is a close match.
  • 5.
    Percentage Retained byGender 63.88% 61.74% 0% 10% 20% 30% 40% 50% 60% 70% 80% 90% 100% Male Female Percent Retained One Year
  • 6.
    Number of Malesand Females in Cohort 562 826 0 100 200 300 400 500 600 700 800 900 Male Female Number of Students
  • 7.
    Colleges by Gender 5.05% 9.36% 13.05% 19.83% 24.38% 28.33% 9.87% 18.67% 10.05% 15.62% 36.80% 8.98% 0%10% 20% 30% 40% 50% Undeclared Business Education Liberal Arts Science & Engineering Nursing & Health Sciences Male Female Χ2= 116.2821 P < .001
  • 8.
    Average Total SATScore by Gender 1398.54 1424.48 600 800 1000 1200 1400 1600 1800 2000 2200 2400 Female Male Average Total ScoreIncludes converted ACT scores.
  • 9.
    Colleges by SATScore 1,435.50 1,385.87 1,369.13 1,405.94 1,435.95 1,369.08 1,405.00 1,380.20 1,362.32 1,441.51 1,480.49 1,361.22 600 1,200 1,800 2,400 Undeclared Business Education Liberal Arts Science & Engineering Nursing & Health Sciences Male Female ScoreIncludes converted ACT scores.
  • 10.
    Retention by AdmitType 56.47% 66.61% 0% 10% 20% 30% 40% 50% 60% 70% 80% 90% 100% Alternative Admit Normal Admit Percent Retained One Year Χ2= 14.1021 P<.001
  • 11.
    Percentage Retained byPell Eligibility 58.07% 67.15% 0% 10% 20% 30% 40% 50% 60% 70% 80% 90% 100% Pell Eligible Not Pell Eligible Percent Retained One Year Χ2 = 12.2147 P<.001
  • 12.
    Academic Standing atthe End of Fall 2011 27.08% 72.92% 0% 10% 20% 30% 40% 50% 60% 70% 80% 90% 100% Probation/Suspension Good Standing Percent of Students Χ2 = 287.8715 P<.001
  • 13.
    Percentage Retained byAcademic Standing 29.92% 75.88% 0% 10% 20% 30% 40% 50% 60% 70% 80% 90% 100% Probation/Suspension Good Standing Percent of Students Retained One Year Χ2 = 246.3207 P<.001
  • 14.
    Percentage Retained byCollege Generation 59.42% 62.34% 0% 10% 20% 30% 40% 50% 60% 70% 80% 90% 100% First Generation Not First Generation Percent of Students Retained One Year Χ2 = 1.0275 P<.31
  • 15.
    Percentage Retained byHigh School Quartile 60.00% 52.12% 55.56% 71.31% 0% 10% 20% 30% 40% 50% 60% 70% 80% 90% 100% Bottom Quarter Third Quarter Second Quarter Top Quarter Percent of Students Retained One Year Χ2 = 35.8868 P<.001
  • 16.
    54.1% 31.5% 46.8% 50.0% 54.8% 57.1% 58.5% 60.5% 61.2% 64.6% 68.8% 0% 10% 20%30% 40% 50% 60% 70% 80% 90% 100% Total N M T F V B E K L W T R I A D Total N M T F V B E K L W Failed 54.1% 31.5% 46.8% 50.0% 54.8% 57.1% 58.5% 60.5% 61.2% 64.6% 68.8% Percent of Students who received either D,F, or W in a Developmental Education Course Fall 2011 Triads (Student in DE)
  • 17.
    25.3% 0.0% 7.4% 8.5% 16.7% 22.0% 22.6% 24.4% 25.5% 30.2% 42.7% 98.2% 0% 10% 20%30% 40% 50% 60% 70% 80% 90% 100% Total S V T W F E B L K M N T R I A D Total S V T W F E B L K M N Enrolled in DE 25.3% 0.0% 7.4% 8.5% 16.7% 22.0% 22.6% 24.4% 25.5% 30.2% 42.7% 98.2% Percent Enrolled in Developmental Education Fall 2011 Triads
  • 18.
    37.4% 25.3% 34.0% 35.1% 35.6% 37.2% 38.2% 38.4% 38.9% 40.5% 40.9% 41.7% 0% 10% 20%30% 40% 50% 60% 70% 80% 90% 100% Total S T V L F N E K B M W T R I A D Total S T V L F N E K B M W Not Retained 37.4% 25.3% 34.0% 35.1% 35.6% 37.2% 38.2% 38.4% 38.9% 40.5% 40.9% 41.7% Percent Not Retained One Year Fall 2011 Triads
  • 19.
    RISK FACTORS BYTRIAD FALL 2012 Not all Triads are created equal
  • 20.
    54.5% 21.7% 31.3% 37.8% 40.9% 48.5% 49.5% 53.3% 54.4% 60.7% 62.5% 63.2% 96.5% 0% 10% 20%30% 40% 50% 60% 70% 80% 90% 100% Total S G T V W C E K F B L N T R I A D Total S G T V W C E K F B L N Percent Alt. Admit 54.5% 21.7% 31.3% 37.8% 40.9% 48.5% 49.5% 53.3% 54.4% 60.7% 62.5% 63.2% 96.5% Percent Alternative Admit Fall 2012 Triads
  • 21.
    48.0% 26.7% 37.5% 38.0% 39.1% 43.0% 44.3% 47.9% 49.4% 49.8% 54.8% 55.2% 64.9% 0% 10% 20%30% 40% 50% 60% 70% 80% 90% 100% Total T G C S V W E F K L B N T R I A D Total T G C S V W E F K L B N Pell Eligible 48.0% 26.7% 37.5% 38.0% 39.1% 43.0% 44.3% 47.9% 49.4% 49.8% 54.8% 55.2% 64.9% Percent Eligible for Pell Grant Fall 2012 Triads
  • 22.
    39.5% 23.9% 28.9% 31.3% 33.0% 34.4% 35.1% 38.3% 39.7% 42.1% 43.7% 46.9% 47.4% 0% 10% 20%30% 40% 50% 60% 70% 80% 90% 100% Total S T G W V K E C N F L B T R I A D Total S T G W V K E C N F L B First Generation 39.5% 23.9% 28.9% 31.3% 33.0% 34.4% 35.1% 38.3% 39.7% 42.1% 43.7% 46.9% 47.4% Percent First Generation Fall 2012 Triads
  • 23.
    23.7% 6.5% 15.4% 18.3% 21.8% 21.9% 24.0% 24.5% 26.1% 26.3% 26.6% 28.0% 40.4% 0% 10% 20%30% 40% 50% Total S W V K G E C B F T L N T R I A D Total S W V K G E C B F T L N Bottom Half 23.7% 6.5% 15.4%18.3%21.8%21.9%24.0%24.5%26.1%26.3%26.6%28.0%40.4% Percent Ranked in Bottom Half of High School Fall 2012 Triads
  • 24.
    493 394 481 482 482 488 489 499 505 519 522 536 561 200 300 400500 600 700 800 Total N B F L K W E C G V S T T R I A D Total N B F L K W E C G V S T Avg. SAT Math 493 394 481 482 482 488 489 499 505 519 522 536 561 Average SAT Math Fall 2012 Triads
  • 25.
    1,427 1,188 1,378 1,399 1,402 1,420 1,432 1,453 1,461 1,508 1,511 1,539 1,561 600 800 1,0001,200 1,400 1,600 1,800 2,000 2,200 2,400 Total N L B F K E C W V G T S T R I A D Total N L B F K E C W V G T S Avg. Total Score 1,427 1,188 1,378 1,399 1,402 1,420 1,432 1,453 1,461 1,508 1,511 1,539 1,561 Average Total SAT Score Fall 2012 Triads
  • 26.
    20 16 19 19 20 20 20 21 21 21 21 22 23 1 6 1116 21 26 31 36 Total N F L B C K E T V W G S T R I A D Total N F L B C K E T V W G S Avg. Act Composite 20 16 19 19 20 20 20 21 21 21 21 22 23 Average ACT Composite Fall 2012 Triads
  • 27.
    57.45% 59.32% 64.60% 66.15% 69.88% 70.50% 72.05% 72.98% 73.29% 74.84% 0% 10% 20%30% 40% 50% 60% 70% 80% 90% 100% Motivation Information Processing Self Testing** Anxiety Test Strategies** Concentration Time Management** Study Aids** Attitude Selecting Main Ideas** L a s s i S c a l e s Percentage of TAMU-CC Students that Did Not Meet Expectations of LASSI Creators* *Percentage of TAMU-CC Students Worse than 50-55% Percent of Those in the Normed Sample Fall 2012 **Bottom 55th Percentile
  • 28.
    Coming Soon • Thispresentation in the tip of the iceberg • Beginning College Survey of Student Engagement – Data Push • New Course Evaluation Pilot • Predictive Models of Student Success using data from multiple time points • Focus Groups • New survey instruments