Download to read offline
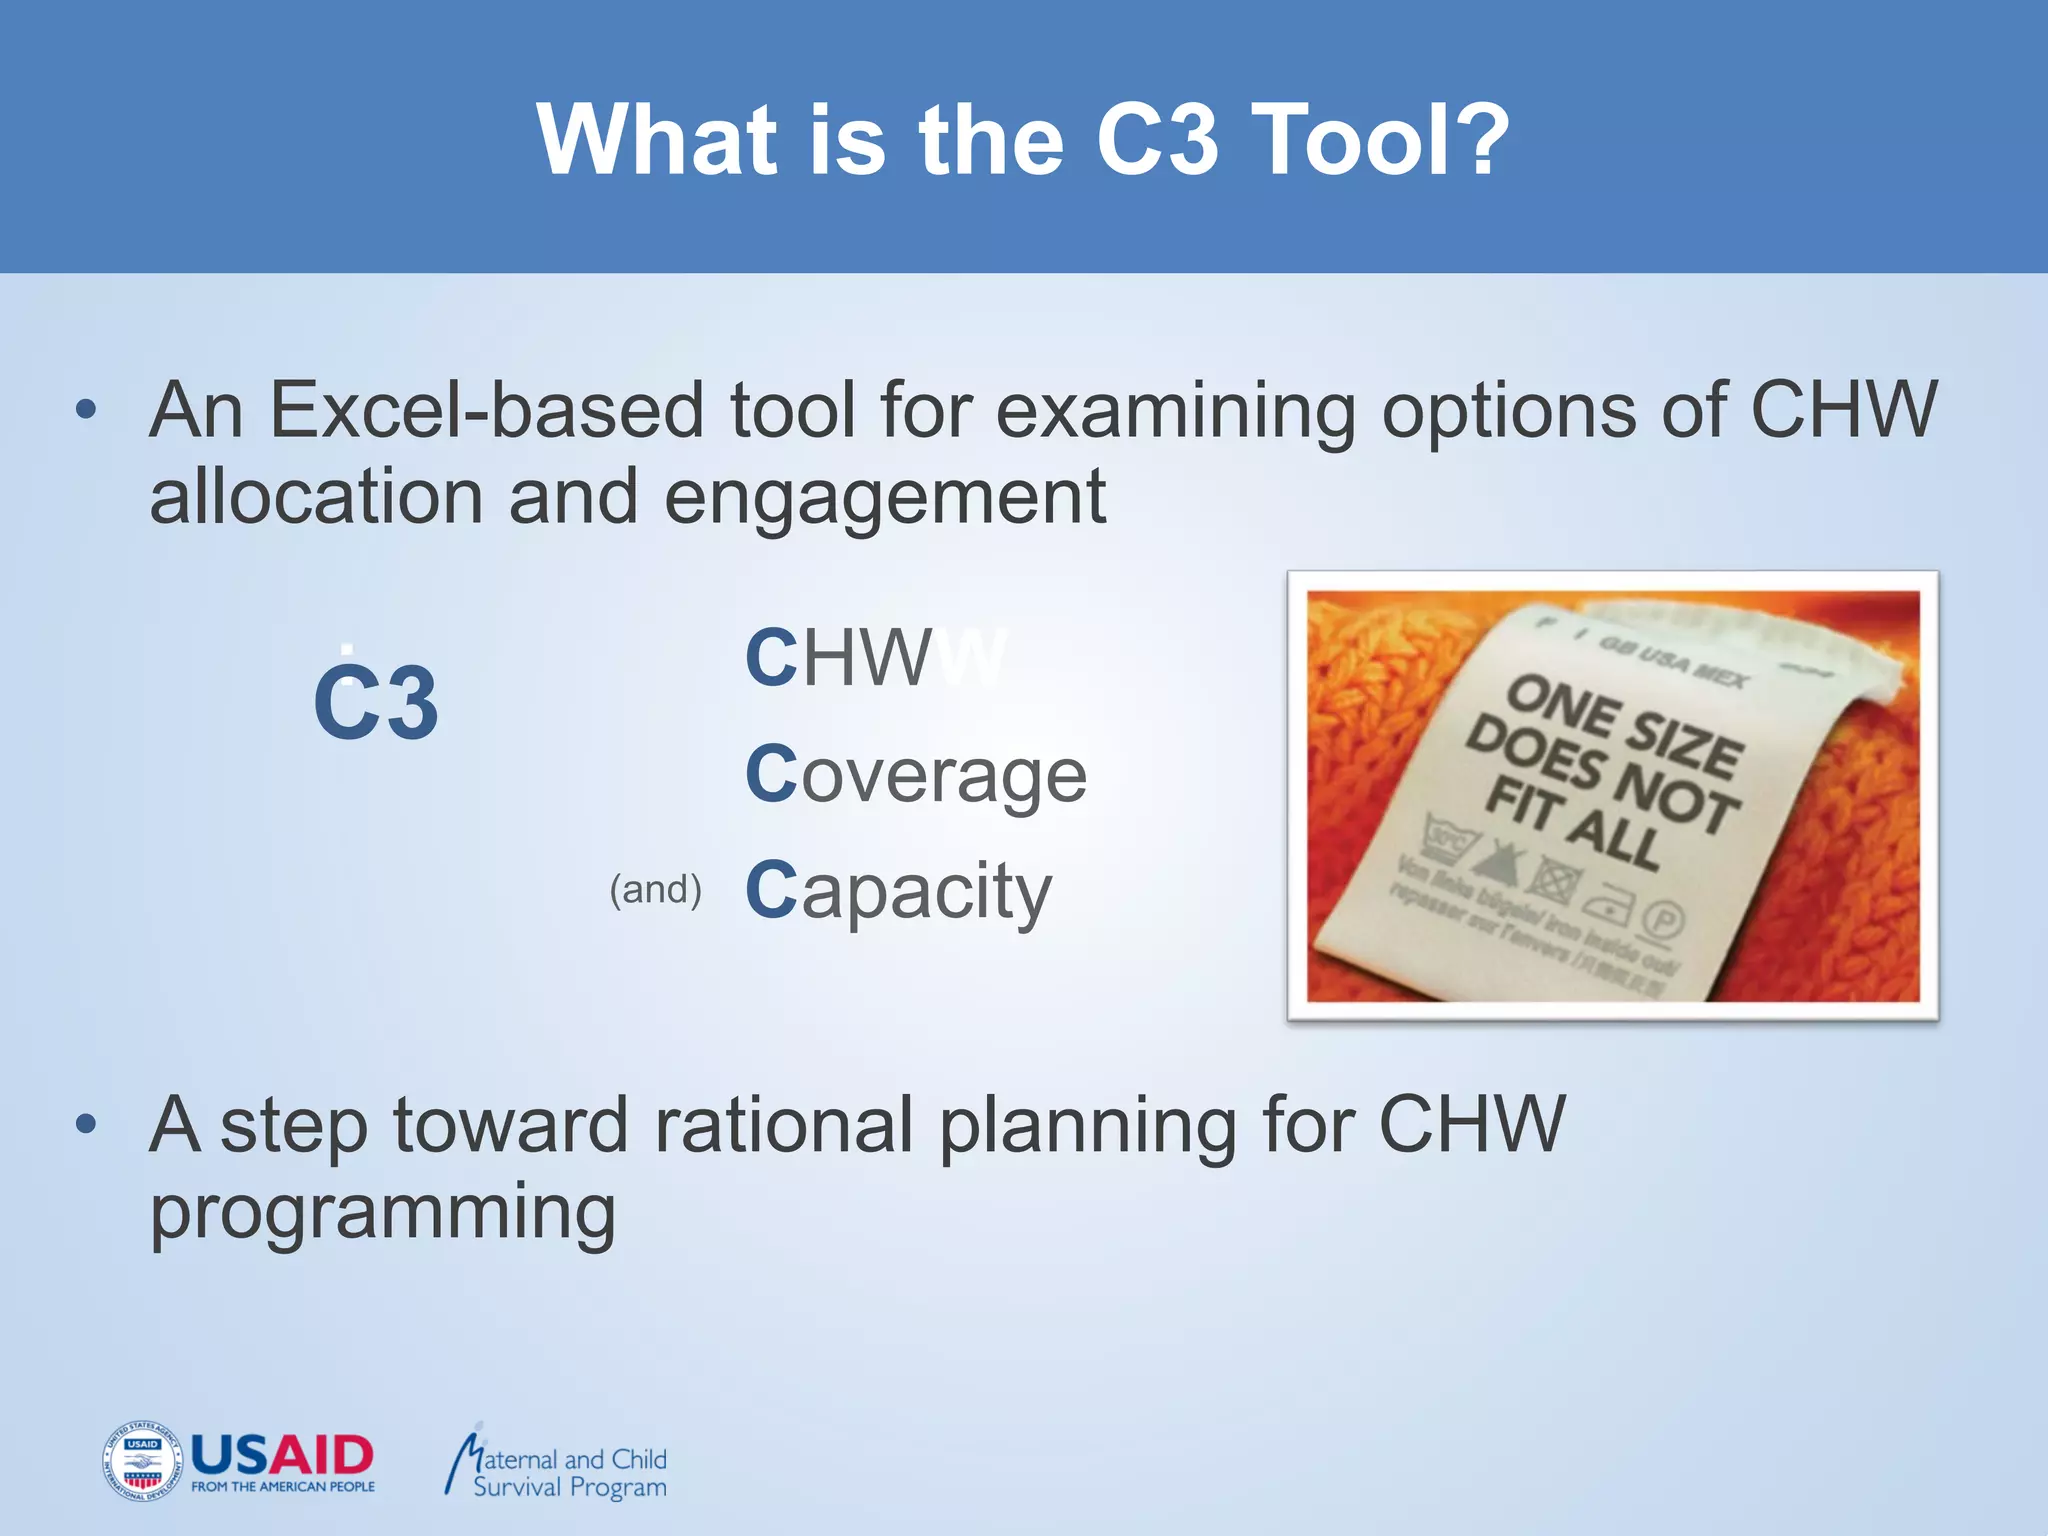
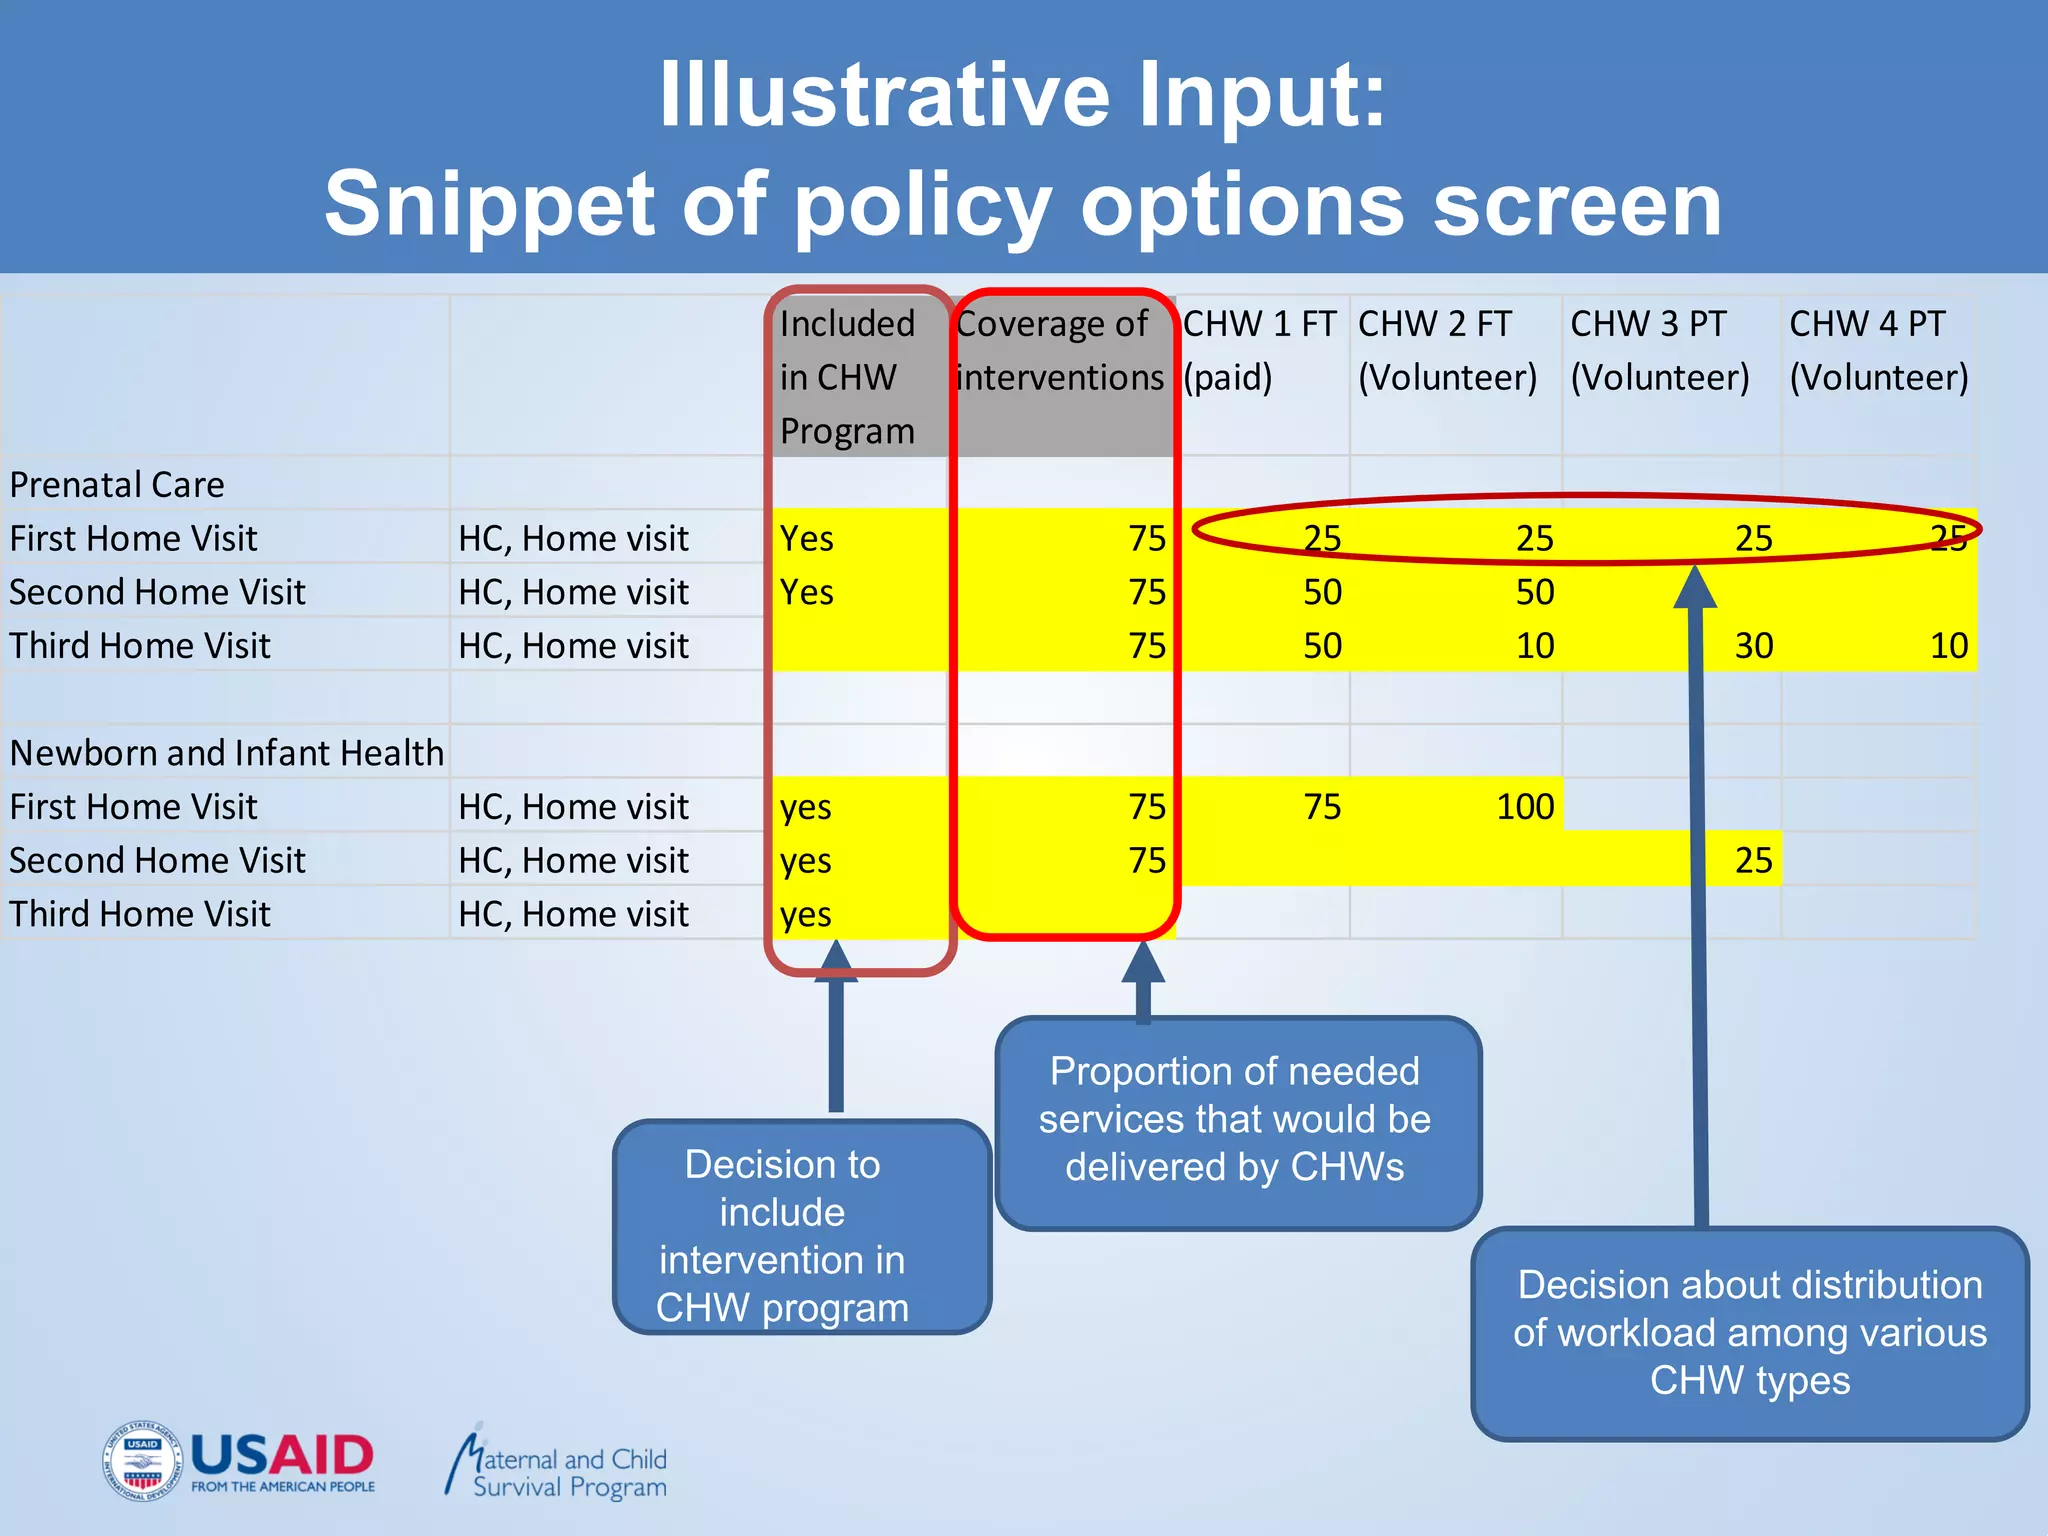
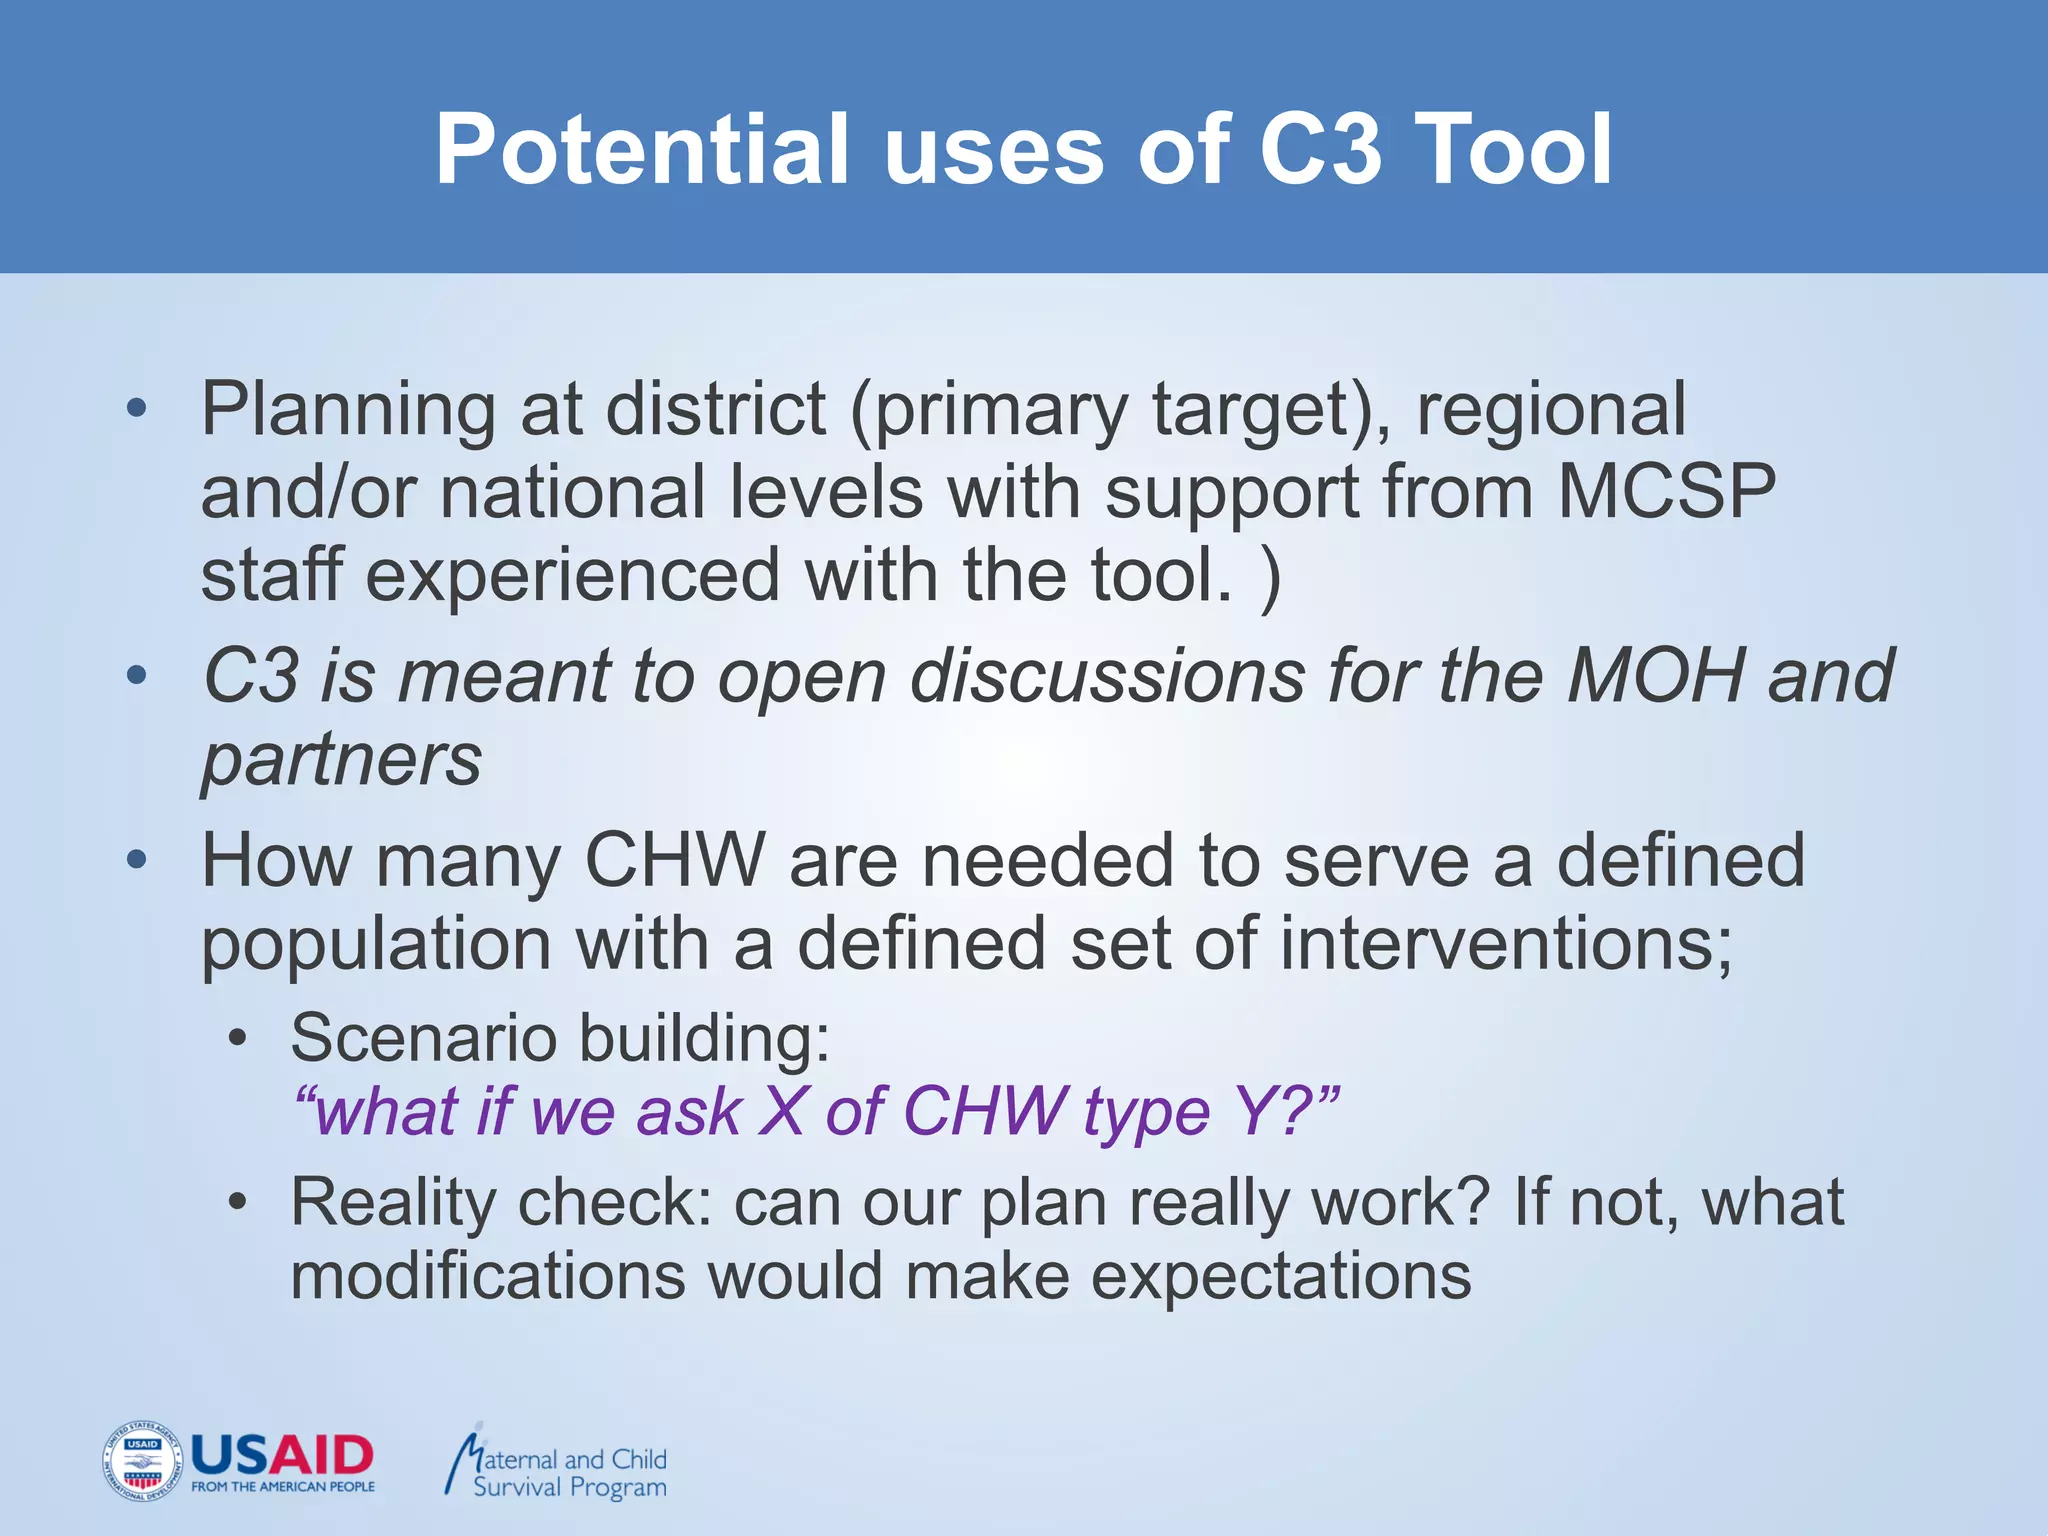
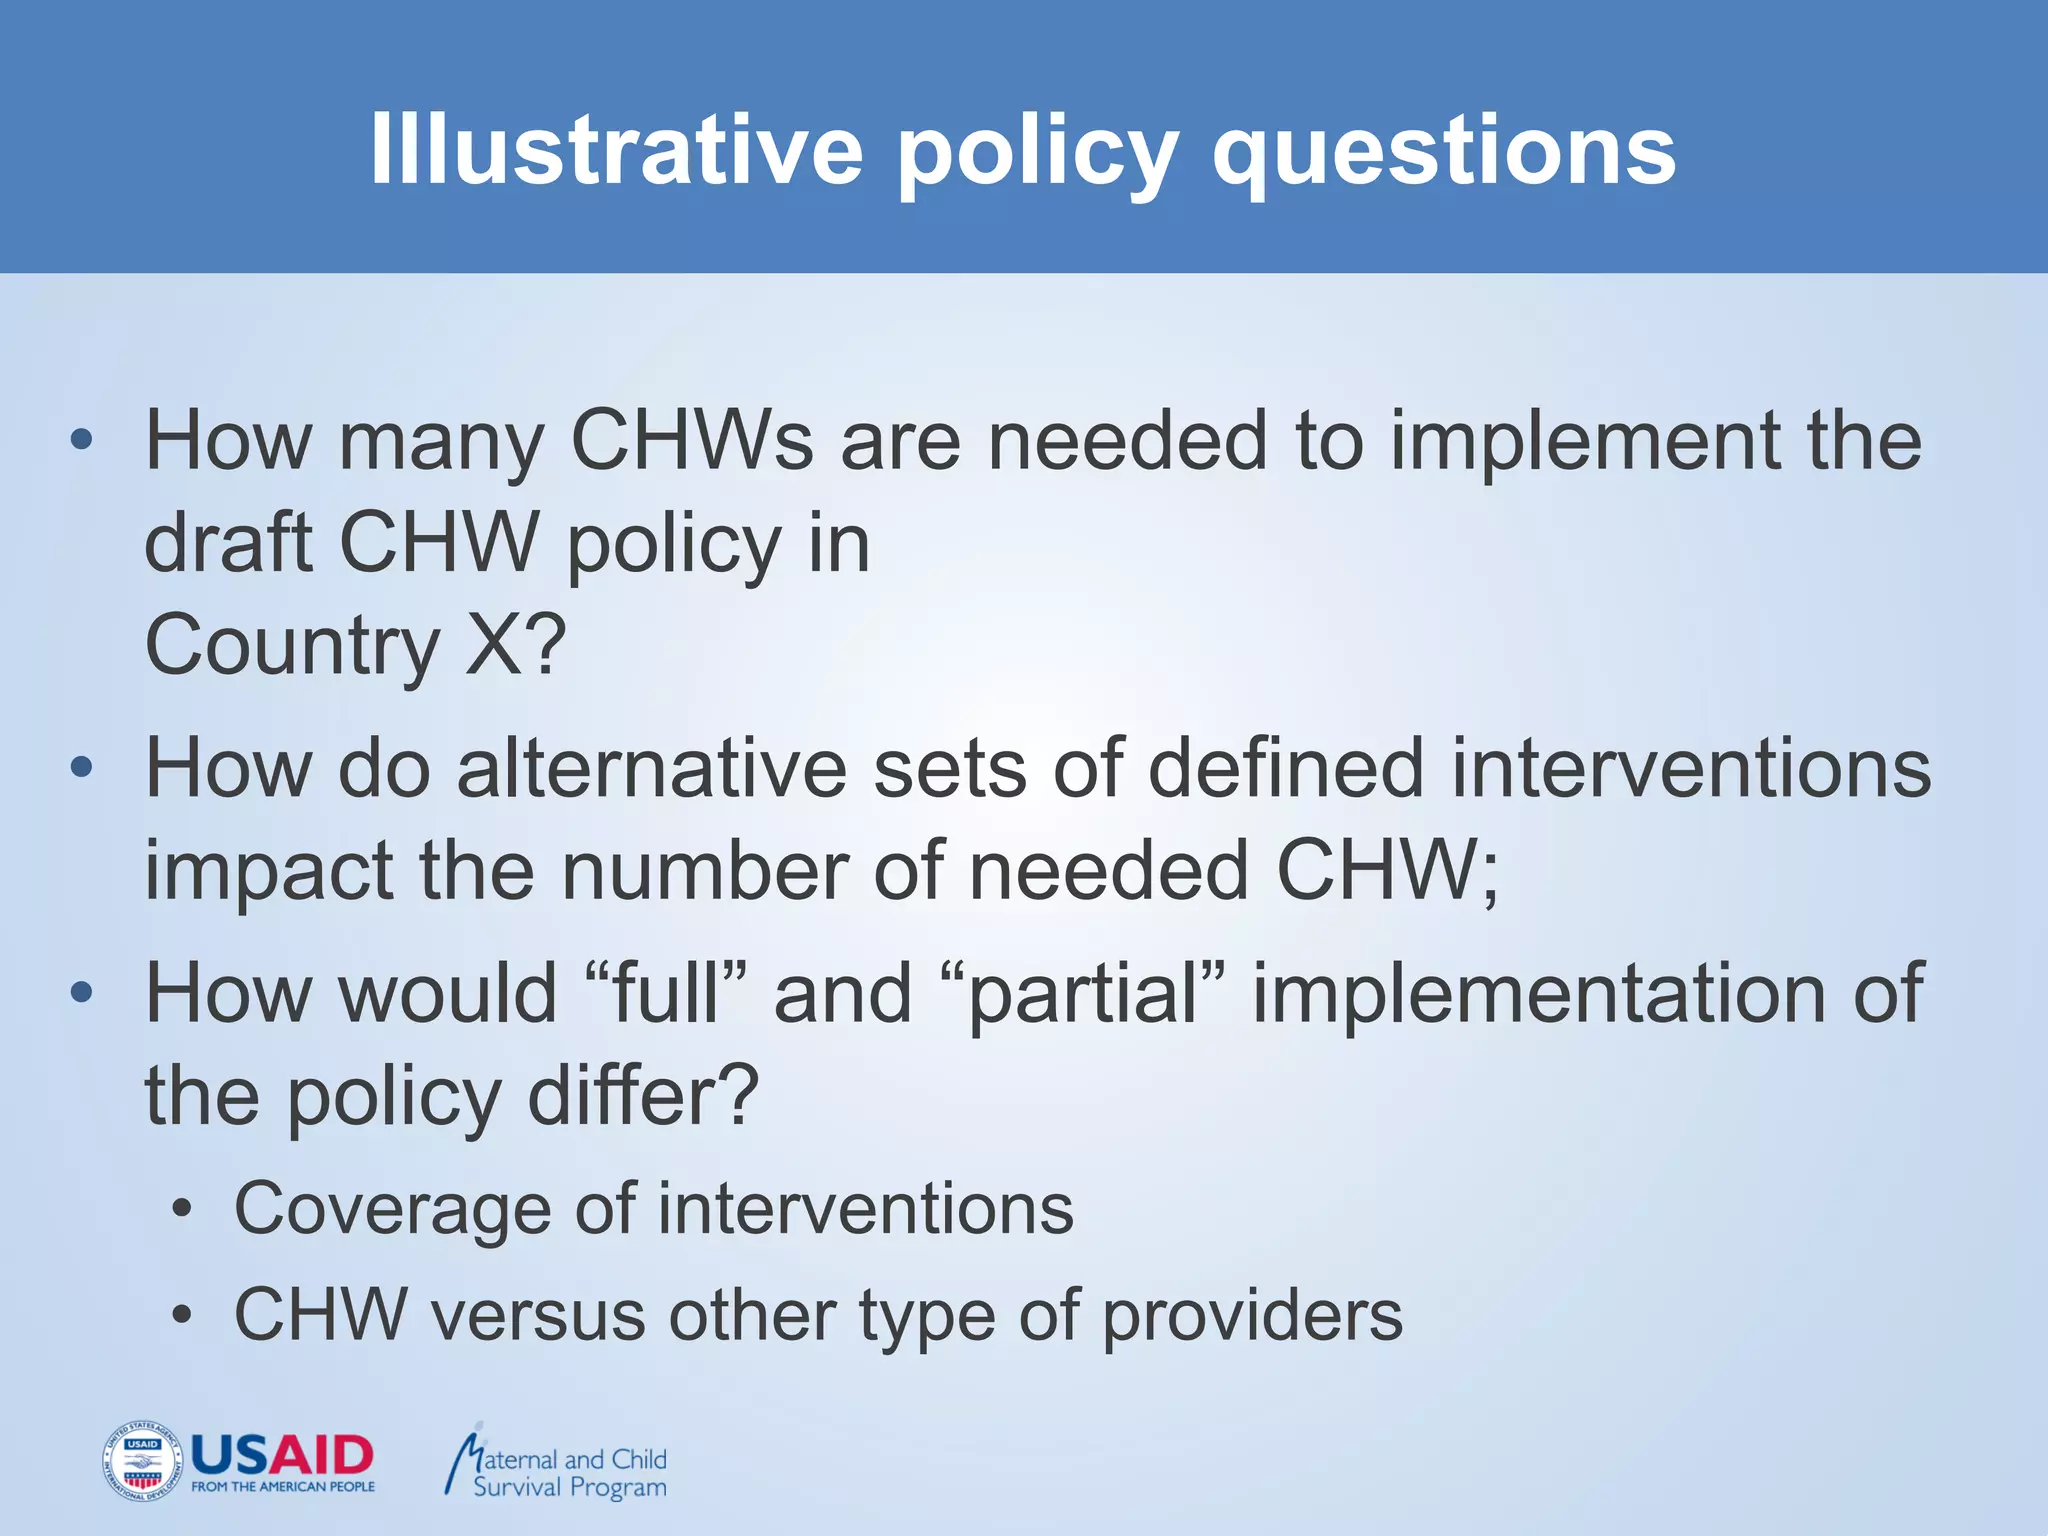
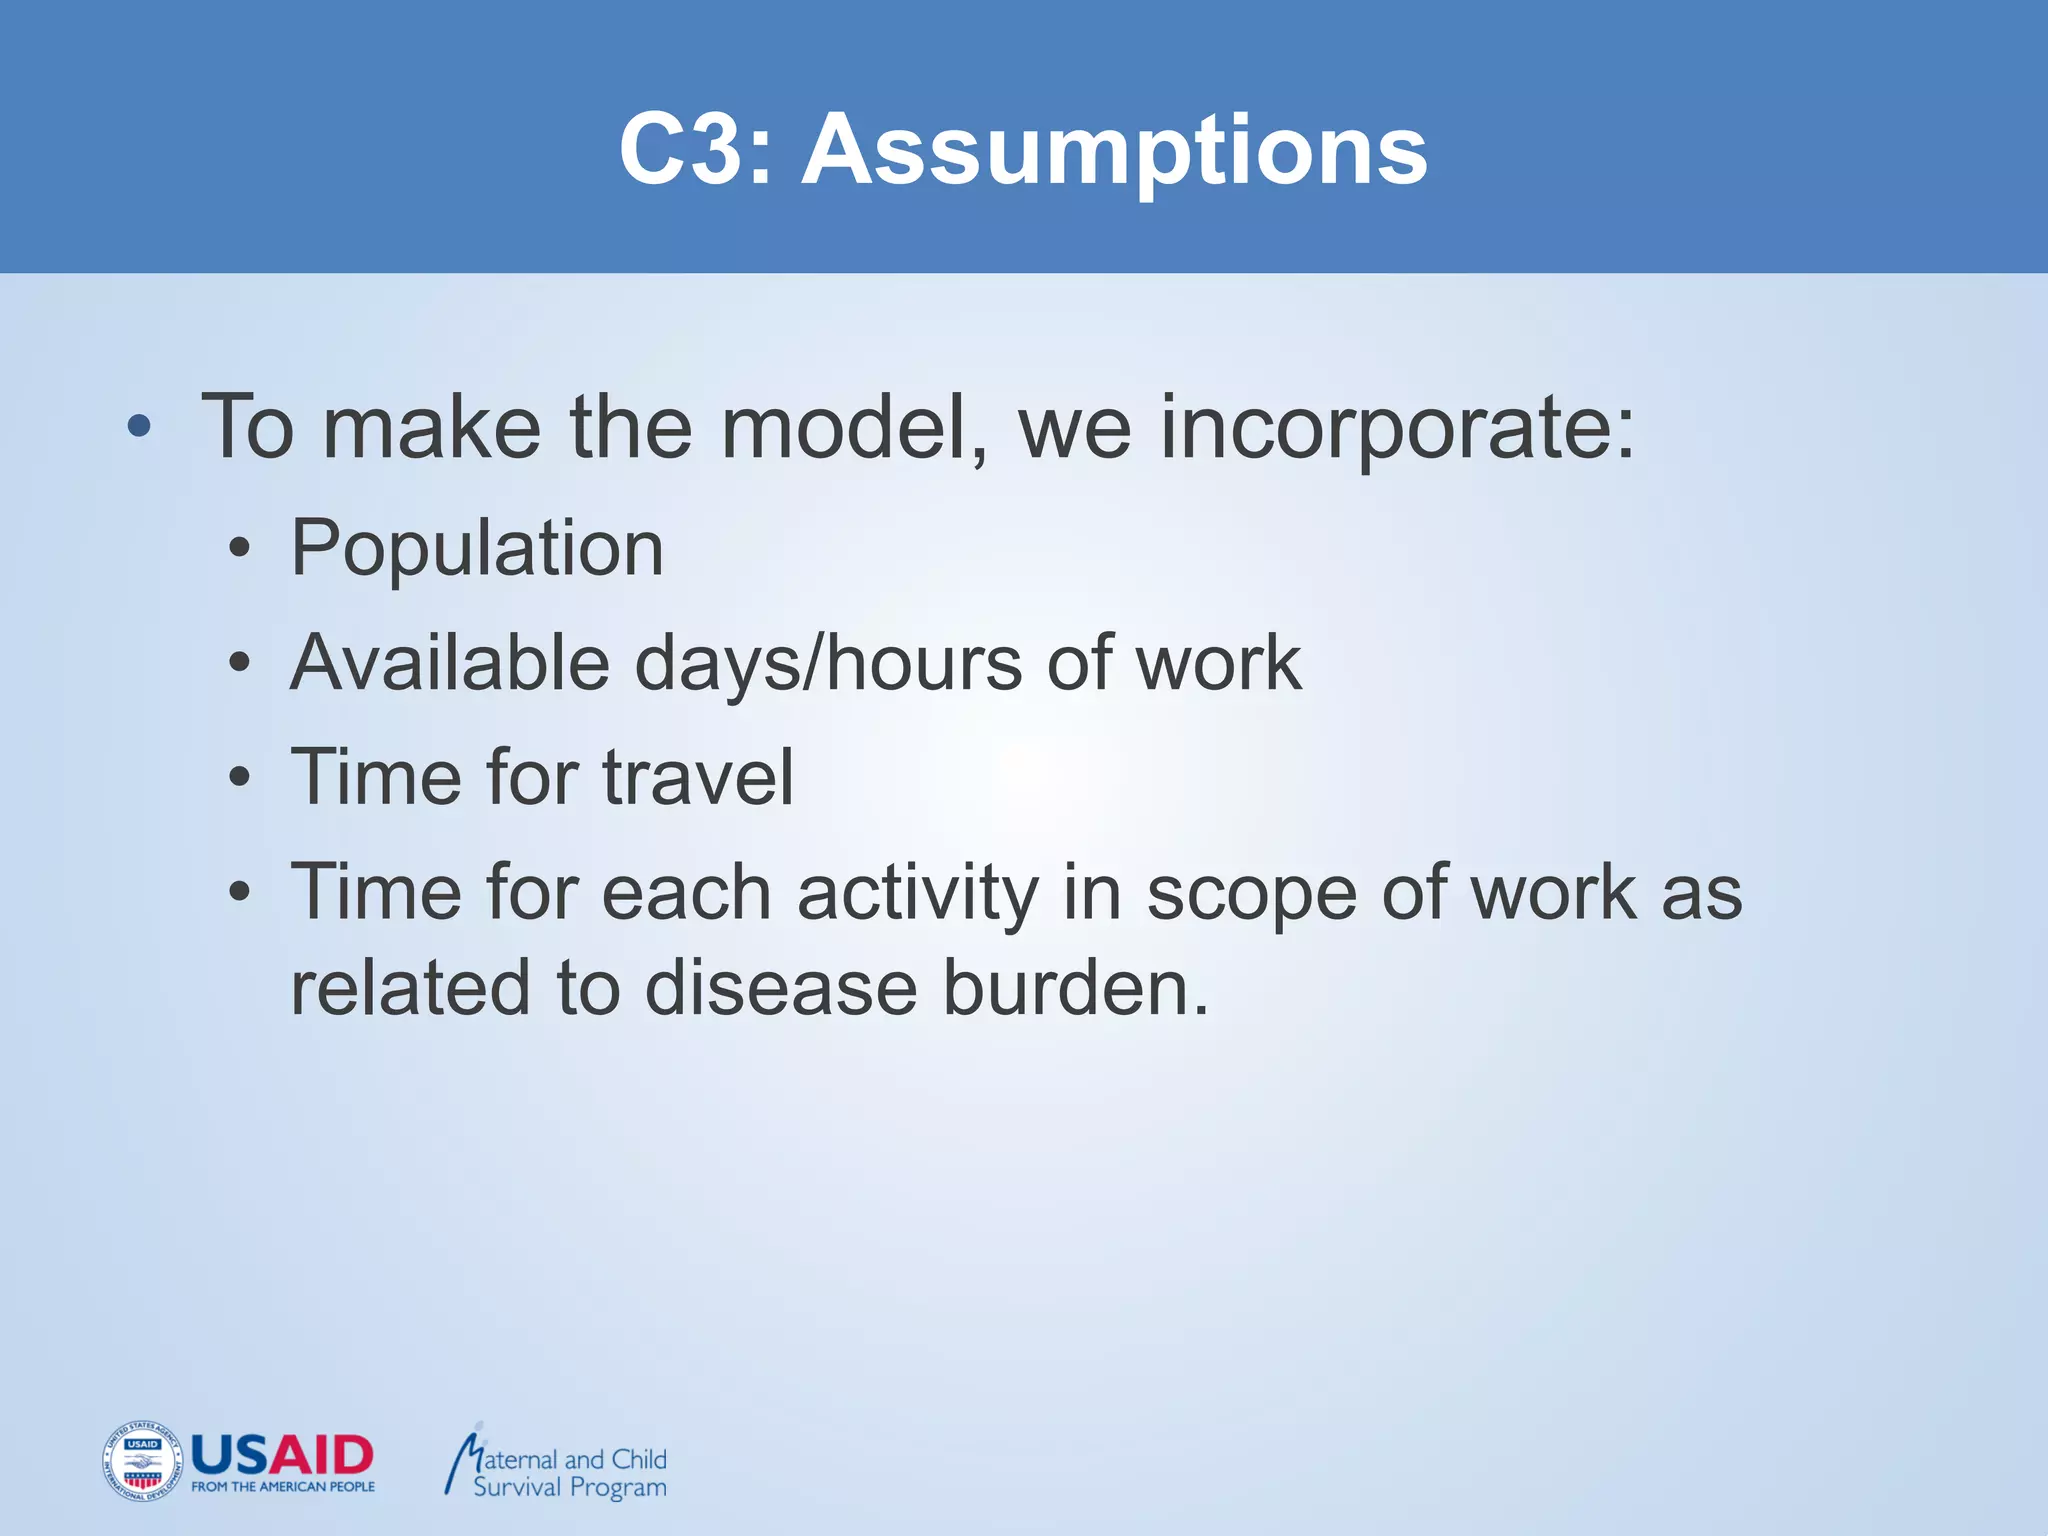
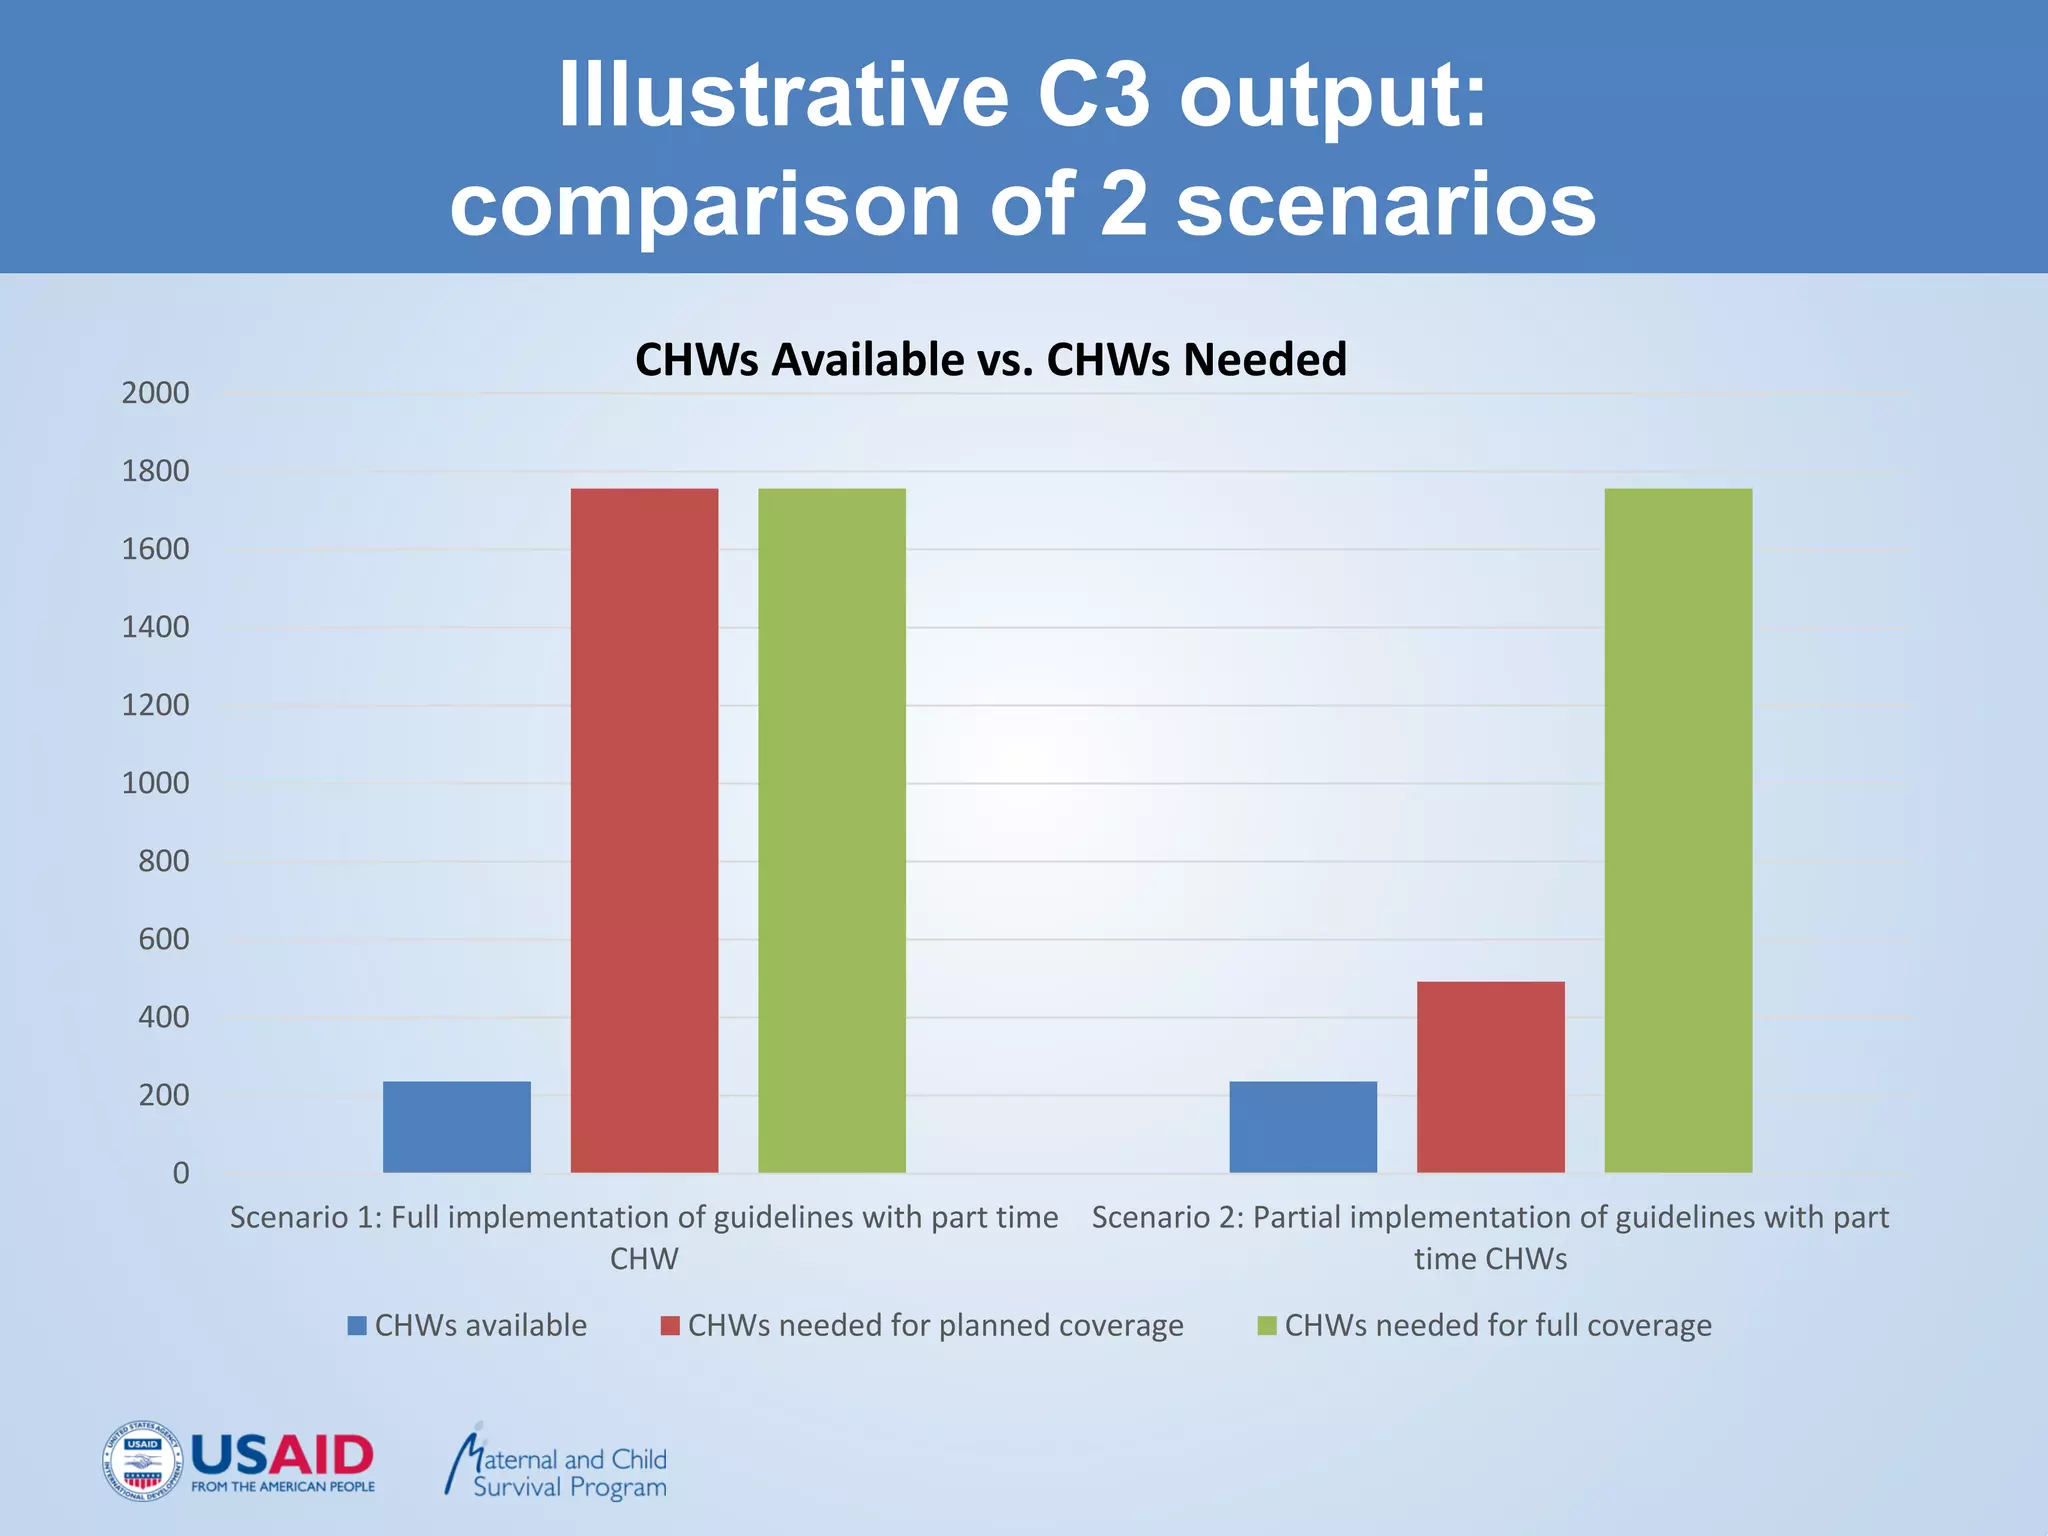
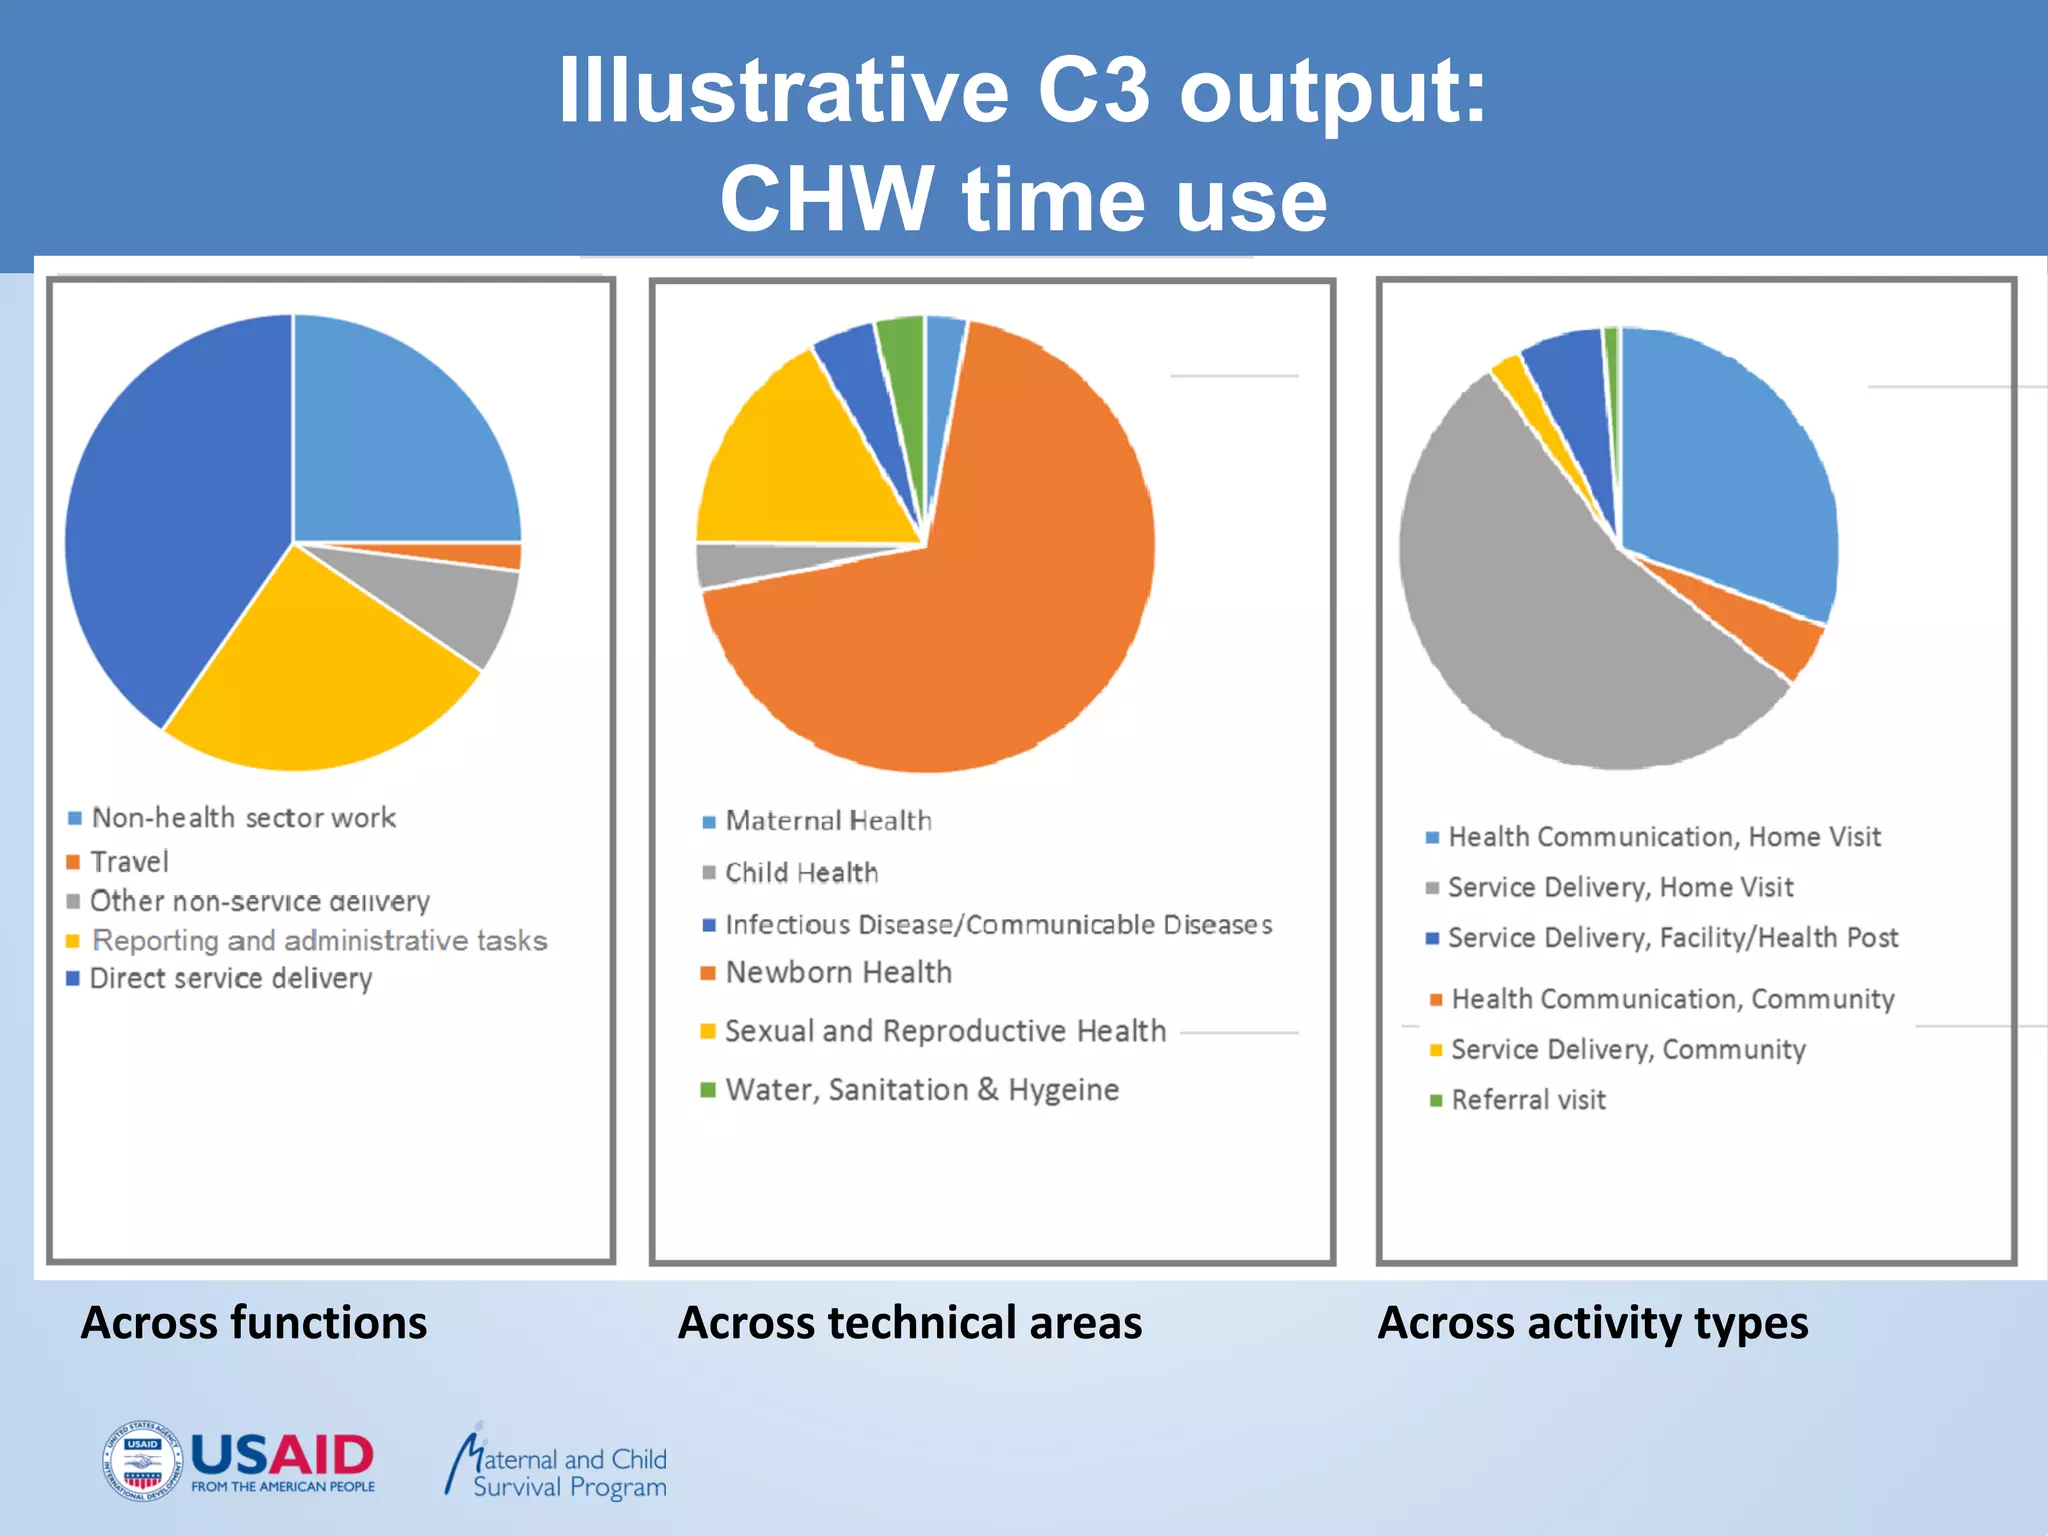
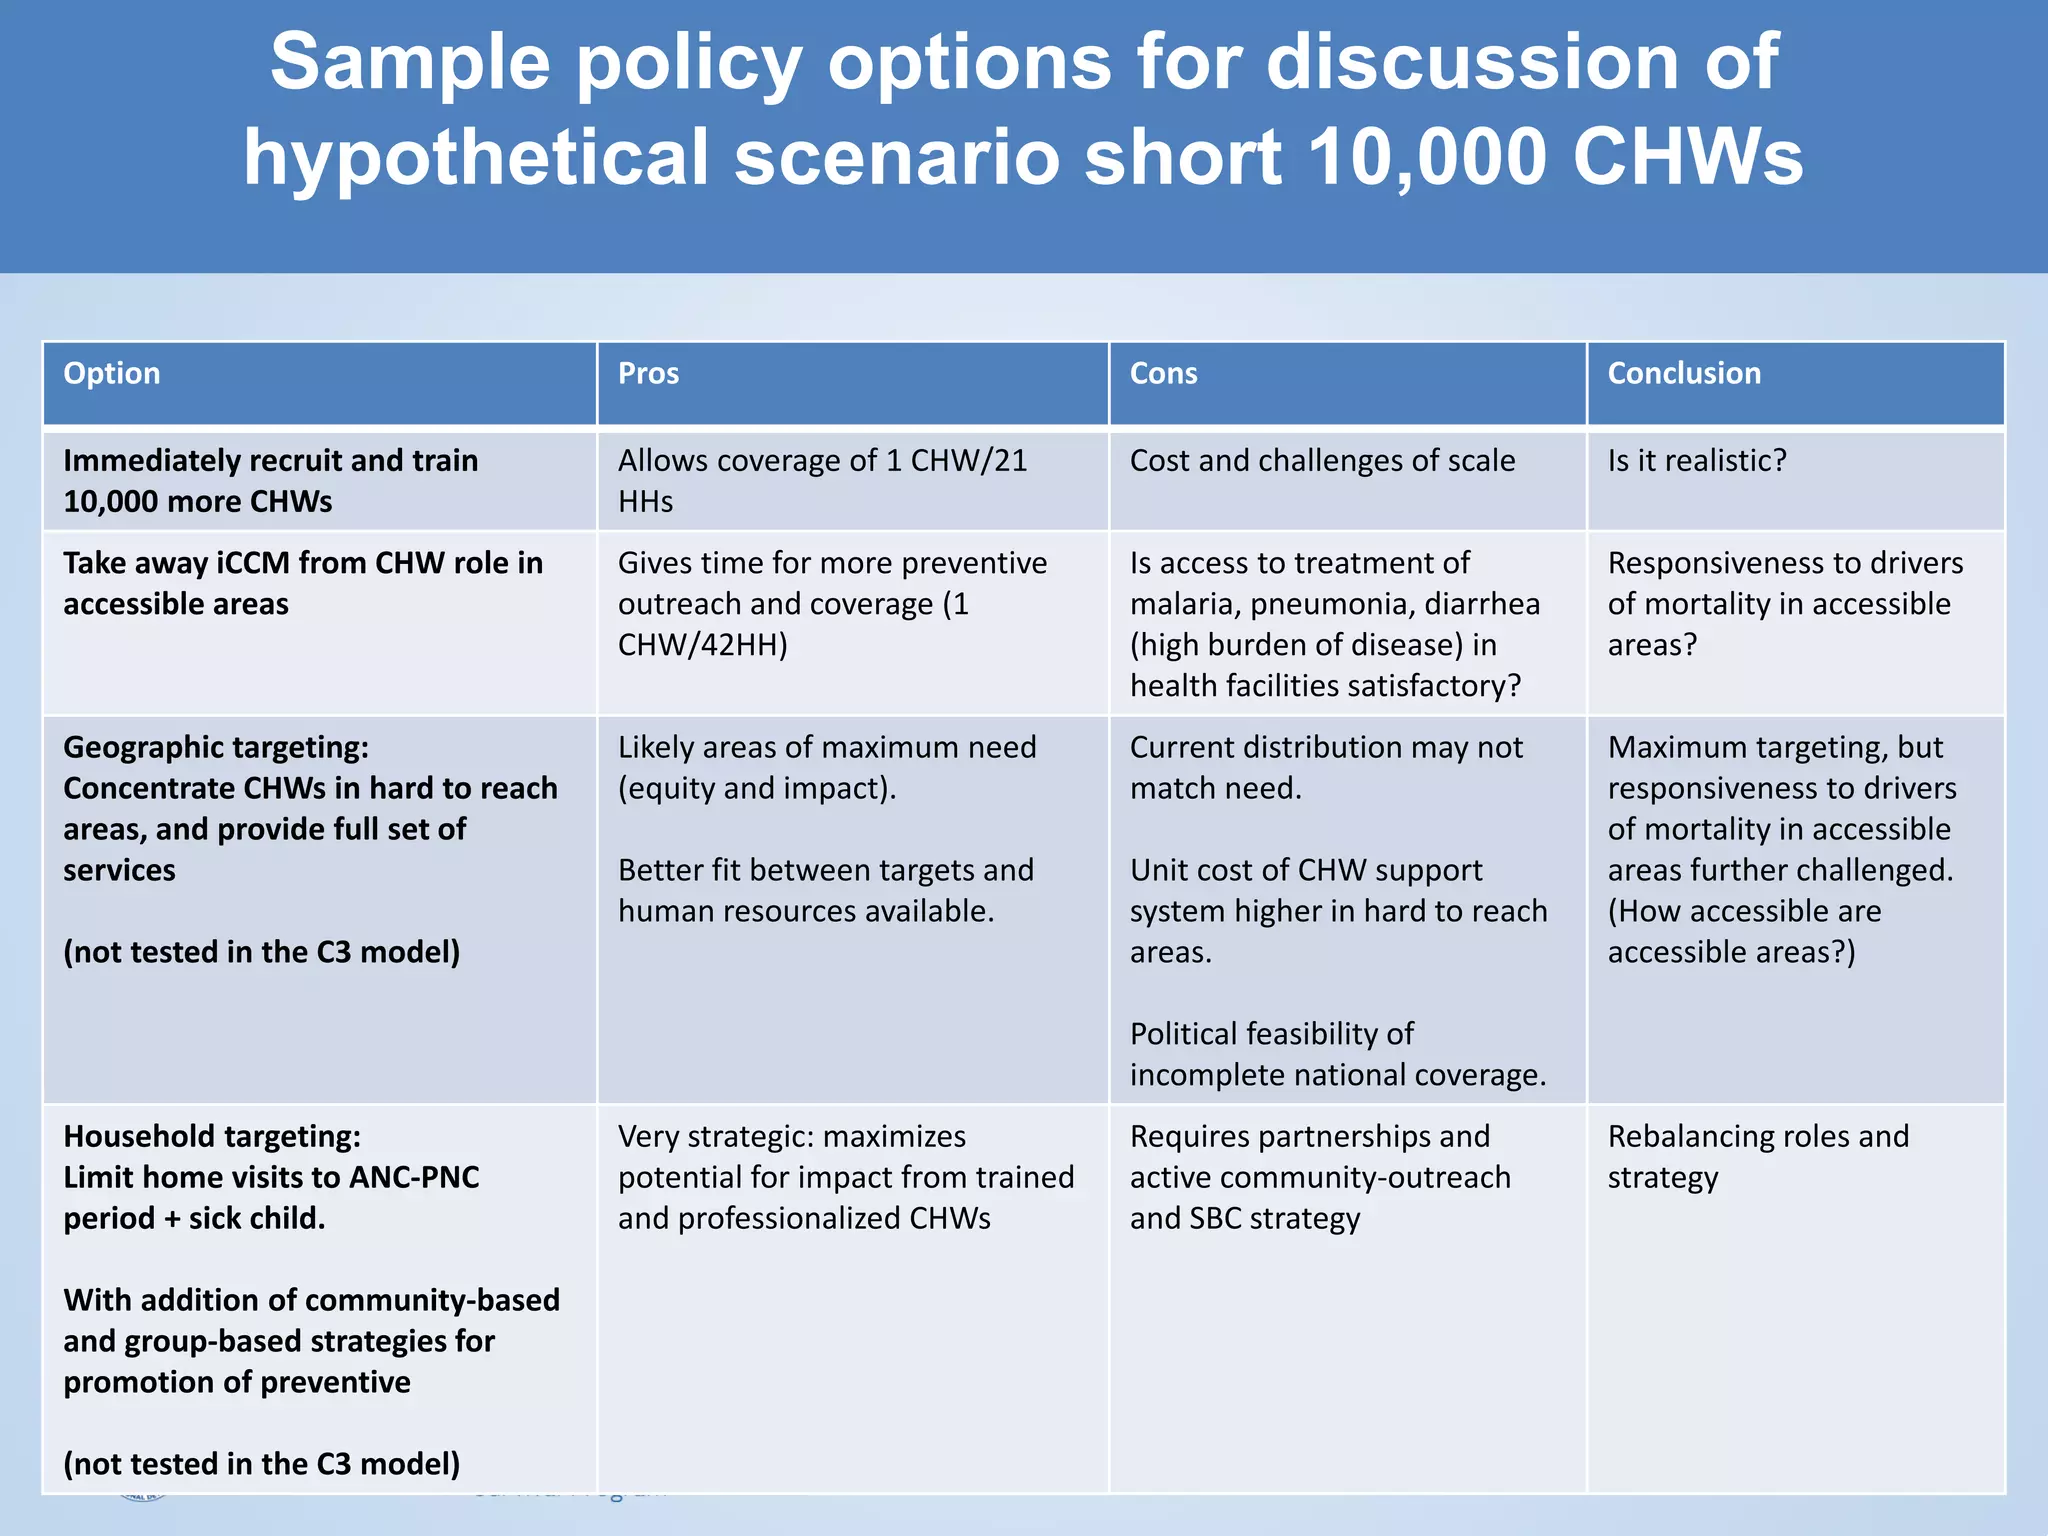

The C3 tool is an Excel-based tool that can examine options for allocating and engaging CHWs (community health workers) to help strengthen CHW policy and programming. It allows users to input data on the population, CHW workload and time spent on various health activities. The tool then compares the number of CHWs needed to implement different policy scenarios against the number of CHWs available to determine if coverage targets can be realistically achieved. It is meant to facilitate planning and discussions between ministries of health and partners on rational CHW programming approaches based on available resources. The tool does not provide costing information or guarantee accurate predictions, but allows comparison of alternative CHW allocation scenarios to help guide policy decisions.


