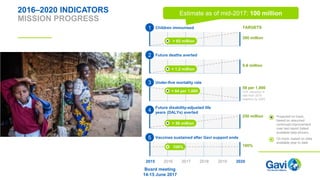
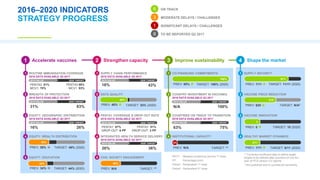
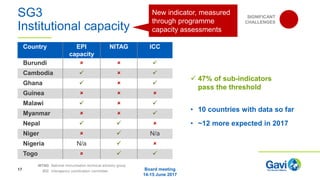
Dr Seth Berkley presents a general update to the Gavi Board meeting in Geneva, reporting on key developments in the global landscape, previous Board decisions, strategic discussion topics and critical findings from partner and performance reviews of the Alliance.
Gavi’s CEO Dr Seth Berkley presents an overview of the Alliance’s achievements to the Board on 2 December 2015. Topics include a summary of results and challenges in the 2011-2015 strategy period, Gavi’s increasing focus on coverage, equity and sustainability going forward, global health security and the broader immunisation landscape.
Gavi’s CEO Dr Seth Berkley presents an overview of the Vaccine Alliance’s achievements to the Board on 22 June 2016. Topics include results and challenges in the 2011-2015 period, early progress in implementing the 2016-2020 strategy and the role of immunisation on the global agenda.
Dr Seth Berkley presents a general update to the Gavi Board meeting in Côte d’Ivoire, reporting on previous Board decisions, global health threats and how the Alliance is gearing up to deliver on the new strategy.
New presentation on immunisation in the Asia-Pacific region, including support to pentavalent, pneumococcal, measles, rubella, HPV, Japanese encephalitis, hepatitis B and inactivated polio vaccines, the growing number of manufacturers of Gavi-supported vaccines based in Asia-Pacific, and the increasing co-financing contributions by countries in the region. Despite great progress challenges remain: almost half of the world’s under-immunised children are in Gavi-supported countries in Asia-Pacific.
First presented at the Meningitis Vaccine Project Closure Conference in Addis Ababa in February, Gavi’s CEO Seth Berkley gives a summary of Gavi’s role in reducing the burden of meningitis in Africa.
Gavi CEO Seth Berkley presents key achievements and challenges to the Gavi Board on 10 June 2015. Topics covered include: successful replenishment, new vaccine introductions, coverage and equity, sustainability, the broader immunisation landscape and risk management.
Gavi CEO Dr Seth Berkley presents an update to the Gavi Board meeting in Vientiane, Lao PDR, reporting on key developments in the global landscape, previous Board decisions and strategic discussion topics.
The 5-in-1 pentavalent vaccine is now available in all Gavi-supported countries at a record low price, but only 50% of the children are being reached. Learn more about the pentavalent success story – and the challenges that remain.
Some hospitals have reported returning to pre-COVID-19 volumes for certain services, but the pandemic continues to affect outpatient and surgical volumes, largely due to workforce capacity constraints.
2 of 4: Reducing Neonatal Mortality - Prevention, Early Detection and Treatme...JSI
This presentation by JSI's Nosa Orobaton, "March of Care for Newborn Umbilical Cord in Nigeria" was part of a dynamic panel moderated by JSI's Dr. Penny Dawson on February 13, 2015 at the 14th World Congress on Public Health in Kolkata, India. Four speakers summarized evidence for interventions proven to reduce newborn mortality (e.g., chlorhexidine) and shared important policy and programmatic experiences in prevention and treatment of neonatal infections. JSI's Leela Khanal and Dr. Nosa Orobaton spoke about experiences from Nepal and Nigeria in scaling up chlorhexidine use in those countries. Another speaker shared results from the COMBINE trial in Ethiopia, implemented primarily by JSI with support from SAVE/SNL, which evaluated the impact on neonatal mortality of health extension worker-led management of bacterial infections.
Insights into the 2020 Medicare Advantage marketKim Simoniello
McKinsey’s Center for US Health System Reform recently completed independent research on the options available to consumers selecting Medicare Advantage plans this fall, based on public use data files from the Centers for Medicare & Medicaid Services (CMS).
Webinar 2: Matching Access to Risk
When: May 27, 2021 @ 1:00pm – 2:30pm EST
Toon Digneffe, Head EU Public Affairs & Public Policy, Takeda Slides. Early Access & RWE: building trust and reducing
stakeholder uncertainties – a European perspective
Matching Access to Risk, but Who Pays? Who decides how much risk to accept with a new medicine? How does each stakeholder make that decision? The developer balances availability and ROI. The regulatory makes a population benefit-risk calculation. The clinician compares an unknown drug with known benefits-risks. The payer introduces a third trade-off, cost. And the patient who literally has the most at risk often has the least say.
A panel will deliberate on ways to introduce, manage, and sustain access to medicines that are matched to the types and levels of “risk?” When should managed access programs be used, or not? When do you need bigger, longer, broader clinic trials, and when should we rely on “real-world” data? How can genomic profiling target individuals with highly precise medications? How can blockchain technology and artificial intelligence be used to improve treatment algorithms and cost-effective use?
Why consumers are crucial for building a sustainable healthcare systemMcKinsey on Healthcare
McKinsey & Company hosted an event in Washington, DC on March 26 in partnership with the Duke-Margolis Center for Health Policy, “Why consumers are crucial for building a sustainable healthcare system.”
American consumers are navigating a “new normal” of living with COVID-19, embracing at-home testing and the added convenience of virtual care, and seeking new options for how and where they conduct work, according to the latest consumer healthcare insights survey.
South EIP Programme Support and Assurance 2018-19Sarah Amani
A brief summary of the focus of the work of the South of England Early Intervention in Psychosis (EIP) Programme in 2018-19 as we work across systems, organisations and teams to drive better quality and outcomes for people with early psychosis and their families.
HIV Index Testing: The USAID DISCOVER-Health Project Experience in Zambia JSI
This was presented by Kalasa Mwansa during the Index Testing & Partner Notification for HIV Epidemic Control webinar on April 11th, 2019. The USAID DISCOVER- Health Project Experience aims to increase the use of high quality, integrated health services in specific target groups, and to provide integrated health products and services in a sustainable manner. In addition, it aims to contribute to HIV epidemic control and provides HIV index testing at every ART site.
Clinical Data Quality in Mozambique: A Comparative ExerciseJSI
Presentation for the American Public Health Association & Expo in Atlanta, GA. November 2017:
Ensuring that quality data are collected and reported to the Ministry of Health (MOH) is a priority in Mozambique as it is the foundation for the provision of quality health services. Since 2014, the Strategic Information Project in Mozambique (M-SIP) has provided technical assistance to MOH to conduct annual rounds of data quality assessments (DQA) in each province. Seven indicators were selected as part of the national DQA strategy. Each DQA had a quantitative and a system assessment component. The quantitative component includes tracing and verification of reported data, where recounted data is compared to data reported at three levels: health facility (HF), district, and province. M-SIP conducted all DQAs using the same methodology making the results comparable. After three consecutive national rounds, there is a clear trend of improvement, despite deviations remaining high. The regular, reinforcing nature of this activity and consistency of HF recommendations has had a positive impact on the data quality and results of the assessments. For example, the overall national deviation of the “patients active in ART” indicator decreased from 37% to 22% over the three-year period. The successful implementation of the DQA activity, as well as its unique, inclusive approach to promoting MOH ownership, has resulted in MOH recognition—at all levels—that DQA activities are crucial to future success. The M-SIP and MOH teams are now developing a more methodological approach to MOH staff empowerment, enabling fully independent MOH implementation of this activity while continuing to improve the quality of data.
3.4 Measuring access - Mitchell Briggs, Louise Harvey, Brian NivenNHS England
Measuring access. Measuring access in general practice. Focusing on the GP Access Fund national evaluation, the bi-annual data collection and the general practice workload tool. Mitchell Briggs, Programme Lead, Improving Access to General Practice, NHS England; Louise Harvey, Stakeholder Engagement Lead, Improving Access to General Practice, NHS England, Brian Niven, Technical Director, Mott Macdonald.
Alternative Payment Models: The Good, the Bad, and the UglyPYA, P.C.
Real-world examples and case studies related to operationalizing, remaining compliant, valuing APMs and the evolving alternative payment models (APMs) as a catalyst for change and innovation in healthcare delivery are discussed during the presentation, “Alternative Payment Models: The Good, The Bad, and The Ugly.”
Global Overview of Sustainable Public Procurement
Implementation
Introductory workshop on Sustainable Public Procurement and eco-labelling
in the Republic of Azerbaijan
A Data Centric Approach to Driving Supply Chain Efficiency in IndonesiaJSI
This poster was presented by Hery Firdaus and Bethany Saad at the International Conference on Family Planning (ICFP) in Kigali, Rwanda in November 2018.
Over the past decade, Indonesia’s contraceptive prevalence rate has remained stagnant, to reinvigorate family planning services in Indonesia The National Population & Family Planning Board (BKKBN) is working to ensure that women can choose from a variety of contraceptive methods as part of a “Right Method, Right Time, My Choice” strategy. One challenge to this strategy is inconsistent access to the full range of contraceptives, especially long acting contraceptives, at service delivery points (SDP).
Having a reliable, responsive supply chain that delivers quality contraceptives to service delivery points when and where they are needed is critical to ensuring the success of this strategy. JSI Research & Training Institute, Inc. (JSI) as part of the My Choice Project has been working with BKKBN to address the supply chain challenges.
Can contraceptive availability be improved by strengthening organizational supply chain capacity, multi-level collaboration, and data visibility and use? To achieve this the intervention package included
1) strengthening organizational capacity by redesigning standard processes and developing training tools such as video tutorials and mobile apps
2) improved multi-level collaboration through quality improvement techniques, mentorship, and on-the-job training and
3) improving data visibility, quality, and use through accurate logistics records and reports, creating an inventory management and monitoring tool that facilitates easy decision making, guides stock distribution to maintain adequate stock levels, and monitors overall performance of the supply chain.
Preliminary end line evaluation results suggest that the intervention package has improved supply chain performance and reduced stock outs, especially in areas where the full package was implemented.
Similar to Strategy update: indicators, progress and lessons learned (20)
Dr Seth Berkley presents an update to the Gavi Board meeting in New Delhi, India, covering key developments in the global landscape; how Gavi is working differently to reach zero-dose communities and strengthen primary health care; previous Board decisions; and updates from the Alliance and the Secretariat.
Presentation from Gavi CEO Dr Seth Berkley during the replenishment launch at the Seventh Tokyo International Conference on African Development (TICAD) in Yokohama, co-hosted by the Japanese government.
Dr Seth Berkley presents an update to the Gavi Board meeting in Geneva, Switzerland, covering key developments in the global landscape, strategic progress, previous Board decisions and updates from the Alliance.
Data presentation on global trends in immunisation, health and development. The presentation included a summary of the issues Gavi was created to address and how the results of its work are manifested in different countries.
From 10–11 December, the global health community and leaders are meeting in Abu Dhabi to review progress midway through Gavi’s 2016–2020 investment period.
MTR session: This is now…18 years of progress
Dr Berkley reflects on two topics:
- Gavi’s progress vis-à-vis its 2016-2020 promises
- Existing and future Gavi challenges as well as lessons learned.
Dr Seth Berkley presents an update to the Gavi Board meeting in Geneva, Switzerland, reporting on key developments in the global landscape, strategic progress, previous Board decisions and updates from the Alliance.
These lecture slides, by Dr Sidra Arshad, offer a quick overview of physiological basis of a normal electrocardiogram.
Learning objectives:
1. Define an electrocardiogram (ECG) and electrocardiography
2. Describe how dipoles generated by the heart produce the waveforms of the ECG
3. Describe the components of a normal electrocardiogram of a typical bipolar leads (limb II)
4. Differentiate between intervals and segments
5. Enlist some common indications for obtaining an ECG
Study Resources:
1. Chapter 11, Guyton and Hall Textbook of Medical Physiology, 14th edition
2. Chapter 9, Human Physiology - From Cells to Systems, Lauralee Sherwood, 9th edition
3. Chapter 29, Ganong’s Review of Medical Physiology, 26th edition
4. Electrocardiogram, StatPearls - https://www.ncbi.nlm.nih.gov/books/NBK549803/
5. ECG in Medical Practice by ABM Abdullah, 4th edition
6. ECG Basics, http://www.nataliescasebook.com/tag/e-c-g-basics
New Directions in Targeted Therapeutic Approaches for Older Adults With Mantl...i3 Health
i3 Health is pleased to make the speaker slides from this activity available for use as a non-accredited self-study or teaching resource.
This slide deck presented by Dr. Kami Maddocks, Professor-Clinical in the Division of Hematology and
Associate Division Director for Ambulatory Operations
The Ohio State University Comprehensive Cancer Center, will provide insight into new directions in targeted therapeutic approaches for older adults with mantle cell lymphoma.
STATEMENT OF NEED
Mantle cell lymphoma (MCL) is a rare, aggressive B-cell non-Hodgkin lymphoma (NHL) accounting for 5% to 7% of all lymphomas. Its prognosis ranges from indolent disease that does not require treatment for years to very aggressive disease, which is associated with poor survival (Silkenstedt et al, 2021). Typically, MCL is diagnosed at advanced stage and in older patients who cannot tolerate intensive therapy (NCCN, 2022). Although recent advances have slightly increased remission rates, recurrence and relapse remain very common, leading to a median overall survival between 3 and 6 years (LLS, 2021). Though there are several effective options, progress is still needed towards establishing an accepted frontline approach for MCL (Castellino et al, 2022). Treatment selection and management of MCL are complicated by the heterogeneity of prognosis, advanced age and comorbidities of patients, and lack of an established standard approach for treatment, making it vital that clinicians be familiar with the latest research and advances in this area. In this activity chaired by Michael Wang, MD, Professor in the Department of Lymphoma & Myeloma at MD Anderson Cancer Center, expert faculty will discuss prognostic factors informing treatment, the promising results of recent trials in new therapeutic approaches, and the implications of treatment resistance in therapeutic selection for MCL.
Target Audience
Hematology/oncology fellows, attending faculty, and other health care professionals involved in the treatment of patients with mantle cell lymphoma (MCL).
Learning Objectives
1.) Identify clinical and biological prognostic factors that can guide treatment decision making for older adults with MCL
2.) Evaluate emerging data on targeted therapeutic approaches for treatment-naive and relapsed/refractory MCL and their applicability to older adults
3.) Assess mechanisms of resistance to targeted therapies for MCL and their implications for treatment selection
HOT NEW PRODUCT! BIG SALES FAST SHIPPING NOW FROM CHINA!! EU KU DB BK substit...GL Anaacs
Contact us if you are interested:
Email / Skype : kefaya1771@gmail.com
Threema: PXHY5PDH
New BATCH Ku !!! MUCH IN DEMAND FAST SALE EVERY BATCH HAPPY GOOD EFFECT BIG BATCH !
Contact me on Threema or skype to start big business!!
Hot-sale products:
NEW HOT EUTYLONE WHITE CRYSTAL!!
5cl-adba precursor (semi finished )
5cl-adba raw materials
ADBB precursor (semi finished )
ADBB raw materials
APVP powder
5fadb/4f-adb
Jwh018 / Jwh210
Eutylone crystal
Protonitazene (hydrochloride) CAS: 119276-01-6
Flubrotizolam CAS: 57801-95-3
Metonitazene CAS: 14680-51-4
Payment terms: Western Union,MoneyGram,Bitcoin or USDT.
Deliver Time: Usually 7-15days
Shipping method: FedEx, TNT, DHL,UPS etc.Our deliveries are 100% safe, fast, reliable and discreet.
Samples will be sent for your evaluation!If you are interested in, please contact me, let's talk details.
We specializes in exporting high quality Research chemical, medical intermediate, Pharmaceutical chemicals and so on. Products are exported to USA, Canada, France, Korea, Japan,Russia, Southeast Asia and other countries.
TEST BANK for Operations Management, 14th Edition by William J. Stevenson, Ve...kevinkariuki227
TEST BANK for Operations Management, 14th Edition by William J. Stevenson, Verified Chapters 1 - 19, Complete Newest Version.pdf
Anti ulcer drugs and their Advance pharmacology ||
Anti-ulcer drugs are medications used to prevent and treat ulcers in the stomach and upper part of the small intestine (duodenal ulcers). These ulcers are often caused by an imbalance between stomach acid and the mucosal lining, which protects the stomach lining.
||Scope: Overview of various classes of anti-ulcer drugs, their mechanisms of action, indications, side effects, and clinical considerations.
Ozempic: Preoperative Management of Patients on GLP-1 Receptor Agonists Saeid Safari
Preoperative Management of Patients on GLP-1 Receptor Agonists like Ozempic and Semiglutide
ASA GUIDELINE
NYSORA Guideline
2 Case Reports of Gastric Ultrasound
Couples presenting to the infertility clinic- Do they really have infertility...Sujoy Dasgupta
Dr Sujoy Dasgupta presented the study on "Couples presenting to the infertility clinic- Do they really have infertility? – The unexplored stories of non-consummation" in the 13th Congress of the Asia Pacific Initiative on Reproduction (ASPIRE 2024) at Manila on 24 May, 2024.
Explore natural remedies for syphilis treatment in Singapore. Discover alternative therapies, herbal remedies, and lifestyle changes that may complement conventional treatments. Learn about holistic approaches to managing syphilis symptoms and supporting overall health.
MANAGEMENT OF ATRIOVENTRICULAR CONDUCTION BLOCK.pdfJim Jacob Roy
Cardiac conduction defects can occur due to various causes.
Atrioventricular conduction blocks ( AV blocks ) are classified into 3 types.
This document describes the acute management of AV block.
Prix Galien International 2024 Forum ProgramLevi Shapiro
June 20, 2024, Prix Galien International and Jerusalem Ethics Forum in ROME. Detailed agenda including panels:
- ADVANCES IN CARDIOLOGY: A NEW PARADIGM IS COMING
- WOMEN’S HEALTH: FERTILITY PRESERVATION
- WHAT’S NEW IN THE TREATMENT OF INFECTIOUS,
ONCOLOGICAL AND INFLAMMATORY SKIN DISEASES?
- ARTIFICIAL INTELLIGENCE AND ETHICS
- GENE THERAPY
- BEYOND BORDERS: GLOBAL INITIATIVES FOR DEMOCRATIZING LIFE SCIENCE TECHNOLOGIES AND PROMOTING ACCESS TO HEALTHCARE
- ETHICAL CHALLENGES IN LIFE SCIENCES
- Prix Galien International Awards Ceremony
2. Second update on the 2016–2020 strategy
• Systematic, data-driven report on progress
• Based on new, ambitious framework
• Starting to bear fruit and strengthen our understanding
• Learning what works well and where we should revisit
Lessons on indicators discussed throughout
2 Board meeting
14-15 June 2017
3. The Alliance accountability framework
Strategy indicators and targets
Alliance KPIs
Joint Appraisal
Country
Performance
Management
Secretariat
Performance
Management
Team
Performance
Management (TPM)
Individual
Performance (PMP)
PEF Functions
Targeted country
assistance
Strategic focus
areas
PEF Performance
Management
High-Level Review
Panel (HLRP)
Grant Performance
Framework (PF)
Corporate
Performance
Management (CPM)
Focus
of update
Joint Appraisal
Country
Performance
Management
Secretariat
Performance
Management
Team
Performance
Management (TPM)
Individual
Performance (PMP)
PEF Functions
Targeted country
assistance
Strategic focus
areas
PEF Performance
Management
High-Level Review
Panel (HLRP)
Grant Performance
Framework (PF)
Corporate
Performance
Management (CPM)
Board meeting
14-15 June 2017
4. 2016–2020 INDICATORS
MISSION PROGRESS
Board meeting
14-15 June 2017
2015 2017 2018 2019 2020
TARGETS
2016
Children immunised
300 million
> 65 million
1
Future deaths averted
5-6 million
> 1.2 million
2
Under-five mortality rate
58 per 1,000
10% reduction in
rate from 2015
baseline by 2020
< 64 per 1,000
3
Future disability-adjusted life
years (DALYs) averted
250 million
> 56 million
4
Vaccines sustained after Gavi support ends
100%100%
5
Projected on track,
based on assumed
continued improvement
over last report (latest
available data shown)
On track, based on data
available year to date
Estimate as of mid-2017: 100 million
5. 2016–2020 INDICATORS
DISEASE DASHBOARD
Board meeting
14-15 June 2017
Hepatitis B
Percent of Gavi countries with low prevalence
of under-5 hepatitis
83% (5 of 6 countries)
Rotavirus
24% (25 countries)
Proportion of acute gastroenteritis hospitalisations
testing positive for rotavirus in children under 1
Measles
100%
50% (35 of 70 countries)
2015 2017 2018 2019 20202016
Percent of Gavi countries reporting fewer than
5 measles cases per million annually
Availability
of data
6. 2
3
4
5
Improve sustainability3 Shape the market4Accelerate vaccines1 Strengthen capacity2
2016–2020 INDICATORS
STRATEGY PROGRESS
1
EQUITY: GEOGRAPHIC DISTRIBUTION
2016 DATA AVAILABLE Q3 2017
EQUITY: WEALTH DISTRIBUTION
EQUITY: EDUCATION
ROUTINE IMMUNISATION COVERAGE
2016 DATA AVAILABLE Q3 2017
1
2
3
4
5
SUPPLY CHAIN PERFORMANCE
2016 DATA AVAILABLE Q3 2017
DATA QUALITY
PENTA1 COVERAGE & DROP-OUT RATE
2016 DATA AVAILABLE Q3 2017
INTEGRATED HEALTH SERVICE DELIVERY
2016 DATA AVAILABLE Q3 2017
CIVIL SOCIETY ENGAGEMENT
2
3
4
1
COUNTRY INVESTMENT IN VACCINES
2016 DATA AVAILABLE Q3 2017
COUNTRIES ON TRACK TO TRANSITION
2016 DATA AVAILABLE Q3 2017
INSTITUTIONAL CAPACITY
CO-FINANCING COMMITMENTS
2
3
4
1
VACCINE PRICE REDUCTION
VACCINE INNOVATION
HEALTHY MARKET DYNAMICS
SUPPLY SECURITY
Measles-containing vaccine 1st dose
Percentage point
Pentavalent 1st dose
Pentavalent 3rd dose
MCV1
PP
Penta1
Penta3
CURRENT: +1PP PENTA3 86%
MCV1: 83%
PENTA3: 81%
MCV1: 78%
2015 VALUE 2020 TARGET
CURRENT: +1PP 63%31%
2015 VALUE 2020 TARGET
CURRENT: +1PP 26%16%
2015 VALUE 2020 TARGET
2020 TARGET
43%16%
2015 VALUE 2020 TARGET
36%26%
2015 VALUE 2020 TARGET
PENTA1: 91%
DROP-OUT: 3 PP
PENTA1: 87%
DROP-OUT: 6 PP
2015 VALUE 2020 TARGET
100%N/A
2015 VALUE 2020 TARGET
** Currently insufficient data to define target;
targets to be defined after provision of one full
year of PCA version 3.0 reports
1 Not published due to commercial sensitivity
35%
TARGET: 49% (2020)
30%
TARGET: 44% (2020)
49%
TARGET: 53% (2020)
100%
TARGET: 100% (2020)
9/11
TARGET: 11/11 (2020)
$19
TARGET: N/A1
3
TARGET: 10 (2020)
2/11
TARGET: 6/11 (2020)
ON TRACK
MODERATE DELAYS / CHALLENGES
SIGNIFICANT DELAYS / CHALLENGES
6
3
1
40%
TARGET: **
0%
TARGET: **PREV: 39%
PREV: 34%
PREV: 45%
75%63%
2015 VALUE 2020 TARGET
PREV: N/A
PREV: N/A
PREV: 85% PREV: 7/11
PREV: $20
PREV: 0
PREV: 1/11
BREADTH OF PROTECTION
2016 DATA AVAILABLE Q3 2017
TO BE REPORTED Q3 20178
7. SG1
Equity indicators
% of Gavi countries with: Data source
Geographic
equity
Administrative
data
>80% third dose pentavalent coverage in all districts
Wealth
equity
Surveys≤10% point difference in coverage between richest
and poorest quintile
Gender
equity
Surveys≤10% point difference in coverage between children of
mothers with no education vs secondary/higher education
• Limited number and timing of surveys available
• Quality of data
• Thresholds can mask important developmentsChallenges
MODERATE
CHALLENGES
Board meeting
14-15 June 2017
8. SG1
Alliance work on equity
Equity mainstreamed in grant processes - key points:
• Where are the under-immunised children?
• What are the barriers to immunisation?
• How can Gavi support?
Improving sub-national data:
• Sub-national administrative coverage for PEF priority
countries reported this year
• First reporting of sub-national data through joint
reporting form
• Support to triangulation of sources at sub-national
level to strengthen decision-making
Coverage with the third
dose of pentavalent
vaccine, 2016
0 –
49%
50 –
79%
>=
80%
Municipal level
ANGOLA
Board meeting
14-15 June 2017
10. SG1
Target of 50 introductions in 2017
Board meeting
14-15 June 2017
49
71
45 24
68
27
2020
72
2015
139
2014
59
10 ~35
2019
~40
2018
~80
2017
51
14
2016
Forthcoming/
projected
Completed
Gap to projection
Introductions as of 12 June 2017
MODERATE
CHALLENGES
At risk
(13)
Target:
50
11. 14 introductions in 2017 – majority are campaigns
Since January 2017:
5 routine introductions
9 campaigns/demos
Bolivia
HPV
Lesotho
Measles-rubella
Burundi
Measles-rubella
Uganda
Meningitis A
Ethiopia
Measles
CAR
Meningitis A
Côte d’Ivoire
Rotavirus
Burkina Faso
Meningitis A
Mali
Meningitis A
Meningitis A Cambodia
HPV
Measles-rubella
India
Measles-
rubella
Pneumococcal
12. SG2
Grant performance frameworks: long-term vision
✓ Completed/ongoing
All countries have
grant performance
frameworks (GPFs)
80% of countries
meet reporting
requirement
Compliance
Joint appraisals
Target: all 2017
joint appraisals
use GPF analyses
High-level review
panels
Programmatic &
financial
performance analysis
Use
Focus on improving
quality
Refine guidance,
particularly for HSS
metrics
In progress
Quality
Analyses &
visualisation
Results & learning
to inform 2021-2025
strategy
Planned
Learning
Board meeting
14-15 June 2017
13. SG2
Using grant data to inform our strategy: Niger
Examining
data
Bringing together
and reallocating grants
Monitoring
Incorporating
new data
Underimmunised
children
concentrated in
urban and a few
rural areas
Reinforcing outreach
and mobile services
in rural areas
Some HSS funds
reallocated towards
underimmunised
children in urban
areas
PEF technical
support to ensure
robust 2017
coverage survey
% surviving infants
receiving 3rd dose
pentavalent vaccine
through each of
fixed, outreach and
mobile immunisation
services
Use survey data to
map unimmunised
children by
geographic areas
Joint appraisal to
focus on challenges
with urban strategy
Board meeting
14-15 June 2017
14. SG2
Supply chain strategy: progress
Board meeting
14-15 June 2017
2020
deliverables
35 countries have
dedicated and
competent supply
chain leaders
All Gavi countries
implement comprehensive
supply chain management
plans
30-40 countries use
data to oversee
supply chain and
measure performance
40-50 countries have
improved cold chain
equipment
At least 10
countries have
done system
design
Leadership Continuous
improvement plans
Data for
management
Cold chain
equipment
System
design
On track
32/47 countries show
improvement in EVMs;
6 countries with EVMs
>80%
10 countries
started analyses;
7 countries
implementing
Applications from
42/51 eligible
countries
23 countries
started
implementation
SC leaders in 10
countries meet
competency
requirements
Current
status
15. SG3
Transitioning countries
55 50 48 47 47 43 40
21
161818 181717
2017
9
2021
12
2020
12
2019
9
2018
9
2016
5
2015
Fully Gavi-eligible
Accelerated transition
Fully self-financing
Bhutan
Honduras
Mongolia
Sri Lanka
Ukraine
4 more countries
transitioned
end 2016
Based on current projections
India
Lao PDR
Nigeria
Solomon Isl.
Ghana
Guyana
Indonesia
Kiribati
Moldova
Angola
Armenia
Azerbaijan
Bolivia
Congo Rep.
Cuba
Georgia
Timor-Leste
- Vietnam Nicaragua
PNG
Uzbekistan
Ghana
Zambia
ON TRACK
15 Board meeting
14-15 June 2017
16. SG3
Co-financing
$36m
$64m
$91m
$113m
$123m
2016201520122011
$121m
20142013
% of countries
not in arrears
94% 87% 79% 75% 85% 92%
Pending
Payments
ON TRACK
As of 31 May 2017. Countries with co-financing requirements aligned to fiscal years, with waivers
and pending reconciliation of self-procurement amounts.
16 Board meeting
14-15 June 2017
Includes US$ 34m from
Kenya and Pakistan,
only due in June
$39m
$160m$20m
Self-financed
programmes
$39m
17. SG3
Institutional capacity
Country EPI
capacity
NITAG ICC
Burundi
Cambodia
Ghana
Guinea
Malawi
Myanmar
Nepal
Niger N/a
Nigeria N/a
Togo
National immunisation technical advisory group
Interagency coordination committee
NITAG
ICC
SIGNIFICANT
CHALLENGES
New indicator, measured
through programme
capacity assessments
• 10 countries with data so far
• ~12 more expected in 2017
47% of sub-indicators
pass the threshold
17 Board meeting
14-15 June 2017
18. SG4
Market shaping
9
7
20162015
11
Markets with
sufficient &
uninterrupted supply
2015
-5%
2016
$19$20
Average price to
fully vaccinate a
child*
3
0
20162015
10
Vaccines/products
with improved
characteristics
21
20162015
11
Markets with
moderate/high
market dynamics
* with pentavalent, rotavirus
and pneumococcal vaccines
ON TRACK
18 Board meeting
14-15 June 2017
19. No target; tracking trend over time
2015 baseline; value to be updated in Q3 following
improvements to data sources to be implemented
over 2017 JA season
†
*
Partners3
1
2
3
4
5
6
7
Governance4
1
Secretariat & partners1
2
3
4
5
6
Secretariat2
1
2
3
4
5
6
1
2
3
2016–2020 INDICATORS
ALLIANCE PROGRESS
UPDATED: 25 April 2017
PARTNER GROUP
Health system strengthening
Targeted country assistance
Strategic focus area
Partners' engagement framework
Civil society organisation
HSS
TCA
SFA
PEF
CSO
ON TRACK
MODERATE DELAYS / CHALLENGES
SIGNIFICANT DELAYS / CHALLENGES
5
10
1
11.6 MONTHS
VACCINE INTRODUCTIONS
TARGET: 90% (2016)
63%
PREV: N/A
NEW VACCINE COVERAGE
TARGET: 90% (2016)
89%
PREV: N/A
MEASLES CAMPAIGN COVERAGE
TARGET: 90% (2016)
75%
PREV: N/A
SPEED OF CASH GRANT DISBURSEMENTS
TARGET: 9 MONTHS (2016)
11.6m
PREV: 13.7M
AUDITS ON TRACK
TARGET: 80% (2016)
56%
PREV: 30%
PROGRAMME FINANCE FORECAST
TARGET: +/- 10% (2016)
-18%
PREV: -11%
TARGET: 80% (2016)
PEFTCA ACTIVITIES ON TRACK
15%
PREV: 30%
DONOR ENGAGEMENT IN COUNTRY
TARGET: 100% (2016)
20%*
PREV: N/A
SECRETARIAT SUPPORT TO
GOVERNANCE
TARGET: N/A†
TO BE REPORTED AT JUNE BOARD
HSS PROPOSAL QUALITY
TARGET: N/A†
90%
PREV: N/A
HSS FUND UTILISATION
TARGET: N/A†
61%
PREV: 56%
HSS GRANT TARGETS
TARGET: 80% (2020)
45%
PREV: 31%
RISK MANAGEMENT PLAN PROGRESS
TARGET: 80% (2016)
93%
PREV: 90%
OPERATING EFFICIENCY
TARGET: N/A†
$293K
PREV: $233K
OPERATIONAL DEMAND FORECAST
TARGET: +/- 10% (2016)
-10%
PREV: N/A
CSO ENGAGEMENT
70%
TARGET: N/A
CSO
PREV: N/A
PLEDGE CONVERSION
80%
TARGET: 80% (2016)
DONORS
PREV: N/A
EVALUATION ALIGNMENT
TARGET: N/A†
DONORS
16 EVALUATIONS
PREV: N/A
COUNTRY REPORTING
TARGET: 75% (2016)
COUNTRIES
80%
PREV: 54%
BOARD ATTENDANCE
TARGET: 90% (2016)
81%
PREV: 85%
GENDER BALANCE
TARGET: 40-60% (2016)
33%
PREV: 37%
TRACKING TREND ONLY (NO TARGETS OR PERFORMANCE RANKING)6
SFA/PEF ACHIEVEMENTS
TARGET: 80% (2016)
PEF
PREV: N/A
71%
Gender balance now 36%
overall, 46% for the Board
2016 drivers of delays:
IPV, HPV, rotavirus
1 percentage
point from target
3 out of 4 countries
with surveys met target
Above target but limited
number reporting
Going down but
still above target
10/18 completed; another
6 close to completion
Caused by IPV and cash
programme delays
Nov 2016 reporting–
8 months after start
Nov 2016
reporting
Still reflects 2015
baseline from JAs
Small decrease since
last measurement
Board meeting
14-15 June 2017
Reminder for new members of role of update
Framing that we are learning what is working and what isn’t.
Reminder that update to most important Strategy Indicators is forthcoming at the end of the year
Reminder of the Alliance Accountability Framework
Mid-2017 estimate extrapolated from previous update
The Vaccine Alliance tracks five key targets to help achieve our mission: to save children's lives and protect people's health by increasing equitable use of vaccines in lower-income countries.
Figures are updated annually and cover 68 Gavi-supported countries. 2016 values will become available in Q3 2017.
Note: there was an expectation that more data would become available after the WHA resolution on hepatitis elimination in 2014 and subsequent increased attention on HepB birth dose. We have not seen that increase in data availability yet.
First introduction to the Disease Dashboard
Data on disease dashboard in its first year – trend will be analysed over the course of the strategy period as we build more data
The Alliance is also defining secondary indicators below the primary indicators that will complement the primary indicators that are based on surveillance data
Availability of data:
Measles is reported through JRF and available for most countries but data quality is variable. Data availability is consistently high for this indicator. Countries reporting <5 measles cases per million annually:
2010: 29
2011: 28
2012: 30
2013: 36
2014: data requested from WHO, pending
Rotavirus is reported through the WHO Global Rotavirus Surveillance Network. Only countries that reported for all 12 months were included – thus countries may drop out and come back in.
13 of 25 countries in the indicator had introduced Rotavirus vaccines in 2015
Hep B: data comes from WHO regional Hep B control initiatives. Only high-quality data is included in the indicator (countries with nationally representative serosurveys conducted for target population). The number of countries is currently low and it is unclear how much data availability will improve over the coming years. Countries included are those with currently strong Hep B control initiatives, so the indicator value is likely higher than the full picture in Gavi 73 countries.
The team asked to remove quality of data as:
All three (HepB, Rota, Measles) are surveillance based.
Hep B has high quality surveillance but low quantity
Rota is variable, based on sentinel sites – according to Daniella it is variable
Measles is reported through the JRF, but is surveillance data. Daniella says the data is not that bad and it would send a negative message to highlight the measles data as poor
Revisiting of indicators:
Secondary indicators will be defined for dashboard indicators, which will use surveillance and impact study data. This will aim to supplement the primary indicators and to improve data availability to some extent
The Hepatitis B indicator will be revisited as part of a broader exercise of revisiting indicators, as the global push on HepB serosurveysdid not materialise as expected. The Rotavirus indicator will be reviewed.
Blue boxes show which indicators were updated
Equity indicators addressed in following slides
Institutional capacity indicator discussed under SG3
Civil society engagement:
CSO indicator is new, like the institutional capacity indicator
It is also measured through PCAs. A country has to pass on 3 criteria:
CSO included in national plans
Budget lines are given for CSOs
Does implementation proceed against plan
The indicator is highlighted as amber due to the 40% value, but was not deemed low enough to warrant revisiting
Hence not highlighted as ones to be revisited
Reporting
Geographic equity is reported through JRFs
46 countries with surveys measuring wealth equity in the last 5 years (+2 from prior year – 6 additions, 4 dropped out)
38 countries with surveys measuring gender equity proxy in the last 5 years (maternal education) (no change – 5 additions, 5 dropped out)
Indicator issues
All indicators use a threshold. If a country improves equity, but doesn’t cross the threshold, it doesn’t show up in the indicator (e.g., if Nigeria were to decrease wealth inequity from >70% to 15%, the indicator would not change). Small changes around the threshold change the indicator, though (e.g., decrease from 12pp difference to 8pp adds one country to the indicator value)
Angola map:
The map shows administrative coverage.
Note that as the use of a lower denominator increased the 2016 coverage artificially, the 2016 map could overestimate the reality
National pentavalent 3 coverage in 2015: 64% (WHO/UNICEF estimate)
Please note – sub-national reporting is through JRF and the WUENIC methodology is being reviewed. Sub-national data was previously not reported up to global level through the JRF process.
Analyses of where under-immunised children are and barriers to immunisation takes place at JAs
Gavi support through PEF and HSIS grants
Note on equity mainstreaming:
The CEF and JA processes emphasise specific analyses on coverage and equity at country level
The JA analysis guidance gives examples of analyses to be conducted, for example coverage analyses on a region by region level
The JA template has also been adapted to focus discussions on Coverage and Equity
More Gavi-supported immunisation events in this period than ever before
Nearly half of events will be non-routine. Raises a number of questions as described in paper:
How will the Alliance ensure an integrated approach to disease control, grounded in routine immunisation strengthening and complemented by supplementary immunisation activities and outbreak response?
What shifts in operational approaches would be needed to ensure campaigns strengthen and do not detract from routine immunisation?
What new measures are needed to ensure campaigns are targeted to reach the consistently missed children and are of high quality?
How does the Alliance ensure value for money?
Significant shift in focus of immunisation events 2016-20: >80% of events are measles / MR (~100 events 2016-20), Men A (~50 events 2016-20) and HPV (~35 events 2016-20) and IPV (32 events 2016-20) vs. Penta, PCV and rota in previous periods
Note:
October Strategy Progress Update quoted approx 200 introductions in this period (estimate at that time was 235)
May paper quotes approximately 300 (latest VI estimate is 308). We quoted a figure of 300 in the paper, but if HPV MAC are excluded (i.e. are considered as one event if implement concurrently with RI introduction), the figure is closer to 270. The 271 includes:
25 MR follow-ups
20 measles follow-ups
2017:
In total 14 introductions to date in 2017 (as of 12 June)
NOTE: 2014 and 2015 projections from June 2014 Board presentation. Number of introductions from VI.
2018:
Events
HPV: 1 demo (20 MACs excluded)
JE: 1
MenA: 4 catchup, 1 other
MR: 7 catchup, 9 follow up
Routine
HPV: 17
IPV: 16
JE: 2
Measles 2nd D: 2
Men A: 4
MR 1st D: 7
MR 2nd D: 5
Rota: 4
YF: 3
Introductions as of 12 June
Note: the 80% reporting refers to the Alliance KPI 3.7, i.e. 80% of countries reported on at least 80% of due indicators at the end of 2016, which is for 2015 (due to reporting timelines).
We are making good progress vis-à-vis strengthening our understanding of results and using these to inform grant management decisions in HSS.
While 2015 focused on developing and introducing the grant performance frameworks and establishing strong reporting compliance with countries, 2016 saw analyses of these beginning to be used in joint appraisals and by the high level review panel.
We aim to further strengthen the use of data and analyses of results as part of joint appraisals this year and are working to improve the quality of grant performance frameworks, in terms of metrics, targets and analyses, going forward.
Following this years’ joint appraisals and completion of reporting on 2016 performance, we will be able to perform more informative portfolio and thematic analyses, for example reviewing performance across grant categories and trends of performance across different grant objectives on a country by country basis.
As more reporting comes in and with richer analyses being developed over time, we look forward to using these results and learning to ultimately inform our 2021-2025 Strategy.
Poor data quality affects ability to monitor progress across
Note on data sources for mapping / equity analysis:
The mapping was done based on the last coverage survey in 2013 and surveillance data.
An equity analysis is currently being conducted with a coverage survey planned in the coming weeks.
A polio assessment has recently been completed, which will be used in the next mapping of under-immunised for this year’s JA
This example of Niger shows how we are moving from situation analyses, based on available data and analyses, to inform our response and key activities, to using results and data to refine our response and ensure our support is targeted at those most in need.
Here you can see that efforts are being made to ensure we are reaching those unimmunised children in rural areas and tracking intermediate results through our grant performance framework to understand whether targets related to outreach services and mobile services (which are essential while efforts to improve fixed site service delivery are ongoing) are being met.
You can also see that we, along with our Alliance partners and country colleagues, are seeking to address concerns around the poor quality of data and using newly available data to verify our support is appropriately targeted.
Niger’s DTP3 coverage was just 65% in 2015, with inequities across wealth, gender and geography
Urban population in Niger:
According to World Bank statistics, approximately 19% of the total Niger population lives in urban areas. You should note that most of urban residents live in Niamey region (approximately 40%).
In terms of our funds going to urban, the original HSS proposal did not allocate any funds to urban areas; as part of the reallocation process, we have earmarked USD 100,000 for 2017 (out of a total budget of USD 10 million) for testing new strategies. The idea is to shape the new HSS which will come in effect in 2019.
Leadership
Based on competency framework from “People that Deliver”, a health supply chain consortium
Mid-term assessment will be conducted in late June, together with partners, at UNICEF SD
Target of 15 leaders by end 2017, 20 by end 2018
Continuous improvement plans
47 countries have 2 EVMs since 2010, of which 32 have increased their score
6 countries have a composite score higher than 80%
2015 EVMs completed: 20
2016 EVMs completed: 6
2017 EVMs planned: 8
2018 EVMs planned: 10
Description of Accelerating arrows:
Leadership : training of supply chain leaders has accelerated in 2016, for example through implementation of e-learning modules (>500 users trained) and STEP training. STEP training will further accelerate in 2017 with integration off an HR module in EVM (STEP: 45 persons trained in 2016, 100 planned for 2017)
Data for management: 2017 is a stock-taking year , identifying how to accelerate the implementation, e.g., standardisation of LMIS systems, remote temperature monitoring with Google and Nexleaf of data for management interventions with UNICEF
CCEOP: processes have been mapped. This is now accelerating implementation and, e.g., by shortening procurement timelines
System design: the number of countries implementing interventions has increased from 2016 to 2017. We anticipate further acceleration in 2017.
Data for management
The goal for 2020 for Data for Management is 30-40 countries use data to oversee and manage key aspects of their immunisation supply chain. 23 countries have initiated the work under D4M, which means using data to increase supply chain visibility
DISC (Data Indicators for Supply Chain) have been developed and are starting to be integrated into Grant Performance Frameworks in 2017:
Closed vial wastage
Forecasted demand ratio
Full stock availability
Functional status of cold chain equipment
On-time and in-full delivery
Stocked according to plan
Temperature Alarm Rate
Cold chain equipment
To date, 24 countries have submitted applications for support and 18 countries are approved or recommended for approval (Haiti, DRC, Uganda, Cameroon, Kenya, Niger, Madagascar, Pakistan, South Sudan, Uzbekistan, Guinea, Liberia, Malawi, Togo, Sierra Leone, Djibouti, Kyrgyzstan, Vietnam)
The CCEOP targets 55 countries and 51 of those are the ones we are targeting as the remaining 4 are in their accelerated transition phase countries with at least 2 full years from date of review by IRC prior to becoming fully self-financing.
System redesign
For System Design implementations, there is no simple answer. However, for countries where implementation has started, the supply chain network looks completely different from the original one. Couple of examples below:
Nigeria is removing the LGA level to deliver direct from the State to the HF’s from strategically placed regional warehouses. This has created more efficiency and responsiveness to HF needs. They’ve rolled out this new supply chain with an outsourcing partner that is managing the order, stock, and distribution. They are in the process of analyzing national level changes in response to national level storage capacity constraints.
Senegal’s NMS, in close collaboration of IntraHealth, is implementing and starting scale-up of an Informed Push Model (IPM) distribution systems that bring brings >50 essential medicines to health centres by using private sector to distribute from district level. Discussions are pending inclusion of vaccines
DRC is being driven from the Province, while there has already been separate redesign at the national level, but the national redesign (done in the past) would benefit from the learnings at the provincial level. This is an interesting story because they are eliminating most of the District stores to go directly to the HF’s, but they are keeping some existing District warehouses, where optimal, to store goods across HF’s for resiliency. Further, they are using the system design analysis to inform the placement of the cold chain equipment procured in the CCE OP.
Benin is scaling up a new distribution system which consolidates multiple commune stores into one heath zone store in charge of collecting vaccines from the department store and distributing them to each of the health facilities on a monthly basis.
Notes on Ghana and Zambia:
Zambia no longer projected to transition in this strategy period because of GNI changes
Ghana – situation is different: could become eligible again, due to GNI changes, but not certain, situation needs to be monitored
HSS no cost extensions:
Existing – 2 countries
Honduras: final year was 2015, HSS through 2016; info on final implementation of grant pending; potential final PBF payment in 2017
Timor Leste: final year 2017, HSS through 2018, potential final PBF in 2019
Potential – 2 countries
Bolivia: final year 2017, HSS ending 2017, potential PBF payment in 2018
Congo Rep: final year 2017, HSS ending 2017, potential PBF payment in 2018
Catalytic vaccine support to countries after transition:
MR (3)
Indonesia
Congo Rep.
Angola
HPV (8)
National (4)
Sri Lanka
Honduras
Guyana
Bolivia
Demo (4)
Moldova
Armenia
Georgia
Indonesia
Note: the 160 million in 2016 is based on the amounts communicated in decision letters.
2016: The difference is due to the alignment to fiscal years of Kenya and Pakistan (July-June), waivers and final reconciliation of procurement with actual amounts, including self procurement.
Note: projections from EO dashboard on co-payments
2017: $163m co-payments + $72m fully self financing
2018: $169m + $89m
2019: $228m + $109m
2020: 249m + $132m
Total: $935m (incl 2016) + $402m FSF (excl 2016)
Note: information on lower co-financing than investment case shared in Dec 2016 through financial forecast, drivers include lower vaccine prices and delays in introductions. Co-financing picture will continue evolve in line with financial forecasts.
Notes:
Indicator currently stands at 0% of countries
For a country to “pass”, it has to meet the thresholds on all three areas (EPI, NITAG, ICC)
The thresholds are:
EPI capacity: 10 of 12 questions in PCA tool on EPI capacity score at least 3 of 5
NITAG: PCA question assessed with a score of at least 3 of 5
ICC: PCA question assessed with a score of at least 3 of 5
In addition to the 10 countries that have data, another 19 countries should be going through the process in 2017, increasing the data set
Questions on EPI capacity:
2.1.1: The goals and mandates of the EPI team are clearly defined and appropriate for achieving the objectives of the immunization programme and the broader health system.
2.1.2: The reporting line of the EPI team to MoH leadership supports the team’s ability to carry out its mandates.
2.1.3: The EPI team is able to influence its own staffing policies and staffing decisions taken.
2.1.4: The EPI team is able to influence its own budget.
2.1.5: The EPI senior management is well acquainted with the relevance of operational planning, timely grant implementation, and monitoring of implementation.
2.2.1: The current organizational structure of the EPI team is well designed to support its mandates.
2.2.2: Each position on the EPI team has clearly defined and appropriate roles and responsibilities
2.2.3: The recruitment and retention of the EPI manager and other staff are effective.
2.2.4: There are clear, relevant and effective linkages between the national EPI team and sub-national level leaders and teams relevant for EPI.
2.3.1: The EPI team has adequate number of staff for managerial and technical functions to deliver on the programme.
2.3.2: The team (not necessarily any specific individual) has adequate managerial and technical competencies to deliver on the programme.
2.3.3: The team has adequate tools and processes to deliver on the proposed programme.
1.1: Introductions
Drivers of delays: IPV introductions (14), HPV (3), Rota (4)
1.2: new vaccine coverage
Very close to target (89% vs 90% target)
The definition for Alliance KPI 1.2 was clarified to better reflect methodology: the indicator tracks the number of new routine vaccines (PCV, Rota, and MCV2) reaching 90% of reference vaccine (Pentavalent for PCV/Rota and MCV1 for MCV2) within a benchmark time following year of launch
1.3: campaign coverage:
Gambia, Zambia, Kenya met
Nigeria had coverage below and uneven
There were additional countries where surveys were not yet available
1.4: approvals on first submission
High number in 2015, will have to revisit how we measure this as we work more through the CEF
1.5: HSS fund utilisation
This data still reflects the last year of the previous strategy period, due to country reporting timelines
1.6: HSS intermediary targets
Big increase from 7% in 2014 and above target, but we had a limited number of countries reporting (33 countries). We are addressing this by making reporting a stricter requirement for renewals
2.1: speed of cash grant disbursement
Baseline was corrected from 11.3 to 13.7m, when using exact dates
Previous baseline used an approximation of dates
Trend is down, but still above target of 9 months. Links to trade-off between time to disburse and risk management
The target is 9 months, so the bar was designed to only show the excess over 9 months (similar to the operational forecast showing the deviation from the target)
2.2: audits on track
10 of 18 items were completed (3 of 8 internal audits, 7 of 10 programme audits). Another 6 (3 internal, 3 prog) audits were close to completion, but not finished in 2016
This first year has been a learning period for the team to to refine the planning of audit timelines
2.4: Operating efficiency
Measured as Secretariat cost per programme, and is affected by countries transitioning out and a changing number of programmes. We don’t have a target for this indicator and have begun tracking it
2.6: programme finance forecast
Caused by IPV and cash programme delays. Also, December supplier pre-payments were moved to January 2017, versus forecasted December 2016
3.1: TCA activities
3 of 20 PEF countries reported more than 80% of TCA milestones completed
Reporting was in Nov, after a start in March (8 months), which contextualises the reporting figure. Overall, we saw an increasing % of TCA milestones completed, but not crossing the threshold
3.2: PEF Functions
This is from Nov 2016 reporting, as partners report on PEF Functions once a year. PEF Function reporting is new and is gathering momentum. We will continue to observe the evolution.
3.3: CSO engagement
Indicator tracks if CSOs are integrated into national plans (sub-indicator of CSO Strategy indicator)
3.5 : donor engagement
This still reflects the 2015 baseline. Donor engagement will be tracked through JAs and updated after this year’s round of JAs.
3.6: Evaluation alignment
Gavi conducted 16 reviews, audits and evaluations requested by five sovereign donors (including the Multilateral Organization Performance Assessment Network (MOPAN) and one private sector donor; these reviews include those outside of regular grant processes as well as those required as part of the regular granting process
4.1: Board attendance
Measures attendance of the Board and Board Committees. Small decrease since last measurement, below 90% target
Although overall attendance is good, developing country attendance is more variable, with average attendance of under 60% since beginning of 2014. Board guidance on what more we can do to support greater engagement of developing countries would be welcome.
June 17: 60%
April 17: 50%
Dec 16: 40%
4.2: Gender balance
* Measures the gender balance on Board and Board Committees. Should be between 40 – 60% of either gender. Small improvement since December. Board alone falls within the target range, but not with committees.