Download as PDF, PPTX
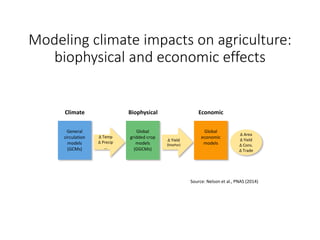
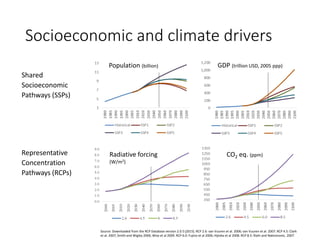
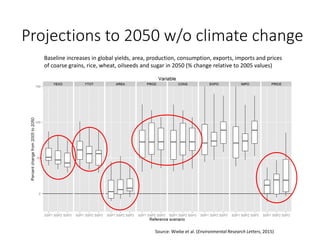
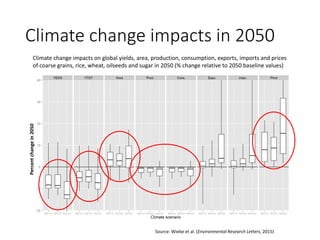
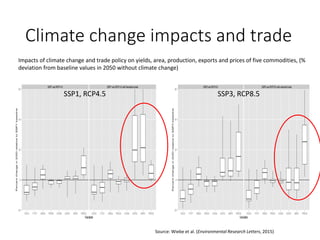
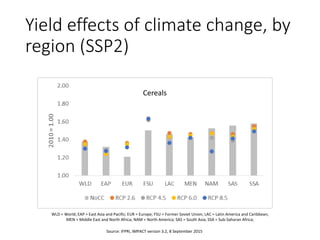
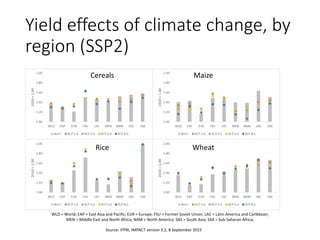
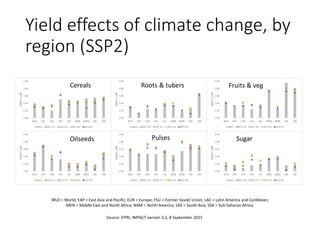
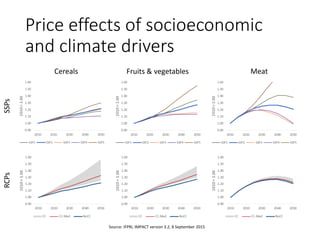
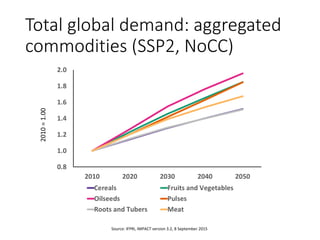
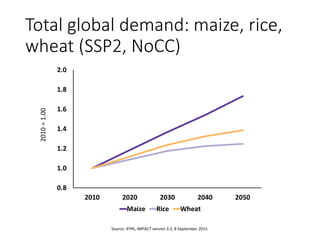
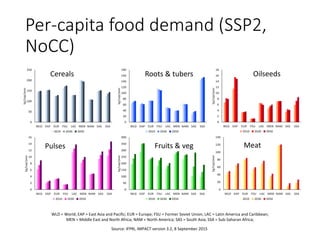
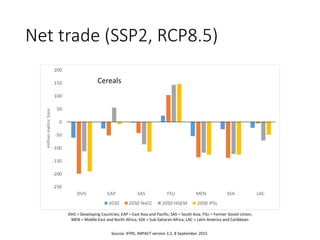
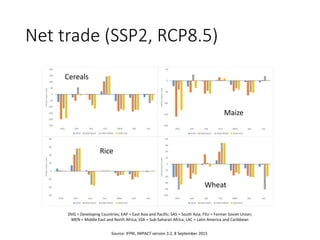
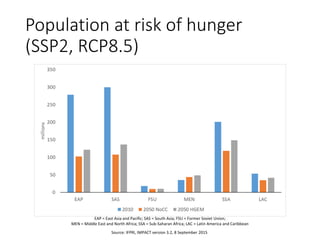
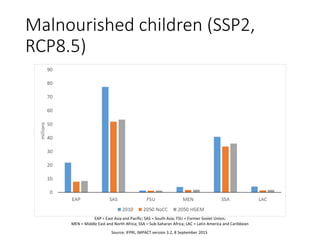
The document summarizes projections from the International Food Policy Research Institute (IFPRI), Global Futures and Strategic Foresight (GFSF), and Agricultural Model Intercomparison and Improvement Project (AgMIP) regarding the impacts of climate change and socioeconomic factors on agriculture. It presents results from global economic models that project changes in crop yields, area, production, consumption, trade and prices for various commodities by 2050 under different climate and socioeconomic scenarios. It finds that climate change is expected to negatively impact yields in many regions, though impacts vary significantly by crop and location. Trade patterns and food security indicators like malnutrition are also projected to be impacted.