This report will highlight the corporate share repurchases for US Corporations for the last 16 calendar quarters. Included are S&P 500 firms along with another 1500+.
Stock repurchase programs analyzed over the last 21 quarters. Data included for as many US firms as possible. Result set is greater than the S&P500 or the Russell 1000.
The document describes the CAN SLIM approach for screening growth stocks developed by William O'Neil based on his study of past market winners. The approach focuses on companies exhibiting strong quarterly and annual earnings growth, high relative price strength, and institutional sponsorship. The document outlines the specific criteria for each component of CAN SLIM (C-Current Quarterly Earnings, A-Annual Earnings, etc.) and provides an example screen applying the approach which identifies 4 stocks passing all the filters.
Impact of real earnings management on firms performanceAhmed Selim
Earnings management refers to practices used by company managers to misrepresent financial performance or alter reported income. There are several motives for and techniques of earnings management, including income smoothing and using discretionary estimates to manipulate reported earnings. Earnings management can be done through accrual manipulation or real activities manipulation like reducing discretionary expenses or timing asset sales. While some studies find earnings management can positively impact short-term measures like stock price, most research shows it adversely affects long-term financial performance indicators like return on assets. Case studies on companies like GE and Samsung provide examples of earnings management techniques.
This document contains a practice exam for a corporate finance course. It includes 25 multiple choice questions covering various corporate finance topics such as goals of the firm, forms of business organization, analysis of financial statements, valuation, capital budgeting, risk and rates of return. The questions require calculations and analysis to determine the best answer from the options provided.
The document discusses various financial ratios used to analyze the financial performance of Atlas Honda, including liquidity, activity, debt, profitability, and market ratios. Many of Atlas Honda's ratios have improved over the past five years, such as current ratio, inventory turnover, asset turnover, times interest earned, net profit margin, return on assets, and return on equity. However, some ratios like quick ratio and debt ratio were still below target levels. Overall, the analysis indicates that Atlas Honda has generally strengthened its financial position in recent years through better working capital management and an increased focus on reducing debt.
- The company reported first quarter 2018 earnings with orders up 10% year-over-year and net sales up 26% year-over-year. Adjusted EBITDA improved by over 400 basis points year-over-year.
- Guidance for 2018 was updated with revenue expected between $1.775 billion to $1.850 billion and adjusted EBITDA between $100 million to $120 million.
- Strategic priorities include expanding product innovation, improving manufacturing productivity through optimization projects, and focusing on operational excellence and growth in key markets.
- Watts Water Technologies held an earnings conference call to discuss its 4Q and FY 2016 results.
- In 4Q 2016, sales decreased 5% to $342.0 million due to unfavorable foreign exchange and the exit of undifferentiated products, while operating profit increased 5% to $37.2 million from productivity gains and restructuring savings.
- For FY 2016, the company achieved record operating margin of 11.4% and EPS of $2.67, up 130 bps and 11% respectively, through transformation initiatives and the PVI acquisition.
This document discusses investment centers and methods for measuring assets employed and business unit performance. An investment center compares profit to the assets used to generate that profit. Measuring assets employed and return on investment (ROI) provides information for decision making and motivates managers. ROI is profit divided by assets employed. Economic value added (EVA) measures wealth creation by subtracting a capital charge from net operating profit after taxes. EVA attempts to capture true economic profit by considering the cost of capital.
Fiscal Year Ended March 2018 (FY2017) Financial Results BriefingRicohLease
This document summarizes Ricoh Leasing Company's financial results for the fiscal year ended March 2018. While net sales reached a record high of 304 billion yen, operating profit fell short of plans due to higher-than-expected bad debt expenses. The leasing and installment sales business saw increased transaction volumes but lower profits, while the financial services segment grew revenues and profits. Total assets also reached a record high of over 8.5 trillion yen.
The document discusses various issues related to acquisition valuation, including considering synergy and control premium. It outlines 5 steps for an acquisition valuation: 1) establish acquisition motive, 2) choose target, 3) value target with motive, 4) decide on payment method, 5) choose accounting method. Synergy can come from cost savings, growth opportunities, or tax/debt benefits. Control premium reflects additional value from improving management.
Ratios and formulas are important analytical tools for evaluating a company's financial statements. Ratio analysis involves calculating relationships between financial data to assess aspects of a company's operations, such as liquidity, profitability, leverage, efficiency and creditworthiness. Common financial ratios are grouped into categories like liquidity ratios, which measure ability to meet current obligations, and profitability ratios, which evaluate expenses and returns. A standard list of ratios does not exist, as analysts choose those most relevant and understandable for the situation.
Laying Down the Groundwork for Financial Stability for Architecture & Enginee...Citrin Cooperman
Brought to you by Citrin Cooperman's Architecture & Engineering Practice, leaders from Citrin Cooperman, Smith Brothers, and Updike, Kelly & Spellacey, PC discuss critical tax and contract issues that A&E industry leaders should know.
Growth is a critical success factor for any business. Growth of a business can be measured in terms of growth in revenue, profits, asset base or any other important item. However, too rapid growth can be a strain on the entity’s resources and too slow growth can depict lack of competitiveness and issues in survival. Copy the link given below and paste it in new browser window to get more information on Sustainable Growth Rate:- http://www.transtutors.com/homework-help/corporate-finance/financial-planning-models/pro-forma-statements/external-financing-growth/sustainable-growth-rate/
Common size statements normalize financial data to allow for easier comparison across companies and time periods. They express balance sheet items as a percentage of total assets and income statement items as a percentage of sales. Comparing the common size statements of Companies A, B, and C shows that while Company A has the smallest sales, it has the highest net income ratio at 18%. Company C has the lowest cost of goods sold ratio, indicating it has been able to lower production costs through higher R&D spending than Company B. The effective tax rate for all three companies is 40%, providing a more meaningful comparison than the common size tax expense percentages alone.
The document discusses various financial ratios used to analyze the profitability and efficiency of Atlas Battery Company over the past 5 years. It analyzes ratios such as gross profit ratio, operating ratio, net profit margin, return on equity, current ratio, inventory turnover, and cash conversion cycle. Most of the ratios for Atlas Battery have remained steady over the past 5 years, however some like operating ratio and net profit margin are not as high as they could be, indicating room for improved expense management and increased profits. The overall financial position of Atlas Battery appears stable based on favorable ratios such as return on equity, current ratio, and cash conversion cycle.
Internal Growth Rate (IGR) is the maximum growth rate that a company can realize without taking into account financing or funds or external sources. Copy the link given below and paste it in new browser window to get more information on Internal Growth Rate:- http://www.transtutors.com/homework-help/corporate-finance/financial-planning-models/pro-forma-statements/external-financing-growth/internal-growth-rate/
This document provides an analysis of various financial ratios for a company over two years. It begins with an introduction to ratio analysis and its importance. It then calculates and interprets various ratios including current ratio, debt to equity ratio, net profit margin, gross profit margin, inventory turnover, debtors turnover, creditors turnover and return on capital employed. The analysis found that the current ratio and return on capital employed increased slightly but debt to equity ratio also increased, indicating less financial stability. Profit margins were low. Inventory turnover and creditors turnover decreased. The conclusion recommends the company improve utilization of assets, pricing strategies and timely payment of creditors.
The document discusses valuation techniques for businesses and analysis of company financials. It provides examples of how to calculate the value of a business based on earnings, dividends, or required rate of return. It also outlines key areas to analyze for a company including products, markets, competitors, and impact of news/developments. Financial statement analysis techniques are presented for revenue, costs, balance sheet ratios, and interpreting what ratios indicate.
Management Techniques to Increase the Bottom-lineCavendish
This document discusses various management techniques that can help directors and managers improve efficiency and effectiveness. It describes techniques like profitability analysis, ratio analysis, and productivity ratios that systematically analyze financial data. While techniques provide objective analysis, good judgment is also needed. The document recommends an interactive software to help business owners better understand key financial concepts and indicators to make better decisions.
- Mr. Braganza, the CEO of Bright Star Ltd, is shocked to see the company reported a loss for the fiscal year despite achieving record sales growth. Sales increased 25% over the previous year, but costs increased substantially leading to a net loss.
- The CFO Jacob finalized the audited annual financial statements showing a loss of Rs. 188 million compared to a Rs. 500 million profit the previous year.
- Braganza asks Jacob to recheck the numbers, as the loss does not align with the strong sales performance. Jacob and his team will work overnight to conduct control checks and identify any incorrect cost postings.
The six critical reports every company must haveAdrián Chiogna
This document discusses 6 critical reports that every company should have:
1. Whale curves visualize internal profits and identify profit drains preventing peak performance.
2. NBC (Net Before Compensation) rankings focus the company on the greatest profit contributors and detractors.
3. 5x5 reports help focus activities on the 5 most critical accounts in the 5 most important groups for each territory.
4. Account margin target reports use each account's cost structure to guide sales to profit gains.
5. Comparative P&L reports segment the business to quickly evaluate profit potential and identify issues.
6. Profit delta reports show changes in NBC to take action reducing losses and protecting/growing
The document analyzes the financial performance of a company from 2007-2009 using various ratios. It finds that while liquidity improved, solvency and profitability declined over this period. Specifically, debt levels increased, credit and inventory management worsened, and returns on assets and equity decreased. Overall, the analysis concludes the company's financial state was better in 2007 than 2009.
Samir Radi is a Jordanian national seeking a new position. He has 7 years of experience as a Senior Accountant in Dubai, where he managed financial functions including accounting, budgeting, and internal controls. Radi has a degree in Accounting and Finance and is pursuing the CMA certification. He believes his academic and professional experience would make him a valuable asset for a new organization.
This document outlines inspection procedures for various stages of garment production including fabric inspection, sewing inspections, washing processes, finishing inspections and packaging inspections. It recommends inspection levels and sample sizes at each stage to check for quality, safety and compliance. Random sampling is recommended at multiple points to verify shipping marks, cartons, materials, workmanship, washing effects and measurements.
This document analyzes the mise-en-scène, setting, and conflict in the film "An Adventure in Space and Time". Costumes, props, and lighting are used to emphasize the 1960s era. The setting of the television studio is established through shots of old cameras and monitors. The conflict arises from the sexism Verity Lambert faces as the BBC's first female producer, as the two male characters brush her off until realizing she is the producer. Shots are used to show the opposing views between the men and Verity.
This document contains the resume of Minimol Denison summarizing their work experience and qualifications. Denison has over 10 years of experience in customer service roles for various companies in India and the UAE. They currently work as a Telesales and Sales Coordinator for Value Manage in the UAE, helping to generate new leads and increase revenue. Denison has received several awards and achievements over their career for performance, including Best Newbie and Star of the Quarter awards. They seek a challenging position to practice their skills and experience.
The document discusses microservices and continuous delivery. It defines microservices as loosely coupled services with bounded contexts. Microservices enable continuous delivery by allowing capabilities to be decoupled and changed independently. This reduces risk and allows faster delivery of value. While microservices provide benefits, they also introduce operational complexity. A platform is needed to manage the provisioning, deployment, scaling, failover and monitoring of microservices. The document provides examples of how Pivotal Cloud Foundry and Spring Cloud can act as a platform for microservices and continuous delivery.
Kia Green is seeking a full or part time job in a professional office setting. She has a high school diploma and some college education. Her relevant work experience includes stocking and providing customer service at Shoe Palace, clerical duties such as filing and phone answering at Making Waves Education Program, stocking shelves and cashier work at Foods Co, and volunteer work assisting with voting polls and coastal cleanups. Her skills include organization, communication, time management, teamwork, Microsoft Office, and listening skills.
Flourish Apartment For Sale - UCHK Consulting LtdScott Talbot
This document provides information about Flourish Parkside, a new residential development located in Parkville, an inner-city suburb of Melbourne, Australia. Flourish Parkside will include one and two bedroom apartments located near Royal Park, a large inner-city park. Residents will have access to amenities like The Park Club, which includes a pool, gym, and outdoor recreational areas. The development aims to provide modern inner-city living while being located near parks, public transportation, educational institutions, and other neighborhood attractions.
This short document promotes the creation of presentations using Haiku Deck, a tool for making slideshows. It includes a stock photo and captions encouraging the reader to get started making their own Haiku Deck presentation. In just a few words, it pitches the idea of easily creating slideshows to share on SlideShare.
This presentation summarizes Internap's 3rd quarter 2016 earnings results. Revenue declined year-over-year primarily due to lower IP connectivity pricing and customer churn. The company reported a large net loss that included a non-cash goodwill impairment charge. Looking forward, the new CEO plans to improve operations, cut costs, and explore ways to recapitalize the business in order to focus on growth. Financial guidance for 2016 was reaffirmed with some minor adjustments to revenue and adjusted EBITDA expectations.
This document provides an overview of financial statement analysis techniques including horizontal analysis, vertical analysis, and calculating various financial ratios. It defines key terms, outlines objectives and limitations of financial statement analysis, and provides formulas and explanations for various liquidity, activity, solvency, profitability, and market-test ratios. Examples and exercises are also included to demonstrate applying these techniques.
This document provides guidance on analyzing financial statements and valuations for entrepreneurship boot camps. It discusses analyzing ratios, cash flows, forecasts, and valuations. Key valuation methods covered include comparable market multiples, discounted cash flow analysis and the venture capital method. Adjustments like normalization of earnings and discounts for lack of control and marketability are also summarized.
iRobot anticipates generating $38M in retained earnings in 2015 by increasing revenue to $606M through new strategies while reducing days in inventory and maintaining costs. It is recommended that $30.6M (80%) of the surplus be used to develop a new Scooba floor cleaning product, estimated to deliver $58.7M in value over 5 years. New product innovation is critical for iRobot to maintain its competitive position against increasing competition in the home robot market.
Calcbench takes all 3rd Quarter filings and does a year over year comparison of 11 commonly used metrics. Only industrial firms are analyzed (i.e. Financial firms are excluded)
- Third quarter earnings results presentation from Masco Corporation dated October 27, 2015
- Sales increased 4% excluding foreign currency effects, with North American sales up 3% and international up 4%
- Improved demand, operating leverage, cost control and cost productivity drove profit margin expansion and earnings growth despite currency headwinds
- All business segments showed strong profitability with margins expanding across most segments
This document provides an overview of key financial indicators and metrics that can be used to monitor the financial performance and stability of architecture and engineering (A&E) firms. It discusses metrics such as utilization rate, net effective labor multiplier, total payroll multiplier, overhead rate, and net revenue per employee. Benchmark goals are provided for each metric. Additionally, the document summarizes tax deductions and credits that may benefit A&E firms, such as the domestic production activities deduction, flow through business tax deduction, research and development tax credit, and energy efficient commercial buildings deduction.
Analysis & Interpretation of RA- Liquidity Ratio.pptxtharanya9
Financial statement analysis and interpretation is the process of analyzing a company's financial statements to assess its performance and financial position. It involves calculating various financial ratios to evaluate aspects like liquidity, profitability, and debt. The document then provides details on liquidity ratios like current ratio, quick ratio, and cash ratio, explaining their calculation and importance. It also defines profitability ratios like gross profit ratio and net profit ratio, and how they are used to analyze a company's earning capacity. Finally, it shares Microsoft's financial ratios for liquidity and profitability from 2017-2020 from its income statement, balance sheet, and calculated financial ratios.
Adventures in Business Analytics – Optimization and the Organization Garry, s...Tin Ho
Adventures in Business
Analytics – Optimization
and the Organization
Steve Garry
Marketing Optimization and the Organization
November 2014
Generating Better Business
Results Through Analytics
The document provides an earnings presentation for Myers Industries for the second quarter of 2015. It summarizes financial results including a 7.6% increase in net sales driven by an acquisition and new product sales, though partially offset by decreased sales in some end markets. It also reports increases in gross profit margin and decreases in SG&A expenses. The presentation discusses segment level results, provides guidance for the full year 2015, and includes appendices with financial summaries and reconciliations as well as market indicators for relevant industries.
This document presents a case study on Silver River Manufacturing Company. It includes an introduction to the company and issues it is facing. Financial statements and ratios for 2018-2020 are analyzed. Key issues identified are declining sales and poor financial ratios. The DuPont analysis and Altman Z-score are calculated to further assess the company's financial strength and weaknesses. Projections for 2021-2022 income statements are also provided.
This document provides an overview of financial statement analysis. It discusses the objectives of ratio analysis, which involves calculating ratios to analyze a company's profitability, liquidity, asset management, financial leverage, and investor returns. Specific profitability, liquidity, and leverage ratios are defined. The document also covers cash flow analysis, interpreting ratio results, drivers of profitability and growth, and the importance of considering both financial and non-financial accounting information in analysis.
- Third quarter financial results for Hillenbrand, a global diversified industrial company, showed revenue declining 4% to $399 million but increasing 3% on a constant currency basis driven by higher volume in both business segments.
- Adjusted earnings per share decreased 10% to $0.52 per diluted share while adjusted EBITDA declined 6% and operating cash flow was $76 million through the first three quarters.
- The Process Equipment Group saw a 4% constant currency revenue increase and a 110 basis point expansion in adjusted EBITDA margin, while Batesville had a 2% revenue increase but a 120 basis point decline in adjusted gross margin.
The document discusses leveraging industry benchmark data to optimize finance shared services. It notes that top benchmark performers deliver services at 46% lower cost with 52% fewer FTEs than lower performers. A webinar on the topic is scheduled for October 21st from 12-1pm EST. Common KPIs for benchmarking finance functions include number of FTEs, month-end cycle time, invoices processed per FTE, and total cost per process. Benchmarking can identify opportunities such as a company that had 110 FTEs but benchmarks showed only 49 were needed. Intelligent automation and outsourcing are options for optimizing non-core transactional functions.
The document appears to be a multiple choice exam covering various topics in finance and accounting, including financial statements, cost behavior, capital structure, valuation, budgeting, and analysis. It contains 40 multiple choice questions testing understanding of concepts such as the balance sheet, fixed and variable costs, net present value, cash flow analysis, and accounting principles.
Sheet1NPV and IRR TemplateAssumptions & inputsrequired rate of re.docxmaoanderton
Sheet1NPV and IRR TemplateAssumptions & inputs:required rate of return20.0%InvestmentYear 1year 2year 3$ (110,000.0)$ 51,781.00$ 51,780.00$ 71,780.00discount factor1.201.441.73Present values$ 43,150.8$ 35,958.3$ 41,539.4Total present value$ 120,648.5NPV$ 10,648.5IRR25.8%
Sheet2
Sheet3
Captain Walter J. Harris, JR.
Captain Harris provided us with a very inspirational and full of enthusiasm speech. He shared his personal experiences from his early life. Being able to see first-hand how a person talks about his ambitions and success in life is very inspiring. Captain Harris share how he started out as a pilot on a transport plane, to finally flying passenger planes and even flying intercontinental flights. One suggestion that Captain Harris offered to us younger people is to not be complacent and careless. Having a goal to work towards, we should not get distracted by other things. Focusing on the set goal will get us to the end and will help achieve the goal. Four other suggestions were made. Choosing the right friends can help determine if we will be successful in our career or if we will fail and get pulled down and away from our career. If we have set goals, we will be able to stay on the right track while staying away from distractions. This also goes hand in hand with Captain Harris’s other suggestion. We need to stay out of trouble. A criminal record can keep us away from the dream job that we might be trying to reach and get. Once we are on our way to achieve our goal, stopping and checking the direction is important. If we are still on our way to get to it, then we should continue. Now if we have strayed from the straight path then stop, evaluate and get back on the right track. The most important suggestion that Captain Harris had was to have a plan for our life. Time does not wait and will not stop for us to make a pit stop. It keeps going and we could lose a chance of a lifetime by stopping midway.
Sheet1NPV and IRR Template_ five yearsAssumptions & inputs:required rate of return9.0%InvestmentYear 1year 2year 3year 4year 5$ (100,000.0)$ 25,000.00$ 25,000.00$ 25,000.00$ 25,000.00$ 25,000.00discount factor1.091.191.301.411.54Present values$ 22,935.8$ 21,042.0$ 19,304.6$ 17,710.6$ 16,248.3Total present value$ 97,241.3NPV$ (2,758.7)IRR7.9%
Sheet2
Sheet3
Sheet1Free Cash Flow Forecast TemplateAppl Inc.(billions of dollars)2015201620172018Sales$233.7$252.4$272.6$294.4% increase8.0%EBIT71.2Depreciation11.2EBITDA82.489.897.9106.7% increase9.0%Tax Expenses19.120.822.724.7% increase9.0%Operating Cash flow63.369.075.282.0Capex11.212.012.813.7% increase7.0%YoY increse in w/capital44.34.75.0% increase8.0%Levered Free cash flow$48.10$52.69$57.72$63.22growth rate9.55%9.54%9.53%
Sheet1Discount free cash flow modelApple Inc.Date:2/24/16assumptions:3-year growth rate9.55%discount rate (wacc)10.0%discount factor1.101.211.332015201620172018terminal valuefree cash flow$ 48.1$ 52.70$ 57.70$ 63.20$ .
DuPont reported its second quarter 2014 earnings. Key points include:
- Overall sales were down 1% due to lower corn seed volumes and currency impacts, while operating earnings were down 5%.
- Several business segments saw earnings gains from higher volumes and margins, including Nutrition & Health (+72%), Industrial Biosciences (+37%), and Safety & Protection (+22%).
- Performance Materials earnings declined 9% due to a scheduled facility outage. Agriculture earnings fell 11% on lower corn seed volumes.
- The company reaffirmed its full-year operating EPS outlook of $4.00-$4.10 per share and discussed ongoing redesign initiatives and the planned Performance Chemicals spin-off.
Similar to Stock Repurchases aka Share Buybacks for US Firms (20)
5 Tips for Creating Standard Financial ReportsEasyReports
Well-crafted financial reports serve as vital tools for decision-making and transparency within an organization. By following the undermentioned tips, you can create standardized financial reports that effectively communicate your company's financial health and performance to stakeholders.
1. Elemental Economics - Introduction to mining.pdfNeal Brewster
After this first you should: Understand the nature of mining; have an awareness of the industry’s boundaries, corporate structure and size; appreciation the complex motivations and objectives of the industries’ various participants; know how mineral reserves are defined and estimated, and how they evolve over time.
Seminar: Gender Board Diversity through Ownership NetworksGRAPE
Seminar on gender diversity spillovers through ownership networks at FAME|GRAPE. Presenting novel research. Studies in economics and management using econometrics methods.
Vicinity Jobs’ data includes more than three million 2023 OJPs and thousands of skills. Most skills appear in less than 0.02% of job postings, so most postings rely on a small subset of commonly used terms, like teamwork.
Laura Adkins-Hackett, Economist, LMIC, and Sukriti Trehan, Data Scientist, LMIC, presented their research exploring trends in the skills listed in OJPs to develop a deeper understanding of in-demand skills. This research project uses pointwise mutual information and other methods to extract more information about common skills from the relationships between skills, occupations and regions.
"Does Foreign Direct Investment Negatively Affect Preservation of Culture in the Global South? Case Studies in Thailand and Cambodia."
Do elements of globalization, such as Foreign Direct Investment (FDI), negatively affect the ability of countries in the Global South to preserve their culture? This research aims to answer this question by employing a cross-sectional comparative case study analysis utilizing methods of difference. Thailand and Cambodia are compared as they are in the same region and have a similar culture. The metric of difference between Thailand and Cambodia is their ability to preserve their culture. This ability is operationalized by their respective attitudes towards FDI; Thailand imposes stringent regulations and limitations on FDI while Cambodia does not hesitate to accept most FDI and imposes fewer limitations. The evidence from this study suggests that FDI from globally influential countries with high gross domestic products (GDPs) (e.g. China, U.S.) challenges the ability of countries with lower GDPs (e.g. Cambodia) to protect their culture. Furthermore, the ability, or lack thereof, of the receiving countries to protect their culture is amplified by the existence and implementation of restrictive FDI policies imposed by their governments.
My study abroad in Bali, Indonesia, inspired this research topic as I noticed how globalization is changing the culture of its people. I learned their language and way of life which helped me understand the beauty and importance of cultural preservation. I believe we could all benefit from learning new perspectives as they could help us ideate solutions to contemporary issues and empathize with others.
Financial Assets: Debit vs Equity Securities.pptxWrito-Finance
financial assets represent claim for future benefit or cash. Financial assets are formed by establishing contracts between participants. These financial assets are used for collection of huge amounts of money for business purposes.
Two major Types: Debt Securities and Equity Securities.
Debt Securities are Also known as fixed-income securities or instruments. The type of assets is formed by establishing contracts between investor and issuer of the asset.
• The first type of Debit securities is BONDS. Bonds are issued by corporations and government (both local and national government).
• The second important type of Debit security is NOTES. Apart from similarities associated with notes and bonds, notes have shorter term maturity.
• The 3rd important type of Debit security is TRESURY BILLS. These securities have short-term ranging from three months, six months, and one year. Issuer of such securities are governments.
• Above discussed debit securities are mostly issued by governments and corporations. CERTIFICATE OF DEPOSITS CDs are issued by Banks and Financial Institutions. Risk factor associated with CDs gets reduced when issued by reputable institutions or Banks.
Following are the risk attached with debt securities: Credit risk, interest rate risk and currency risk
There are no fixed maturity dates in such securities, and asset’s value is determined by company’s performance. There are two major types of equity securities: common stock and preferred stock.
Common Stock: These are simple equity securities and bear no complexities which the preferred stock bears. Holders of such securities or instrument have the voting rights when it comes to select the company’s board of director or the business decisions to be made.
Preferred Stock: Preferred stocks are sometime referred to as hybrid securities, because it contains elements of both debit security and equity security. Preferred stock confers ownership rights to security holder that is why it is equity instrument
<a href="https://www.writofinance.com/equity-securities-features-types-risk/" >Equity securities </a> as a whole is used for capital funding for companies. Companies have multiple expenses to cover. Potential growth of company is required in competitive market. So, these securities are used for capital generation, and then uses it for company’s growth.
Concluding remarks
Both are employed in business. Businesses are often established through debit securities, then what is the need for equity securities. Companies have to cover multiple expenses and expansion of business. They can also use equity instruments for repayment of debits. So, there are multiple uses for securities. As an investor, you need tools for analysis. Investment decisions are made by carefully analyzing the market. For better analysis of the stock market, investors often employ financial analysis of companies.
Abhay Bhutada, the Managing Director of Poonawalla Fincorp Limited, is an accomplished leader with over 15 years of experience in commercial and retail lending. A Qualified Chartered Accountant, he has been pivotal in leveraging technology to enhance financial services. Starting his career at Bank of India, he later founded TAB Capital Limited and co-founded Poonawalla Finance Private Limited, emphasizing digital lending. Under his leadership, Poonawalla Fincorp achieved a 'AAA' credit rating, integrating acquisitions and emphasizing corporate governance. Actively involved in industry forums and CSR initiatives, Abhay has been recognized with awards like "Young Entrepreneur of India 2017" and "40 under 40 Most Influential Leader for 2020-21." Personally, he values mindfulness, enjoys gardening, yoga, and sees every day as an opportunity for growth and improvement.
Falcon stands out as a top-tier P2P Invoice Discounting platform in India, bridging esteemed blue-chip companies and eager investors. Our goal is to transform the investment landscape in India by establishing a comprehensive destination for borrowers and investors with diverse profiles and needs, all while minimizing risk. What sets Falcon apart is the elimination of intermediaries such as commercial banks and depository institutions, allowing investors to enjoy higher yields.
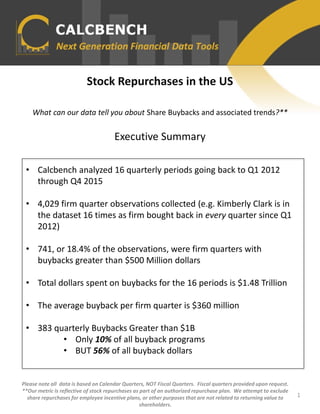
1. Stock Repurchases in the US
What can our data tell you about Share Buybacks and associated trends?**
Executive Summary
Please note all data is based on Calendar Quarters, NOT Fiscal Quarters. Fiscal quarters provided upon request.
**Our metric is reflective of stock repurchases as part of an authorized repurchase plan. We attempt to exclude
share repurchases for employee incentive plans, or other purposes that are not related to returning value to
shareholders.
1
• Calcbench analyzed 16 quarterly periods going back to Q1 2012
through Q4 2015
• 4,029 firm quarter observations collected (e.g. Kimberly Clark is in
the dataset 16 times as firm bought back in every quarter since Q1
2012)
• 741, or 18.4% of the observations, were firm quarters with
buybacks greater than $500 Million dollars
• Total dollars spent on buybacks for the 16 periods is $1.48 Trillion
• The average buyback per firm quarter is $360 million
• 383 quarterly Buybacks Greater than $1B
• Only 10% of all buyback programs
• BUT 56% of all buyback dollars
2. Please note all data is based on Calendar Quarters, NOT Fiscal Quarters. Fiscal quarters provided upon request.
**Our metric is reflective of stock repurchases as part of an authorized repurchase plan. We attempt to exclude
share repurchases for employee incentive plans, or other purposes that are not related to returning value to
shareholders.
2
Dollars Spent on Share Repurchases By Quarter
(in USD Billions)
0
50
100
150
200
250
300
$-
$20.00
$40.00
$60.00
$80.00
$100.00
$120.00
$140.00
Dollars Spent On Share Repurchases Firm Count
3. 3
Please note all data is based on Calendar Quarters, NOT Fiscal Quarters. Fiscal quarters provided upon request.
**Our metric is reflective of stock repurchases as part of an authorized repurchase plan. We attempt to exclude
share repurchases for employee incentive plans, or other purposes that are not related to returning value to
shareholders.
The table below represents the biggest buyers of their own stock over the last 15
calendar quarters.
Firm Level Buybacks
*Avg. Daily Repurchase based on 63 day quarters
38.6% 37.2%
43.5%
39.3% 37.7%
50.6%
29.6%
34.8%
31.2% 29.3%
46.0%
29.9%
34.8%
30.8%
39.9%
35.3%
0.0%
10.0%
20.0%
30.0%
40.0%
50.0%
60.0%
Top 10 Repurchasers Percent of Total
Dollars Repurchased Over last 16 Quarters Avg. Daily Repurchase*
Apple Inc $ 110,976,000,000.00 $ 110,095,238.10
Exxon Mobil Corp $ 54,322,000,000.00 $ 53,890,873.02
International Business Machines Corp $ 44,097,000,000.00 $ 43,747,023.81
Oracle Corp $ 39,248,000,000.00 $ 38,936,507.94
American International Group Inc $ 29,190,000,000.00 $ 28,958,333.33
At&T Inc. $ 27,666,000,000.00 $ 27,446,428.57
Wells Fargo & Company/MN $ 27,385,000,000.00 $ 27,167,658.73
Qualcomm Inc/DE $ 22,264,000,000.00 $ 22,087,301.59
Cisco Systems, Inc. $ 21,365,000,000.00 $ 21,195,436.51
Walt Disney Co/ $ 21,276,000,000.00 $ 21,107,142.86
Merck & Co., Inc. $ 20,996,000,000.00 $ 20,829,365.08
Goldman Sachs Group Inc $ 20,479,000,000.00 $ 20,316,468.25
Intel Corp $ 19,257,000,000.00 $ 19,104,166.67
3M Co $ 18,383,000,000.00 $ 18,237,103.17
Microsoft Corp $ 17,898,000,000.00 $ 17,755,952.38
4. 4
Please note all data is based on Calendar Quarters, NOT Fiscal Quarters. Fiscal quarters provided upon request.
**Our metric is reflective of stock repurchases as part of an authorized repurchase plan. We attempt to exclude
share repurchases for employee incentive plans, or other purposes that are not related to returning value to
shareholders.
Buyback Yields*
Top 20 Firms by Quarter
• Maximum buyback yield in Q2 at almost 9%(Express Scripts)
• Median buyback yield in top 20 firms is 3.2% for all quarters.
Biggest
Buybacks
Smallest in the top
20 (Still big though)
*Total dollars bought back divided by the market capitalization of the firm.
0
5
10
15
20
25
0.0% 1.0% 2.0% 3.0% 4.0% 5.0% 6.0% 7.0% 8.0% 9.0% 10.0%
2014_Q4 2015_Q1 2015_Q2 2015_Q3 2015_Q4
Smallest in the top
20 (still a big
buyback though)
Largest
buyback
yields
5. 5
Please note all data is based on Calendar Quarters, NOT Fiscal Quarters. Fiscal quarters provided upon request.
**Our metric is reflective of stock repurchases as part of an authorized repurchase plan. We attempt to exclude
share repurchases for employee incentive plans, or other purposes that are not related to returning value to
shareholders.
Buyback Yields For Top 10 Firms
0.0%
2.0%
4.0%
6.0%
8.0%
10.0%
12.0%
ScrippsNetworks…
NetApp,Inc.
SouthernCo
JuniperNetworksInc
CbsCorp
NavientCorp
LyondellBasellIndustriesN.V.
SeagateTechnologyplc
UnitedRentalsInc/DE
AllstateCorp
2015 First Quarter
0.0%
2.0%
4.0%
6.0%
8.0%
10.0%
12.0%
ExpressScriptsHoldingCo.
JuniperNetworksInc
NetApp,Inc.
NavientCorp
QualcommInc/DE
LowesCompaniesInc
UrbanOutfittersInc
MarriottInternationalInc…
AmericanInternational…
MurphyOilCorp/DE
2015 Second Quarter
0.0%
2.0%
4.0%
6.0%
8.0%
10.0%
12.0%
SeagateTechnologyplc
XeroxCorp
AmericanInternational…
MichaelKorsHoldingsLtd
IntuitInc
Macy's,Inc.
MicrochipTechnologyInc
MarriottInternationalInc…
AirgasInc
CorningInc/NY
2015 Third Quarter
0.0%
2.0%
4.0%
6.0%
8.0%
10.0%
12.0%
UnitedTechnologiesCorp…
MonsantoCo/NEW/
CorningInc/NY
WholeFoodsMarketInc
TEConnectivityLtd.
Ca,Inc.
LoewsCorp
AmericanInternational…
DowChemicalCo/DE/
SealedAirCorp/DE
2015 Fourth Quarter
6. About the Author
CALCBENCH PREMIUM SUITE
6
Please note all data is based on Calendar Quarters, NOT Fiscal Quarters. Fiscal quarters provided upon request.
Pranav Ghai
CEO & CO-FOUNDER
Pranav is an analytics professional who
has built expert systems that interact
with information to return actionable
ideas. The majority of Pranav’s
professional career has been based in
financial services, with time spent at
Morgan Stanley and ITG. He is also a new
addition to the board of directors at
XBRL-US. Pranav graduated with a BS
from Bates College and an MS in Applied
Mathematics from the Courant Institute
at New York University. In his free time,
Pranav enjoys family time and biking. He
is also an avid sports fan, loving teams
that don't always love back.
7. Try Calcbench Today!
ABOUT THIS REPORT: This report was created using data analyzed via
Calcbench’s Premium Suite, an online interactive platform that helps finance
leaders access and analyze financial data thoroughly and efficiently.
Our accessible and intuitive platform can aid in better understanding
competitor financials, identifying potential risk areas, analyzing trends across
industry sectors, or conducting more effective due diligence.
Sign up for a 2 week free trial at
www.calcbench.com/trial
or contact us at us@calcbench.com or via www.calcbench.com
CALCBENCH PREMIUM SUITE
7