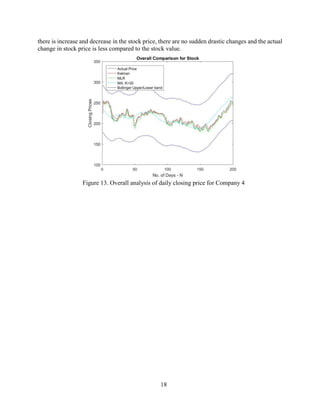
The document presents a project report on stock market analysis using adaptive filters, detailing various prediction algorithms including the Kalman filter and multiple linear regression. It discusses the need for advanced digital signal processing methods to analyze extensive stock market data due to traditional statistical methods’ limitations. The project aims to implement these algorithms in MATLAB and evaluate their performance in predicting stock prices based on historical data.

![4
1.1 Introduction
Prediction algorithms have been a part of mathematical statistics since long and generally
involved complex manual calculations that were time consuming, even for a small dataset. But
from the late 1900’s with the increase in use of computers for defense based applications, there
was a need for prediction algorithms that were more suited to the recent technology. This was
further motivated by the fact that there was a significant increase in the data being collected
(especially from radars), thus making it impractical to use traditional statistics. With this data being
available in digital form, it became apparent that there was a need for digital prediction techniques
that could utilize the available computation resources [1]. In 1960, R.E. Kalman introduced a new
linear prediction algorithm, now known as the Kalman Filter. Since then many different prediction
algorithms have been developed, based on the principles of probability and statistics from
mathematics, but adapted for processing substantial amounts of digital data.
With the advent of globalization in the late half of 20th
century and growth and digitization of
financial markets all over the world, these prediction algorithms were applied for market analysis
and predicting stock market trends. Additionally, since most stock market data can be viewed as
discrete signals (values sampled at regular time intervals like hourly, daily, monthly or yearly), it
was easy to adapt existing filter techniques for stock market analysis. But it additionally his
required the algorithms to have the following two main characteristics:
• Accuracy – This was vital since most stock market predictions need to be done in real
time and they need to be accurate and precise, else it could lead to major financial
losses. To ensure this, it was necessary that the filters are not static and can adapt to
numerous factors and changes in real time and accordingly make predictions. This
meant that the prediction algorithms needed to use feedback and this lead to
development of Adaptive Filters.
• Speed and Ability to process large data – The stock market trends depend on a large
no. of factors like history of the stock prices, previous day closing prices, opening
prices, day highs and lows as well as external factors like market trends of different
countries, etc. All this translates to large amount of data that must be processed in a
limited time to make effective predictions.
The project will focus on the use of adaptive filters for analyzing stock market trends. Adaptive
filters are recursive and use feedback to perform error correction. This makes them suited for
making accurate predictions, as they can factor in the market volatility. The market data is
generally available in the form of charts (histograms, pie charts, etc.) or in time series form, for a
stock. An efficient adaptive filter can be used to determine/ predict the market trends a stock, with
certain a high probability of successful trend prediction, which can help investors take guided
decisions. One approach for this is to predict the opening and closing prices of stocks, based on
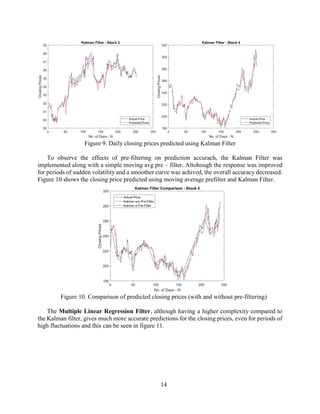
previous data, that has been collected over months or years. The project will involve studying and](https://image.slidesharecdn.com/stockanalysisreport-170519003431/85/Stock-analysis-report-4-320.jpg)
![5
some popular adaptive filters and carrying out an analysis based on performance (speed,
complexity and accuracy of prediction) such as the Adaptive Kalman Filter, Multiple Linear
Regression, Normal Equation Method, Least Mean Square and Recursive Least Squares and
Chaikin Oscillator algorithms. Additionally, a study of Adaptive Hybrid Filters will also be done
to determine its advantages over the previously described algorithms.
Based on the above study, some of the algorithms like Adaptive Kalman Filter, Multiple Linear
Regression, etc. will be developed and implemented in MATLAB. For carrying out the analysis,
stock market data (daily opening and closing prices, daily high and low prices and volume of trade)
for a fixed period (1 year) will be used. The aim of the project will be to determine the most
optimum filter that can be used for stock market analysis and prediction.
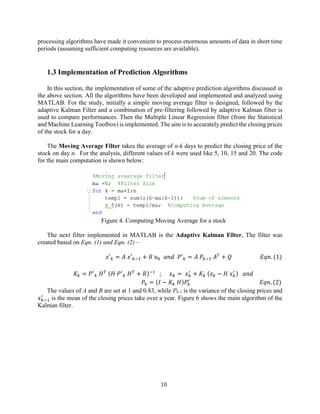
1.2 Adaptive Prediction Algorithms for Market Analysis
Adaptive filters are a class of digital filters, that adjust their coefficients, to adapt to changes
in the signal, by using a form of feedback mechanism. They are essential for systems with unknown
specifications or having some form of volatility that is time varying. Using the feedback, they can
identify the error and accordingly change their response, according to the changes in input signal.
This makes them highly adapt for stock market analysis. The figure below shows a simplified
model of an adaptive filter. In the system, x(k) is the input signal and y(k) is the system output.
Using feedback loop the error signal e(k) is generated, where e(k) = d(k) – y(k), where d(k) is the
desired system output.
Figure. 1 Block diagram of simple Adaptive Filter [15]
This section will include a brief description about the different adaptive prediction algorithms
like the Kalman Filter, Multiple Linear Regression, Normal Equation Method, Least Mean Square,
Recursive Least Square. These prediction algorithms were chosen based on previously published
work [1], [2], [3], [4], [11] and are some of the popular algorithms used for stock market analysis.
This will also include a brief study about Hybrid Adaptive Filters and the performance](https://image.slidesharecdn.com/stockanalysisreport-170519003431/85/Stock-analysis-report-5-320.jpg)
![6
improvements achieved by them. A brief description about Chaikin Oscillators and Bollinger
Bands and their use and importance in stock market analysis will also be included.
1.2.1 Kalman Filter
The Kalman Filter [5], published in 1960 and named after its inventor R E. Kalman, is a
recursive algorithm used for the discrete data linear filtering problem by minimizing the estimated
error covariance [6] and can be used to track any moving target and predict its future position from
previous measurements, even if noise is present [2]. It consists of set of equations that can be used
as a predictor and error corrector and has a wide variety of applications like motion tracking and
analysis, navigation, position estimation, feature tracking and financial analysis.
The discrete Kalman filter algorithm consists of two main steps – Time Update and
Measurement Update. In the equations, 𝐴 is a 𝑛 𝑥 𝑛 matrix describing the previous state of the
system while 𝐵 describes the effect of input on the output of the system. The variables 𝑤(𝑘)and
𝑣(𝑘) are random variables, representing the process and measurement noise.
• The Time Update Equations – This involves computing and forwarding the current system
state and the error covariance [6]. These values are used to get an estimate for the next time
step. These are considered as the predictor equations. The governing equations are shown
below –
𝑥′ 𝑘 = 𝐴 𝑥′ 𝑘−1 + 𝐵 𝑢 𝑘 𝑎𝑛𝑑 𝑃′ 𝑘 = 𝐴 𝑃𝑘−1 𝐴 𝑇
+ 𝑄 𝐸𝑞𝑛. (1)
• The Measurement Update Equations – These equations are responsible for adding the new
measurements (obtained from a feedback mechanism) to the value calculated in the previous
step to give a more accurate result. These are the error corrector equation. The governing
equations are shown below –
𝐾𝑘 = 𝑃′
𝑘 𝐻 𝑇 (𝐻 𝑃′
𝑘 𝐻 𝑇
+ 𝑅)−1
; 𝑥 𝑘 = 𝑥 𝑘
′
+ 𝐾𝑘 (𝑧 𝑘 − 𝐻 𝑥 𝑘
′ ) 𝑎𝑛𝑑
𝑃𝑘 = (𝐼 − 𝐾𝑘 𝐻)𝑃𝑘
′
𝐸𝑞𝑛. (2)
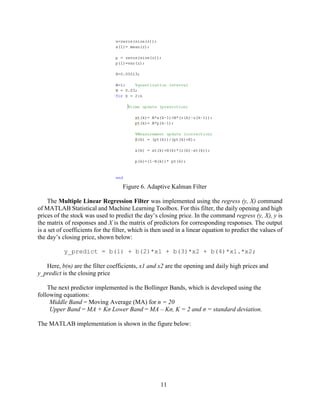
The two steps are executed in a feedback loop shown below in figure 2.](https://image.slidesharecdn.com/stockanalysisreport-170519003431/85/Stock-analysis-report-6-320.jpg)
![7
Figure 2. The Kalman Filter Algorithm
1.2.2 Multiple Linear Regression
Multiple Linear Regression is a statistical analysis technique used to determine the relationship
between two or more “explanatory variables” and a “response variable” by using a linear equation
[7]. The response variables and the explanatory variables are related to each other like the opening
price and the highest price of the stock on a day (explanatory variables) and the closing price (the
response variable). The linear equation is of the following form:
𝑦 = 𝛼0 + 𝑥1 𝛼1 + 𝑥2 𝛼2 + ⋯ + 𝑥 𝑛 𝛼 𝑛 𝐸𝑞𝑛. (3)
where y is the response variable, x is the explanatory variable, n is the no. of observations and
α are coefficients used for curve fitting of the population regression line and computed using
statistical software.
The Normal Equation Method is similar to Linear Regression (using a single explanatory
variable), but uses a 𝑚 𝑥 𝑛 matrix, where m is the number of training variables and n is the number
of independent variables [3]. The main difference between Multiple Linear Regression and The
Normal Equation method, in terms of computation, is that Normal Equation takes less number of
iterations to converge as it uses the least square estimation. The Multiple Linear Regression takes
multiple iterations to converge as it uses gradient descent technique. But as discussed in [3], the
Multiple Linear Regression gives more accurate predictions as compared to Normal Equation.
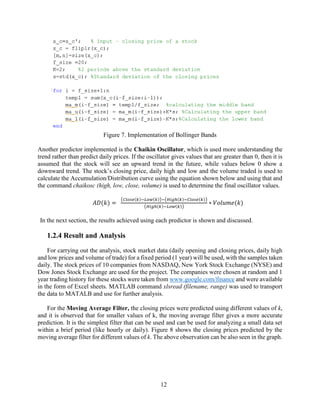
1.2.3 Least Mean Square Adaptive Filter
The Least Mean Square (LMS) is one of the most popular adaptive filter algorithms because
of it slow complexity, fast convergence and stable behavior [8]. It was first introduced in 1959 by
Widrow and Hoff. It uses multiple iterations to reduce the minimum mean square error by
correcting the weight matrix using gradient descent. The figure below shows the LMS algorithm
with transversal filter.
Time Update
Equations
Measurement Update
Equations](https://image.slidesharecdn.com/stockanalysisreport-170519003431/85/Stock-analysis-report-7-320.jpg)
![8
Figure 3. The Least Mean Square Adaptive Filter algorithm [9]
.
It uses the FIR Least Mean Square filter, that is similar to the Weiner filter [5], but does not
use auto – correlation. It consists of the following main components – the input signal x(n), the
weight vector w, the filtered output y(n) and the error signal e(n) = d(n) – y(n). The concerning
equations are –
y(n) = = w * x(n) and e(n) = d(n) – y(n) Eqn. (4)
In comparison to the LMS adaptive filter, the Recursive Least Squares (RLS) algorithm
computes the filter coefficients by computing the minimum of sum of the | e(n) |, i.e. the error
signal. RLS gives a better performance in time varying conditions, but for most market stocks,
unless affected by external factors, most major company stocks show a uniform performance over
longer time periods. Additionally, the RLS algorithm is highly complex and not stable in nature
[4].
1.2.4 Chaikin Oscillator
The Chaikin Oscillator was developed by Marc Chaikin in the 1970s and is extensively used
in stock market analysis to predict the future performance of a stock i.e. if it will be bullish (an
upward stock trend) or bearish (a downward stock trend). It uses the Accumulation/Distribution
momentum to indicate the future trends. The A/D is calculated using the stocks daily closing prices
C, daily high H and low prices L and the total volume V of stock traded in one day. The values are
calculated by subtracting a 10-day and a 3-day exponential moving average of the A/D line, i.e.
the Moving Average Convergence Divergence (MACD) [8]. The A/D is calculated as follows
[11]:
𝐴𝐷 = 𝑐𝑢𝑚𝑎𝑙𝑡𝑖𝑣𝑒 𝑡𝑜𝑡𝑎𝑙 𝑜𝑓
(𝐶−𝐿)−(𝐻−𝐶)
(𝐻−𝐿)
∗ 𝑉 𝐸𝑞𝑛. (5)
Based on these values, it can be determined by investors and market analysts whether to sell
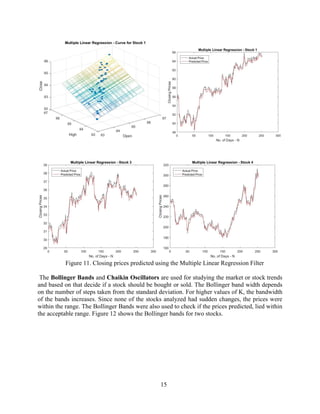
or buy a stock.](https://image.slidesharecdn.com/stockanalysisreport-170519003431/85/Stock-analysis-report-8-320.jpg)
![9
1.2.5 Bollinger Bands
A trading tool invented in 1980s by John Bollinger, it is used for observing the volatility of a
stock based on historical data. The Bollinger bands are adaptive in nature and can be used for
different periods like short term (hourly, daily or weekly) or long term (monthly or yearly) to study
the general trading pattern of a stock and make informed decision.
The Bollinger Bands are computed over an n period moving average with the bands drawn
above and below at interval defined by the multiple of the standard deviation [12]. It basically
consists of three bands:
• The Middle Band which is the moving average (MA) of the stock prices taken over n
days.
• The Upper Band computed as (MA + Kσ) which gives the (maximum possible) higher
price ranges of the stock.
• The Lower Band computed as (MA – Kσ) which gives the (minimum possible) lower
price ranges of the stock.
σ is the standard deviation taken over n period and the typical values for n and K are 20 and 2 [13].
In 2010, Bollinger introduced two other indicators that could be used to make more accurate
analysis, the %b and the Bandwidth which are calculated as follows –
%𝑏 =
(𝐿𝑎𝑠𝑡 𝑝𝑟𝑖𝑐𝑒−𝐿𝑜𝑤𝑒𝑟 𝐵𝑎𝑛𝑑)
(𝑈𝑝𝑝𝑒𝑟 𝐵𝑎𝑛𝑑−𝐿𝑜𝑤𝑒𝑟 𝐵𝑎𝑛𝑑)
𝐵𝑎𝑛𝑑𝑤𝑖𝑑𝑡ℎ =
(𝑈𝑝𝑝𝑒𝑟 𝐵𝑎𝑛𝑑−𝐿𝑜𝑤𝑒𝑟 𝐵𝑎𝑛𝑑)
𝑀𝑖𝑑𝑑𝑙𝑒 𝐵𝑎𝑛𝑑
𝐸𝑞𝑛. (6)
It has been observed that for most stocks [14], the prices are always between the two bands
and any “breakouts” are considered as unusual activity and caused due to external factors or
circumstances.
1.2.6 Hybrid Adaptive Filters
Hybrid Adaptive filters are a combination of transformation techniques like the Discrete
Cosine Transform along with the previously mentioned prediction algorithms. Some of the popular
hybrid adaptive filters used for different applications like reducing noise in wireless channel, color
images, etc., besides being applied for stock market analysis. Some of the popular Hybrid Adaptive
Filters are DCT – LMS and DCT – RLS. In the work published in [4], these filters are used for
carrying out market analysis, with the performance measured against adaptive filters like the
Kalman Filter, LMS and RLS, along with simple filters like the moving average filter. Based on
the analysis, it can be said that though more computationally intensive compared to adaptive filters,
hybrid adaptive filters give better performance and more accurate predictions for almost all the
stocks studied. Additionally, compared to conventional filters, adaptive filters give more accurate
predictions compared to conventional filters, especially for stocks showing sudden price changes
and high volatility over a time period.
In stock market analysis, investment firms and investors use a combination of these tools to
accurately predict stock market trends and make informed decisions. These digital signal](https://image.slidesharecdn.com/stockanalysisreport-170519003431/85/Stock-analysis-report-9-320.jpg)
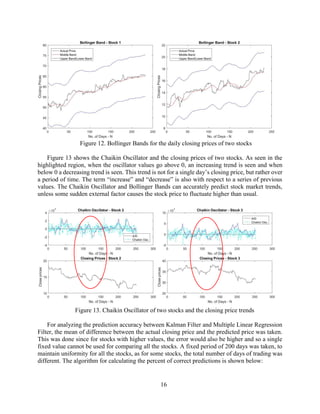
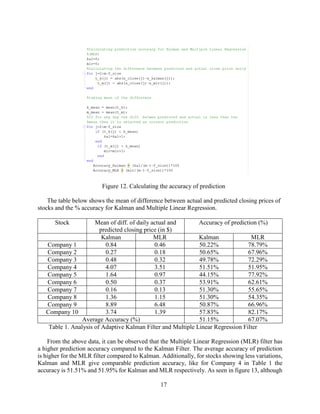
![20
REFERENCES
[1]. Rick Martinelli, “Market Data Prediction with an Adaptive Kalman Filter”, Haiku
Laboratories, December 1995, [online]: ww.haikulabs.com/mdpwakf.htm
[2]. Rick Martinelli and Neil Rhoads, ‘Predicting Market Data with a Kalman Filter”, Haiku
Laboratories, 2009, [online]: http://www.haikulabs.com/pmdwkf26.htm
[3]. S. Iyer, N. Kamdar, B. Soparkar, “Stock Market Prediction using Digital Signal Processing
Models”,
International Journal of Computer Applications (0975 – 8887), pp. 35 – 39, [online]:
www.ijcaonline.org
[4]. B. B. Nair et al., "Application of hybrid adaptive filters for stock market prediction," 2010
International Conference on Communication and Computational Intelligence (INCOCCI),
Erode, 2010, pp. 443-447
[5]. Kalman, R.E., "A new approach to linear filtering and prediction problems", ASME
Transactions, Series D, 82, 35-45, (1961)
[6]. Greg Welch, Gary Bishop, An Introduction to the Kalman Filter, University of North Carolina
at Chapel Hill, Chapel Hill, NC, 1995
[7]. Multiple Linear Regression, [online]: http://www.stat.yale.edu/Courses/1997-
98/101/linmult.htm
[8]. N. Sireesha, K. Chithra and T. Sudhakar, "Adaptive filtering based on least mean square
algorithm," 2013 Ocean Electronics (SYMPOL), Kochi, 2013, pp. 42-48.doi:
10.1109/SYMPOL.2013.6701910
[9]. Giovanis, Eleftherios, “Applications of Least Mean Square (LMS) Algorithm Regression in
Time-Series Analysis”, (August 28, 2010), [online] : https://ssrn.com/abstract=1667440 or
http://dx.doi.org/10.2139/ssrn.1667440
[10]. Chaikin Oscillator, [online]:http://www.investopedia.com/terms/c/chaikinoscillator.asp
[11]. Chaikin Stock Research, [online]: https://en.wikipedia.org
[12]. John Bollinger, “Bollinger Bands”, [online]: https://www.bollingerbands.com/bollinger-
bands
[13]. “Bollinger Bands”, [online]: https://en.wikipedia.org/wiki/Bollinger_Bands
[14]. “Bollinger Bands”, [online]: http://www.investopedia.com/terms/b/bollingerbands.asp
[15]. Paulo S.R. Diniz, Adaptive Filtering Algorithms and Practical Implementation, 3rd ed., New
York: Springer Science+Business Media, 2008
[16]. MATLAB Documentation, [online]: www.mathworks.com
[17]. Stock Data from https://www.google.com/finance](https://image.slidesharecdn.com/stockanalysisreport-170519003431/85/Stock-analysis-report-20-320.jpg)