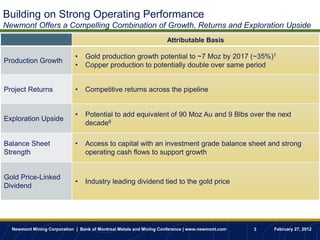
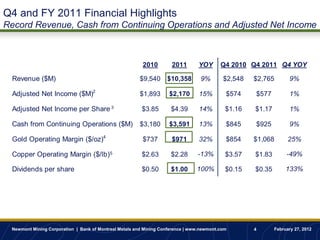
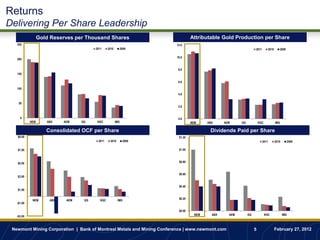
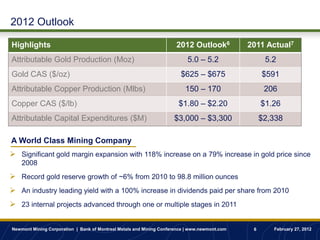
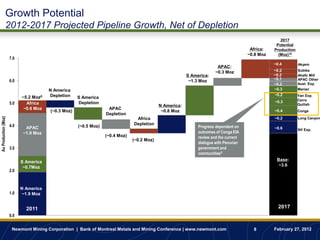
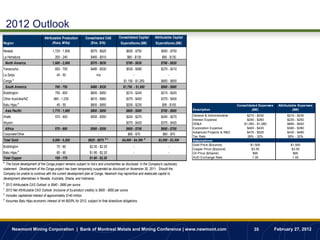
This document provides Richard O'Brien's presentation at the Bank of Montreal Metals and Mining Conference on February 27, 2012. The presentation highlights Newmont Mining Corporation's growth potential through 2017, competitive project returns, and exploration upside. It discusses Newmont's record 2011 financial results, leadership in key metrics like reserves and production per share, and outlook for 2012 of attributing gold production of 5.0-5.2 million ounces and copper production of 150-170 million pounds.
- Newmont Mining Corporation's President and CEO Richard O'Brien presented at the Bank of Montreal Metals and Mining Conference on February 27, 2012.
- In his presentation, O'Brien highlighted Newmont's growth potential through projects in the pipeline that could increase gold production by 35% to around 7 million ounces by 2017. He also noted potential to double copper production over the same period.
- O'Brien emphasized Newmont's strong financial position and competitive project returns across its portfolio.
Richard O'Brien, President and CEO of Newmont Mining Corporation, presented at the Bank of Montreal Metals and Mining Conference on February 27, 2012. In his presentation, O'Brien highlighted Newmont's strong operating performance in 2011, growth potential through 2022, competitive project returns, and significant exploration upside. Newmont is well positioned to potentially grow attributable gold production by 35% to around 7 million ounces by 2022 through projects in its pipeline. The company also has potential to double copper production over this period.
The document discusses Newmont Mining Corporation's growth strategy and financial performance. It highlights production growth potential to around 7 million ounces of gold by 2017 through its project pipeline. It also notes exploration upside with potential to add reserves equivalent to 90 million ounces of gold over the next decade. Finally, it provides updates on various projects in its portfolio such as Akyem, Conga, and Long Canyon.
This presentation discusses the gold mining industry and Newmont Mining Corporation's position. It notes that gold production is declining industry wide while costs are increasing. Newmont has grown its reserves for 5 consecutive years from its global portfolio of assets. The presentation provides financial and operating summaries for Newmont's first quarter of 2007, highlighting production from its Nevada, Peru, Ghana, Indonesia, and Australian operations. It also shares updates on growth projects at Boddington and Tanami to expand production.
The document provides an overview of Q3 2012 financial and operating results for Claude Resources Inc. Key highlights include:
- Net profit of $3.0 million and cash flow from operations of $8.6 million.
- Gold production of 15,073 ounces at a total cash cost of $920 per ounce.
- Continued exploration success extending resources at Santoy Gap and confirming continuity.
- Capital projects on track to increase production including shaft extension and mill expansion.
- Management additions bringing significant operating experience to optimize operations.
- Outlook focuses on increasing production and reserves while advancing projects like Amisk.
The document discusses Newmont Mining Corporation's presentation at the Barclays Americas Mining & Materials Conference on March 20-21, 2013. It includes cautionary statements regarding forward-looking statements and estimates of resources. Newmont highlights its strategic priorities of strong free cash flow growth, leverage to gold prices, returning capital to shareholders, total cost management, and maximizing asset value. Newmont also discusses its record reduction in injury rates in 2012, profitable production growth prospects, capital discipline, and focus on reducing total costs.
The document discusses the company's forward-looking estimates and plans for growing gold production, reserves, and cash flow over the next few years. It estimates increasing gold production from 1.13-1.23 million ounces in 2011 to 1.5 million ounces by 2014 through projects like expanding existing mines. It also estimates growing gold reserves to 20-21 million ounces by the end of 2010 and 21-22 million ounces by the end of 2011. The company aims to be a low-cost leader with total cash costs below industry averages.
Agnico-Eagle Mines Limited reported strong second quarter 2012 results, with record quarterly gold production from currently operating mines of 265,350 ounces at total cash costs of $660 per ounce. Cash provided by operating activities was a record $194 million for the quarter. Production guidance for 2012 was increased to approximately 975,000 ounces of gold. The company has a portfolio of quality, long-life mines that continue to perform well and provide low-risk production growth from existing assets. Significant exploration upside and reserve growth have been demonstrated at the company's 100%-owned assets.
Goldcorp provides a corporate update and guidance for 2010. The company achieved strong earnings and cash flow growth from 2007 to 2009 and expects production to increase to 2.6 million ounces in 2010. Goldcorp has a robust pipeline of projects, with its Peñasquito mine in Mexico being one of the largest new gold mines in the world. The company maintains a strong balance sheet and low-cost production profile. Goldcorp's priorities for 2010 include achieving production at Peñasquito and advancing its pipeline of projects.
This document contains cautionary statements regarding forward-looking statements in Gary Goldberg's presentation at the Bank of Montreal Metals and Mining Conference on February 25, 2013. It warns that actual results could differ materially from projections due to risks and uncertainties. It also notes that estimates of resources are subject to further exploration and development and are not guarantees that minerals can be economically extracted. The document outlines Newmont's priorities of strong free cash flow growth, leverage to gold prices, returning capital to shareholders, total cost management, and maximizing asset value.
- The document is a presentation from Merrill Lynch's Global Metals, Mining and Steel Conference on May 14, 2008.
- It discusses Newmont Mining Corporation's record first quarter results in 2008, including record gold sales and cash flow. It also provides an update on Newmont's major projects and production guidance for 2008.
- The presentation emphasizes Newmont's leverage to rising gold prices through focus on costs and an unhedged production strategy.
Claude Resources Inc. Q4 2012 Conference Call and Webcast PresentationClaude Resources Inc.
Neil McMillan, President and CEO of Claude Resources Inc., presented the company's 2012 financial and operating results on March 28, 2013. Key highlights included net profit of $5.6 million, cash flow from operations of $25.8 million, gold sales increasing 16% to 48,672 ounces, and production reaching a record 49,570 ounces. The presentation also provided details on the company's financial position, debt facilities, operations at Seabee Gold Operation and exploration projects, and production and cost guidance for 2013.
Russell Ball, EVP and CFO of Newmont Mining Corporation, presented at the CIBC Institutional Investor Conference on January 23, 2013. Newmont's 2013 outlook reflects stable production from its portfolio, with contribution expected from the Akyem mine in late 2013. Newmont is focused on total cost management and returning capital to shareholders through its gold price-linked dividend, currently yielding approximately 3.8%. Newmont aims to create leverage through reducing its all-in sustaining costs, which are expected to be $1,100-$1,200 per ounce in 2013.
Agnico-Eagle Mines reported record quarterly gold production from its currently operating mines of 254,955 ounces in Q1 2012, a 19% increase over Q1 2011. Total cash costs were $594 per ounce. Net income was $79 million, up 74% year-over-year. Cash provided by operating activities was $196 million. Production is expected to grow further from existing long-life assets through exploration and mine plan optimization. The company aims to continue generating strong cash flows to fund growth and maintain its dividend.
Gold Investment Symposium 2012 - Jake Klein - Evolution MiningSymposium
The document discusses the revitalisation of the Australian gold industry. It notes that gold prices remain high in a continuing gold bull market, while central banks and gold ETFs continue significant gold purchases. However, gold shares have underperformed the rising gold price due to issues such as resource nationalism, cost blowouts, and failures to meet production guidance. The mid-tier Australian gold producer Evolution Mining is presented as well positioned due to its multiple assets, growth profile, and strong financial performance following its formation through a merger.
Fortuna Silver Mines owns and operates the San Jose silver mine in Mexico and the Caylloma polymetallic mine in Peru. The company has a strong balance sheet with $60.65 million in cash and no debt. Fortuna is focused on growing its silver production and reserves through brownfields exploration and disciplined acquisitions to become a leading silver mining company in Latin America.
First Quantum Minerals is a global diversified mining company currently producing copper cathode, copper concentrate, gold and sulfuric acid. The company has a significant copper production growth profile with new mines coming online in the near to medium term. First Quantum is also expanding into nickel production and pursuing growth through projects in Australia, Finland, Zambia, Mauritania and Peru with over $2 billion in projected investment between 2011-2015. The company has a strong track record of efficient operations and a goal of increasing copper production 46% to 470,000 tonnes by 2015 through expansion of existing mines like Kansanshi in Zambia.
Fortuna Silver Mines Inc. is a silver mining company with operations in Peru and Mexico. The presentation provides an overview of Fortuna's two core operating assets: the San Jose Mine in Mexico and the Caylloma Mine in Peru. It also summarizes the company's financial performance, growth strategy, and extensive land holdings for exploration.
First Quantum Minerals is a growing mining company producing copper and gold. It has a solid base of existing mining operations in Zambia and Mauritania, providing a platform for growth. The company has a robust pipeline of projects that will more than triple its copper production by 2015. These include the Ravensthorpe nickel project in Australia and the Kevitsa nickel/copper project in Finland. Exploration is also expanding the resource base. With a strong financial position and focus on execution, First Quantum is well positioned for continued rapid growth as a major copper and nickel producer.
This document provides an overview of Agnico-Eagle Mines Limited's first quarter 2011 results and corporate strategy. It includes forward-looking statements about estimates, costs, production, exploration, and financial metrics subject to risks and uncertainties. The document also notes the use of non-GAAP metrics and provides highlights of Agnico-Eagle's operating results, financial position, and investment case for shareholders. Key assets discussed include LaRonde, Goldex, Kittila, Lapa, Pinos Altos, and Meadowbank mines.
1) The corporate update discusses Primero's record year in 2012, including record revenues, production, and cash flow.
2) Primero is focused on expanding production at San Dimas through mill expansions and exploration with a goal of 400,000 to 500,000 ounces per year.
3) The acquisition of Cerro Del Gallo is expected to close in Q2 2013, which will provide an additional 95,000 ounces per year starting in 2015 and significantly increase Primero's reserves.
John Tumazos Very Independent Research Conference 2012 PresentationClaude Resources Inc.
The document provides information about a conference presentation on John Tum azos by Brian Skanderbeg in October 2012. It includes a cautionary statement, an overview of the company's assets and projects, including reserves and resources. It also summarizes the company's exploration budgets and activities for 2012. The purpose is to provide investors with information on the company's projects and growth opportunities.
The document discusses the company's annual general meeting on June 16, 2010. It provides an overview of the company's performance in 2008-2009, including operational and financial highlights. Key accomplishments in 2009 included expanding production capacity, repaying loans, and completing a transaction to sell 25% of the Gibraltar Mine. Production and financial results improved steadily through 2009 and 2010. An overview is also given of the Prosperity gold-copper project, outlining reserves, production estimates, economics, and permitting status.
Star Bulk reported financial results for the third quarter and nine months of 2012. Revenues declined compared to the same periods in 2011 due to lower charter rates. The company reported a large net loss for the third quarter and nine months of 2012 due to non-cash items. Excluding these items, adjusted earnings were lower but the company had positive adjusted EBITDA. The company maintained a low net debt to EBITDA ratio and had contracted future revenues of $140 million. Star Bulk continued efforts to control costs and optimize operations.
Lake Shore Gold Corp. presented a marketing presentation on July 4, 2012. The presentation discussed Lake Shore Gold's expected production growth from 85,000-100,000 ounces of gold in 2012 to over 150,000 ounces per year by 2014 at cash costs below $600 per ounce. It also highlighted Lake Shore Gold's large and growing resource base of over 3.4 million ounces measured and indicated and 3.7 million ounces inferred, capable of supporting over 500,000 ounces per year of production. Finally, the presentation showed Lake Shore Gold's share performance over five years of growth and progress.
This presentation discusses reinvesting in the gold bull market. It summarizes Newmont Mining Corporation's position as a world leading gold company with a global portfolio of assets, a track record of reserve growth, and leverage to rising gold prices through expanding margins. It highlights Newmont's first quarter 2007 financial and operating results and provides updates on projects across its operations in North America, South America, Africa, and Asia Pacific.
1) Agnico-Eagle Mines Limited provided a corporate update in April 2012 that included forward-looking statements and notes to investors.
2) The update discussed Agnico-Eagle's positioned to deliver enhanced leverage to gold through reserve growth, production growth, and net free cash flow. Gold production is expected to increase 24% from 2011 to 2014 from currently operating mines.
3) Financial details provided include $221 million in cash and cash equivalents as of December 31, 2011, $920 million in long-term debt, and $880 million in available credit facilities. Common shares outstanding were 170.3 million.
This corporate document provides an update for March 2011. It discusses forward-looking statements and the risks associated with them. Key points include increasing gold production to 1.5 million ounces by 2014, growing gold reserves to over 22 million ounces, acquiring smaller companies, maintaining low costs, and increasing net free cash flow and dividends per share. Operating results for 2010 show growing revenue diversified across six mines, with total gold production of 987,609 ounces and total cash costs of $451 per ounce. Financial results for 2010 were record levels of earnings and cash flow driven by production growth.
This corporate presentation summarizes IMPACT Silver Corp., a silver mining and exploration company operating in Mexico. Key points include:
- IMPACT has increased net earnings 1,390% from 2006-2011 through profitable silver production from two mining districts in Mexico.
- Construction of the new Capire Production Centre is complete, providing organic growth through exploration of additional targets on its land package.
- As of Q3 2012, IMPACT has a strong cash position of $19.6 million with no debt and revenues primarily from silver.
- Production is growing through transition from older, lower grade mines to new higher grade mines including the open-pit Capire Mine.
This document contains cautionary statements regarding forward-looking statements in Gary Goldberg's presentation at the Bank of Montreal Metals and Mining Conference on February 25, 2013. It warns that actual results could differ materially from projections due to risks and uncertainties. It also notes that estimates of resources are subject to further exploration and development and are not guarantees that minerals can be economically extracted. The document outlines Newmont's priorities of strong free cash flow growth, leverage to gold prices, returning capital to shareholders, total cost management, and maximizing asset value.
This corporate presentation from IMPACT Silver Corp outlines their profitable silver production in Mexico, strong financial position with $19.6M cash and no debt, and growth plans. IMPACT is currently transitioning operations from older, lower grade mines to new high grade Capire Mine and Processing Plant, with completion scheduled for Q1 2013. They have explored over 3,000 old mine workings in the Royal Mines of Zacualpan district, Mexico, which has 485 years of mining history, to guide modern exploration efforts.
This document provides an overview and corporate presentation for IMPACT Silver Corp. Key points include:
- IMPACT is a Canadian silver mining company with production at its Royal Mines of Zacualpan in Mexico and several exploration projects.
- It has a strong financial position with $19.6 million in cash and no debt as of Q3 2012.
- Construction is underway for the new Capire Mine and processing plant in Mexico to drive production growth.
- Resources reported for Capire include over 7 million ounces of silver and 30,000 ounces of gold.
- A new high-grade Cuchara-Oscar Mine is scheduled to begin production in early 2013.
The document summarizes Primero's performance in 2012, including record revenues, production, and operating cash flow. It highlights key accomplishments such as the San Dimas expansion announcement and Cerro Del Gallo acquisition. Charts show increases in throughput, production, reserves, earnings per share, and operating cash flow per share from 2011 to 2012. The financial results summary indicates rising revenues, income from mine operations, net income, and adjusted net income in 2012 compared to 2011. The capital structure summary notes a strong cash balance of $139 million and Goldcorp owning approximately $120 million worth of shares.
This corporate presentation provides the following information:
1) IMPACT Silver Corp. operates two silver production centers in Mexico and has several exploration targets to drive growth.
2) In 2012, production totaled over 600,000 ounces of silver from four mines, with revenues of $15.9 million.
3) Recent development included commissioning a new open-pit mine and pilot plant at the Capire Property in 2013.
4) The presentation highlights drill results from ongoing exploration programs aimed at expanding resources and reserves.
This presentation provides an overview of IMPACT Silver Corp., a silver producer with mines located in central Mexico. IMPACT has a strong cash position of $16 million with no debt. Production increased over time through transitioning to newer, higher grade mines. IMPACT aims to grow organically by exploring attractive targets within its land package. The presentation discusses IMPACT's financial highlights, management team, mine properties, and growth strategy.
This presentation provides an overview of IMPACT Silver Corp., a silver producer with mines located in central Mexico. IMPACT has a strong cash position of $16 million with no debt. Production decreased in 2012 as operations transitioned to new, higher grade mines. IMPACT aims to grow organically by exploring attractive targets within its land package. The presentation highlights IMPACT's profitable silver production, growth strategy, management team, and location of its mines in the Zacualpan and Capire Silver Districts of Mexico.
The document provides Frontline's Q4 2012 results and outlook. It discusses several transactions in Q4 including terminating some vessels and early termination of TC contracts on two OBO carriers. It reported a net loss of $16.9 million for Q4 2012 and $82.8 million for full year 2012. Frontline also provides an overview of its fleet size and average time charter rates and coverage for 2013-2014. The company estimates its cash cost breakeven rates for VLCCs and Suezmax tankers for the remainder of 2013.
The document provides an overview of Newmont Mining Corporation's operations and outlook. It discusses Q3 2012 operational performance, with gold production of 1.24Moz at a CAS of $693/oz. It highlights the company's regional operations in North America, South America, and Asia Pacific. It also discusses the company's focus on cost control and margin protection through optimizing current operations and overhead cost reductions. The document emphasizes Newmont's commitment to delivering shareholder value through consistent production, a gold price-linked dividend, and leading reserves and production metrics per share.
This presentation summarizes IMPACT Silver Corp., a silver mining and exploration company. It highlights IMPACT's profitable silver production in Mexico, strong financial position with $19.6 million in cash and no debt, and construction of a new mining district. The presentation provides an overview of IMPACT's management team, board of directors, project locations, growth in production, and exploration targets to drive future growth.
Agnico-Eagle Mines Limited reported its third quarter 2012 results in October 2012. The company achieved record quarterly gold production of 286,971 ounces at total cash costs of $556 per ounce. Cash flow from operations was also a record at $199 million for the quarter. Agnico increased its 2012 gold production guidance to approximately 1,025,000 ounces and lowered its total cash cost guidance to approximately $660 per ounce. The company's portfolio of long-life mines continued to perform well, and it expects low political risk and meaningful production growth from existing assets.
Us silver corporate presentation november 2011ussilver
U.S. Silver Corporation is a silver mining company with operations based in Idaho's Silver Valley. It has a 100% interest in the producing Galena silver mine and plans to redevelop the Coeur Silver mine. In the first half of 2011, the company reported revenue of $49.9 million and cash from operations of $19.5 million. U.S. Silver has proven and probable reserves of 21.9 million ounces of silver that provide over 7 years of mine life. The company aims to increase production and lower costs through focusing on higher grade zones at its Galena mine.
First Quantum Minerals is a growing mining company producing copper and gold. It has a solid base of existing mining operations in Zambia and Mauritania, providing a platform for growth. The company has a robust pipeline of projects that will more than triple its copper production by 2015. These include the Ravensthorpe nickel project in Australia and the Kevitsa nickel/copper project in Finland. Exploration is also expanding the resource base. With a strong financial position and focus on execution, First Quantum is well positioned for continued rapid growth as a major copper and nickel producer.
The presentation provides an overview of Merrill Lynch's Global Metals, Mining and Steel Conference on May 14, 2008. It discusses Newmont Mining Corporation's record first quarter results in 2008, focus on continued cost reductions and reserve growth, and progress on major projects including the Nevada power plant and Yanacocha gold mill expansion. Updates are also given on the Boddington, Conga, Hope Bay, and Akyem projects. The presentation contains cautionary statements regarding forward-looking estimates and metrics.
The document summarizes Richard O'Brien's presentation at the 2012 Denver Gold Forum on September 11, 2012. It outlines Newmont Mining Corporation's strategy to achieve profitable growth through 6-7 million ounces of annual gold production by 2017 while maintaining disciplined returns. It also highlights Newmont's exploration potential of 90 million ounces of gold reserves and 9 billion pounds of copper reserves by 2020. Additionally, the summary discusses Newmont's strong balance sheet, investment grade credit ratings, and commitment to returning capital to shareholders through an industry-leading dividend now tied to the trailing average gold price.
This document provides an investor presentation for Newmont Mining Corporation from August 2018. It contains forward-looking statements regarding estimates of future production, costs, capital expenditures, and other metrics. It summarizes Newmont's strategy of investing in profitable projects across economic cycles to create long-term value. Examples provided include the Merian mine in Suriname, the Long Canyon expansion in Nevada, and the Tanami expansion in Australia. The presentation also highlights Newmont's industry-leading reserve base and long-term production profile from existing and future projects.
Newmont Mining Corporation reported its Q2 2018 earnings. Some key points:
- Gold production was in line with guidance at 1.2 million ounces. All-in sustaining costs were $1,024 per ounce.
- Safety performance is improving through applying lessons learned from recent accidents.
- Two projects, Twin Underground and Northwest Exodus, were delivered on time and under budget.
- An agreement was reached to evaluate the world-class Galore Creek copper-gold asset through a partnership with Teck.
- Costs and capital expenditures remain on track with full-year guidance.
Newmont Mining Corporation held an ESG briefing on May 22, 2018 to discuss their approach to sustainability. The briefing covered Newmont's environmental, social, and governance performance and strategies. Newmont's sustainability efforts are focused on minimizing risks and creating long-term value. Their sustainability framework and robust management systems aim to drive accountability and continuous improvement across their global portfolio.
- The document is a presentation from Gary Goldberg, President and CEO of Newmont Mining Corporation, at the BAML Global Metals & Mining Conference in May 2018.
- It discusses Newmont's strategy of focusing on sustainable value creation through its global portfolio of long-life assets and project pipeline, with improvements including new lower cost mines and profitable expansions.
- Newmont highlights its leading sustainability performance and top quartile total shareholder returns since 2014.
The document is an investor presentation from Newmont Mining Corporation that provides an overview of the company's operations and projects. It summarizes Newmont's track record of improving operational execution and reducing costs. It outlines a portfolio of projects expected to sustain profitable production over the next several years. These include expansions and new mines across North America, Australia, Africa, and South America. The presentation provides production and cost guidance for 2018-2022 and demonstrates Newmont's pipeline of long-term projects beyond the next 5 years.
- Newmont Mining Corporation reported its Q1 2018 earnings on April 26, 2018.
- The company reported adjusted EBITDA of $644 million, up 12% from the prior year quarter, and adjusted net income of $0.35 per diluted share.
- Production was in line with guidance at 1.2 million ounces of gold, and AISC was $973 per ounce, also in line with guidance.
This document provides an investor presentation for Newmont Mining Corporation from March 2018. It includes cautionary statements regarding forward-looking statements. The presentation summarizes Newmont's steady trajectory of improved financial and operational performance from 2013 to 2017. It highlights projects in the pipeline expected to sustain profitable production through 2024. The presentation also discusses Newmont's industry-leading reserve base, balanced capital priorities of growth, debt reduction and returning cash to shareholders, and leadership in profitability and responsibility.
This document is an investor presentation from Newmont Mining Corporation given at a BMO Metals & Mining Conference in February 2018. It summarizes Newmont's financial and operating performance in recent years, current projects and growth plans, and strategy for delivering long-term value to shareholders through profitable production, an industry-leading project pipeline, and returning cash to shareholders.
This document contains the highlights from Newmont Mining Corporation's full year and Q4 2017 earnings report. Some key points:
- Newmont achieved strong operational and financial performance in 2017, with 8% higher gold production of 5.3 million ounces and $1.5 billion in free cash flow, an 88% increase over 2016.
- The company invested in five expansion projects to extend production and replaced mining depletion by adding 6.4 million ounces of gold reserves and 7.9 million ounces of resources.
- Guidance for 2018 forecasts gold production of 4.9-5.4 million ounces at an all-in sustaining cost of $965-1,025 per ounce and total capital spending
This investor presentation provides an overview of Newmont Mining Corporation and its strategy for long-term value creation. Key points include:
- Newmont has a proven strategy of improving operations, strengthening its global portfolio of long-life assets, and delivering superior returns to shareholders.
- The company has significantly reduced costs while increasing production and reserves through operational improvements and profitable expansion projects.
- Newmont has an industry-leading project pipeline expected to provide stable production for over a decade and generate significant free cash flow.
- The company maintains a strong balance sheet, stable production profile, and pays a sustainable dividend, while continuing to invest in growth.
The document summarizes Newmont Mining Corporation's 2017 Investor Day that took place on December 6, 2017. It includes an agenda for the day-long event covering Newmont's business, technical, operational and exploration outlooks. Presentations were given on safety, Newmont's strategy and performance, the gold market outlook, and financial projections. The document provides an overview of Newmont's global portfolio of long-life assets and projects as well as charts on production, cost, capital and reserve metrics through 2022. It emphasizes Newmont's focus on operational excellence, profitable growth from its project pipeline, and leadership in sustainability and value creation.
This document is an investor presentation from Newmont Mining Corporation from November 2017. It summarizes Newmont's strategy to improve its underlying business through superior operational execution, strengthen its portfolio of global assets, and sustain a portfolio of long-life mines. Key points include Newmont leading the sector in safety and sustainability performance, having a global portfolio of long-life assets across four continents, and investing in profitable growth projects across its portfolio to extend mine lives and production.
- Newmont Mining Corporation reported its Q3 2017 earnings. Key highlights included strong operational execution, leading safety performance, and top sustainability ratings.
- AISC for Q3 was $943/oz due to strong performance in Africa, Australia, and North America. Attributable gold production for Q3 was 1.3 million ounces, up 7% from the prior year.
- The company is progressing long-life assets globally and longer-term growth projects in Canada, Australia, and French Guiana to sustain production and extend mine lives.
This document provides an overview of Newmont Mining Corporation's Nevada site tour in September 2017. It begins with a cautionary statement regarding forward-looking statements. The summary then discusses Newmont's strategic focus on improving safety and sustainability performance, strengthening its portfolio through projects like Long Canyon and Twin Creeks, and using its Full Potential program to drive cost improvements across its Nevada assets. An asset management discussion and demonstration of centralized health monitoring follows. The document provides background on regional leadership and concludes with information on local site leadership at Long Canyon.
Gary Goldberg, President and CEO of Newmont Mining Corporation, presented at the Denver Gold Forum in September 2017. The presentation covered Newmont's strategy of improving its underlying business through superior operational execution, strengthening its global portfolio of long-life assets, and creating value for shareholders by leading the sector in profitability and responsibility. It provided details on Newmont's projects and growth pipeline, industry-leading reserves, and financial flexibility to fund growth and return cash to shareholders.
Gary Goldberg, President and CEO of Newmont Mining Corporation, presented at the Denver Gold Forum in September 2017. The presentation covered Newmont's strategy of improving its underlying business through superior operational execution, strengthening its global portfolio of long-life assets, and creating value for shareholders by leading the sector in profitability and responsibility. It highlighted Newmont's industry-leading safety and cost improvement performance, profitable growth projects, top-tier reserves, and financial flexibility.
This document provides an overview of Newmont Mining Corporation's Nevada site tour in September 2017. It begins with a cautionary statement regarding forward-looking statements. The summary then discusses Newmont's strategic focus on improving safety and sustainability performance, strengthening its portfolio through projects like Long Canyon and Twin Creeks, and using its Full Potential program to drive cost improvements across its Nevada operations. An asset management discussion and demonstration of centralized health monitoring follows. The document provides background on regional leadership and concludes with information on site-specific leadership at Long Canyon.
The document is an investor presentation from Newmont Mining Corporation dated September 2017. It provides an overview of Newmont's operations, projects, growth opportunities and key metrics. Newmont has a geographically diverse portfolio of gold mines in North America, South America, Africa and Australia. It is investing in profitable growth projects across its portfolio to sustain steady long-term production while maintaining cost and capital discipline. Newmont also has a leading project pipeline and track record of bringing projects into production.
This document provides a cautionary statement regarding forward-looking statements in an investor presentation by Newmont Mining Corporation. It notes that estimates and expectations in the presentation are based on assumptions that may prove to be incorrect. It also lists potential risks to the forward-looking statements including changes in geotechnical or other conditions, permitting and development issues, political risks, commodity price volatility, and other operational risks. The company does not undertake to publicly revise or update forward-looking statements except as required by law.
FIA officials brutally tortured innocent and snatched 200 Bitcoins of worth 4...jamalseoexpert1978
Farman Ayaz Khattak and Ehtesham Matloob are government officials in CTW Counter terrorism wing Islamabad, in Federal Investigation Agency FIA Headquarters. CTW and FIA kidnapped crypto currency owner from Islamabad and snatched 200 Bitcoins those worth of 4 billion rupees in Pakistan currency. There is not Cryptocurrency Regulations in Pakistan & CTW is official dacoit and stealing digital assets from the innocent crypto holders and making fake cases of terrorism to keep them silent.
Digital Transformation and IT Strategy Toolkit and TemplatesAurelien Domont, MBA
This Digital Transformation and IT Strategy Toolkit was created by ex-McKinsey, Deloitte and BCG Management Consultants, after more than 5,000 hours of work. It is considered the world's best & most comprehensive Digital Transformation and IT Strategy Toolkit. It includes all the Frameworks, Best Practices & Templates required to successfully undertake the Digital Transformation of your organization and define a robust IT Strategy.
Editable Toolkit to help you reuse our content: 700 Powerpoint slides | 35 Excel sheets | 84 minutes of Video training
This PowerPoint presentation is only a small preview of our Toolkits. For more details, visit www.domontconsulting.com
In the Adani-Hindenburg case, what is SEBI investigating.pptxAdani case
Adani SEBI investigation revealed that the latter had sought information from five foreign jurisdictions concerning the holdings of the firm’s foreign portfolio investors (FPIs) in relation to the alleged violations of the MPS Regulations. Nevertheless, the economic interest of the twelve FPIs based in tax haven jurisdictions still needs to be determined. The Adani Group firms classed these FPIs as public shareholders. According to Hindenburg, FPIs were used to get around regulatory standards.
SATTA MATKA SATTA FAST RESULT KALYAN TOP MATKA RESULT KALYAN SATTA MATKA FAST RESULT MILAN RATAN RAJDHANI MAIN BAZAR MATKA FAST TIPS RESULT MATKA CHART JODI CHART PANEL CHART FREE FIX GAME SATTAMATKA ! MATKA MOBI SATTA 143 spboss.in TOP NO1 RESULT FULL RATE MATKA ONLINE GAME PLAY BY APP SPBOSS
How to Implement a Real Estate CRM SoftwareSalesTown
To implement a CRM for real estate, set clear goals, choose a CRM with key real estate features, and customize it to your needs. Migrate your data, train your team, and use automation to save time. Monitor performance, ensure data security, and use the CRM to enhance marketing. Regularly check its effectiveness to improve your business.
Navigating the world of forex trading can be challenging, especially for beginners. To help you make an informed decision, we have comprehensively compared the best forex brokers in India for 2024. This article, reviewed by Top Forex Brokers Review, will cover featured award winners, the best forex brokers, featured offers, the best copy trading platforms, the best forex brokers for beginners, the best MetaTrader brokers, and recently updated reviews. We will focus on FP Markets, Black Bull, EightCap, IC Markets, and Octa.
Discover timeless style with the 2022 Vintage Roman Numerals Men's Ring. Crafted from premium stainless steel, this 6mm wide ring embodies elegance and durability. Perfect as a gift, it seamlessly blends classic Roman numeral detailing with modern sophistication, making it an ideal accessory for any occasion.
https://rb.gy/usj1a2
buy old yahoo accounts buy yahoo accountsSusan Laney
As a business owner, I understand the importance of having a strong online presence and leveraging various digital platforms to reach and engage with your target audience. One often overlooked yet highly valuable asset in this regard is the humble Yahoo account. While many may perceive Yahoo as a relic of the past, the truth is that these accounts still hold immense potential for businesses of all sizes.
IMPACT Silver is a pure silver zinc producer with over $260 million in revenue since 2008 and a large 100% owned 210km Mexico land package - 2024 catalysts includes new 14% grade zinc Plomosas mine and 20,000m of fully funded exploration drilling.
Company Valuation webinar series - Tuesday, 4 June 2024FelixPerez547899
This session provided an update as to the latest valuation data in the UK and then delved into a discussion on the upcoming election and the impacts on valuation. We finished, as always with a Q&A
Anny Serafina Love - Letter of Recommendation by Kellen Harkins, MS.AnnySerafinaLove
This letter, written by Kellen Harkins, Course Director at Full Sail University, commends Anny Love's exemplary performance in the Video Sharing Platforms class. It highlights her dedication, willingness to challenge herself, and exceptional skills in production, editing, and marketing across various video platforms like YouTube, TikTok, and Instagram.
Anny Serafina Love - Letter of Recommendation by Kellen Harkins, MS.
2.27.12 bmo final
1. Bank of Montreal Metals and Mining
Conference
Richard O‟Brien, President & CEO
February 27, 2012
2. Cautionary Statement
Cautionary Statement Regarding Forward Looking Statements, Including 2012 Outlook:
This presentation contains “forward-looking statements” within the meaning of Section 27A of the Securities Act of 1933, as amended, and Section 21E of the Securities Exchange Act of 1934,
as amended, which are intended to be covered by the safe harbor created by those sections and other applicable laws. Those forward-looking statements include (without limitation) estimates
and expectations of, and statements regarding: (i) the Company‟s strategy and plans; (ii) future equity gold and equity copper production; (iii) future operating, sales and other costs; (iv) future
capital expenditures; (v) project returns; (vi) project start dates, ramp up, life, pipeline timelines, including commencement of mining, drilling and stage gate advancement and expansion
opportunities; (vii) potential ounces or tons of reserves, NRM and potential resources; (viii) exploration pipeline, potential or upside, opportunities, growth and growth potential; (ix) dividend
payments and increases; (x) future liquidity, cash and balance sheet expectations; and (xi) other financial outlook indicators relation to the Company‟s operations and projects. Those forward-
looking statements include (without limitation) statements that use forward-looking terminology such as “may”, “will”, “expect”, “predict”, “anticipate”, “believe”, “continue”, “potential”, “target”,
“goal”, “opportunity”, “outlook”, or the negative or other variations of those terms or comparable terminology. Estimates or expectations of future events or results are based upon certain
assumptions, which may prove to be incorrect. Those assumptions include (without limitation): (i) there being no significant change to current geotechnical, metallurgical, hydrological and other
physical conditions; (ii) permitting, development, operations and expansion of the Company‟s projects being consistent with current expectations and mine plans; (iii) political, social and legal
developments in any jurisdiction in which the Company conducts business being consistent with its current expectations; (iv) certain exchange rate assumptions for the Australian dollar to the
U.S. dollar, as well as the other exchange rates being approximately consistent with current levels; (v) certain price assumptions for gold, copper and oil; (vi) prices for key supplies being
approximately consistent with current levels and such supplies otherwise being available on bases consistent with the Company‟s current expectations; and (vii) the accuracy of our current
mineral reserve and mineral resource estimates and exploration information. Where the Company expresses or implies an expectation or belief as to future events or results, that expectation
or belief is expressed in good faith and is believed to have a reasonable basis. However, forward-looking statements are subject to risks, uncertainties and other factors that could cause actual
results to differ materially from future results expressed, projected or implied by the “forward-looking statements”. Those risks, uncertainties and other factors include (without limitation): (i) gold
and other metals price volatility; (ii) currency fluctuations; (iii) increased capital and operating costs, and scarcity of and competition for required labor and supplies; (iv) variances in oregrade or
recovery rates from those assumed in mining plans; (v) operating or technical difficulties; (vi) political and operational risks; (vii) community relations, conflict resolution and outcome of projects
or oppositions; and (viii) governmental regulation and judicial outcomes. For a more detailed discussion of such risks and other factors, see the Company‟s 2011 Annual Report on Form 10-K,
filed on February 24, 2012, with the Securities and Exchange Commission (“SEC”), as well as the Company‟s other SEC filings. These forward-looking statements are not guarantees of future
performance, given that they involve risks and uncertainties. The Company does not undertake any obligation to release publicly revisions to any forward-looking statement except as may be
required under applicable securities laws. Investors should not assume that any lack of update to a previously issued forward-looking statement constitutes a reaffirmation of that statement.
Continued reliance on forward-looking statements is at investors' own risk. In addition, some of the statements in this presentation are based on assumptions or methodologies (such as
commodity prices) or subject to cautionary statements that are discussed in the notes found at the end of this presentation.
Newmont Mining Corporation | Bank of Montreal Metals and Mining Conference | www.newmont.com 2 February 27, 2012
3. Building on Strong Operating Performance
Newmont Offers a Compelling Combination of Growth, Returns and Exploration Upside
Attributable Basis
• Gold production growth potential to ~7 Moz by 2017 (~35%)1
Production Growth
• Copper production to potentially double over same period
Project Returns • Competitive returns across the pipeline
• Potential to add equivalent of 90 Moz Au and 9 Blbs over the next
Exploration Upside
decade6
Balance Sheet • Access to capital with an investment grade balance sheet and strong
Strength operating cash flows to support growth
Gold Price-Linked
• Industry leading dividend tied to the gold price
Dividend
Newmont Mining Corporation | Bank of Montreal Metals and Mining Conference | www.newmont.com 3 February 27, 2012
4. Q4 and FY 2011 Financial Highlights
Record Revenue, Cash from Continuing Operations and Adjusted Net Income
2010 2011 YOY Q4 2010 Q4 2011 Q4 YOY
Revenue ($M) $9,540 $10,358 9% $2,548 $2,765 9%
Adjusted Net Income ($M)2 $1,893 $2,170 15% $574 $577 1%
Adjusted Net Income per Share 3 $3.85 $4.39 14% $1.16 $1.17 1%
Cash from Continuing Operations ($M) $3,180 $3,591 13% $845 $925 9%
Gold Operating Margin ($/oz)4 $737 $971 32% $854 $1,068 25%
Copper Operating Margin ($/lb)5 $2.63 $2.28 -13% $3.57 $1.83 -49%
Dividends per share $0.50 $1.00 100% $0.15 $0.35 133%
Newmont Mining Corporation | Bank of Montreal Metals and Mining Conference | www.newmont.com 4 February 27, 2012
5. Returns
Delivering Per Share Leadership
Gold Reserves per Thousand Shares Attributable Gold Production per Share
250 12.0
2011 2010 2009 2011 2010 2009
10.0
200
8.0
150
6.0
100
4.0
50
2.0
0 0.0
NEM ABX AEM GG KGC IMG NEM ABX AEM GG KGC IMG
Consolidated OCF per Share Dividends Paid per Share
$9.00 $1.20
2011 2010 2009 2011 2010 2009
$7.00 $1.00
$5.00 $0.80
$0.60
$3.00
$0.40
$1.00
$0.20
NEM ABX AEM GG KGC IMG
-$1.00
$0.00
NEM ABX AEM GG KGC IMG
-$3.00
Newmont Mining Corporation | Bank of Montreal Metals and Mining Conference | www.newmont.com 5 February 27, 2012
6. 2012 Outlook
Highlights 2012 Outlook6 2011 Actual7
Attributable Gold Production (Moz) 5.0 – 5.2 5.2
Gold CAS ($/oz) $625 – $675 $591
Attributable Copper Production (Mlbs) 150 – 170 206
Copper CAS ($/lb) $1.80 – $2.20 $1.26
Attributable Capital Expenditures ($M) $3,000 – $3,300 $2,338
A World Class Mining Company
Significant gold margin expansion with 118% increase on a 79% increase in gold price since
2008
Record gold reserve growth of ~6% from 2010 to 98.8 million ounces
An industry leading yield with a 100% increase in dividends paid per share from 2010
23 internal projects advanced through one or multiple stages in 2011
Newmont Mining Corporation | Bank of Montreal Metals and Mining Conference | www.newmont.com 6 February 27, 2012
7. 2011 v 2012 Gold CAS ($/oz)
Rising APAC, Labor and Consumables Costs are Key Drivers
Changes in Consolidated Gold CAS ($/oz) by Region
$700
$680
$660
~$10 ~$10 ~$0 ~$650
$640 ~$40
$620
CAS ($/oz)
$600
$591
$580
$560
$540
$520
$500
2011 Actual APAC N America Africa S America 2012 Gold CAS
(Midpt)
Changes in Consolidated Gold CAS ($/oz) by Driver
$700
$680
$660 ~$15 ~$5
~$5 ~$5 ~$650
$640 ~$25
$620 ~$25
CAS ($/oz)
$600
$591
$580
$560
$540
$520
$500
2011 Actual Manpower All Other A$, net of Byproduct Other Inventory 2012 Gold
Direct Costs hedges credits Changes CAS (Midpt)
Newmont Mining Corporation | Bank of Montreal Metals and Mining Conference | www.newmont.com 7 February 27, 2012
8. Growth Potential
2012-2017 Projected Pipeline Growth, Net of Depletion
2017
Potential
Africa: Production
~0.8 Moz (Moz)10
7.0
~0.4 Akyem
APAC:
~0.3 Moz ~0.2 Subika
S America: ~0.2 Ahafo Mill
6.0 ~0.1 APAC Other
~1.3 Moz
~0.2 Aust. Exp.
N America ~0.3 Merian
Depletion ~0.2 Yan Exp.
~5.2 Moz8 S America
~0.3 Cerro
5.0 Africa Depletion Quilish
N America:
~0.6 Moz APAC
(~0.3 Moz) ~0.8 Moz ~0.4 Conga
Depletion
Au Production (Moz)
Africa ~0.2 Long Canyon
4.0 Depletion
APAC (~0.5 Moz) Progress dependent on ~0.6 NV Exp.
~1.9 Moz outcomes of Conga EIA
(~0.4 Moz) review and the current
(~0.2 Moz)
dialogue with Peruvian
3.0 government and
communities9
S America Base:
~0.7Moz ~3.6
2.0
N America
1.0 ~1.9 Moz
2011 2017
0.0
Newmont Mining Corporation | Bank of Montreal Metals and Mining Conference | www.newmont.com 8 February 27, 2012
9. Project Plan Progressing11
Tangible Steps in Advancing the Project Portfolio
Akyem Conga Tanami Shaft
Average annual production Potential annual production Average annual production
(1st 5 years): ~350 - 450 Koz (1st 5 years): ~300 - 350Moz (1st 5 years): ~60 - 90 Koz
gold; initial production gold; 80 -120Mlbs copper gold; total annual production:
expected ~2014 Engineering ~85% complete ~340 - 400 Koz gold; initial
Engineering essentially All major equipment production expected ~2015
complete purchased Detailed engineering in
Civil and concrete works well Construction activities remain process
advanced suspended Shaft pilot hole underway
First structural steel erected
Newmont Mining Corporation | Bank of Montreal Metals and Mining Conference | www.newmont.com 9 February 27, 2012
10. Exploration Upside
Gold Reserves Increase to Record Levels
2011 Attributable Gold 2011 Attributable Gold Proven and
Proven and Probable Reserves Probable Reserve Additions by Region
Million Ounces
~0.9 ~6.3
~7.4 ~0.3
~2.2
Million Ounces
~2.9
~3.3
98.8 ~6.2
93.5
N. America Africa
2010 Gold Price Additions Revisions Depletions 2011 S. America Asia Pacific
Record gold reserves of 98.8 million ounces, an increase of ~6% from 2010
Total gold NRM increased ~12% over 2010
Biggest gold reserve increases came from North America (Carlin, Phoenix, and
Turf/Leeville) and Africa (Ahafo open pits)
Newmont Mining Corporation | Bank of Montreal Metals and Mining Conference | www.newmont.com 10 February 27, 2012
11. Exploration Upside
Copper Reserves Increase to Record Levels
2011 Attributable Copper 2011 Attributable Copper Proven and
Proven and Probable Reserves Probable Reserve Additions by Region
~0.03 Billion Pounds
~0.1 ~0.3
~0.1
~0.4
Billion Pounds
~0.2
9.7
~0.5
9.4
N. America
Asia Pacific
2010 Cu Price Additions Revisions Depletions 2011 S. America
Record copper reserves of 9.7 billion pounds, an increase of ~3% from 2010
Total copper NRM increased ~11% over 2010
Copper reserve growth driven by increases at Phoenix and Batu Hijau
Newmont Mining Corporation | Bank of Montreal Metals and Mining Conference | www.newmont.com 11 February 27, 2012
12. Exploration Upside
Strong Pipeline to Support the Reserve Base in the Growth Plan
Potentially Economic
Mineral Inventory Non Reserve Mineralization 12 Reserves
Mineralization Reserves
Long Canyon Greater Gold Quarry Phoenix Cu Leach Region Gold Copper
Boddington Leeville/Turf Gold Quarry (Moz) (Blb)
Fimiston Tanami Leeville/Turf Africa 19.47 -
Elang Yanacocha Verde Phoenix
Mike Chaquicocha UG Boddington APAC 31.55 4.34
Fiberline Subika Expansion Tanami North 36.98 2.04
Greater Phoenix Ahafo America
La Carpa Merian
TRJV Yanacocha South 10.75 1.69
Copper Basin Cerro Quilish America
42.1 Moz Au13 98.8 Moz Au13
4.1 Blb Cu13 9.7 Blb Cu13
Newmont Mining Corporation | Bank of Montreal Metals and Mining Conference | www.newmont.com 12 February 27, 2012
13. Long Canyon
Continuing Confidence in Original Investment Thesis
Trend Potential of >3-4X Fronteer’s Stated Resource Estimate of 2.2 Mozs14
(1.4Moz M&I + 0.8Moz Inferred)
The Long Canyon
trend resembles
other significant
trends in the
Nevada region.
Newmont Mining Corporation | Bank of Montreal Metals and Mining Conference | www.newmont.com 13 February 27, 2012
14. North America
Long Canyon
Project Description 2012 Program
A Carlin-Type trend with potential for significant ~70km of infill, extension and district
development and operating synergies exploration drilling
Expect to declare first NRM by year-end17
Current Estimated Potential
Annual Ave. First Five Years ~200 – 300
Production (Koz)15:
Annual Ave. First Five Years ~$375 - $520
CAS ($/oz)15:
Anticipated Start Date: ~2017
Initial Capex ($M)16: $350 - $700
Recent Updates16
Completed 278 drill holes; ~59 km
Infill drilling extended mineralization by ~25%
Step out drilling extended mineralization North
and South
Potentially new mineralized structures
Newmont Mining Corporation | Bank of Montreal Metals and Mining Conference | www.newmont.com 14 February 27, 2012
15. Balance Sheet Strength
Financial Flexibility and Focus on Strong Operating Cash Flows
~$1.8B in Attributable Cash18
~$1.5B in Marketable Securities
~$2.2B in Revolver Capacity19
~$5-6B in Additional Leverage Capacity20
~$10-$11B
(Numbers as of December 31, 2011)
Strong Operating Cash Flows
Internal Funding Capacity For:
Aggressively developing Project Pipeline
Increased exploration funding
Returning capital to shareholders
Newmont Mining Corporation | Bank of Montreal Metals and Mining Conference | www.newmont.com 15 February 27, 2012
16. Industry Leading Gold Price-Linked Dividend21
Paid $1.00 per Share in 2011
$5.00 Dividend increases / Dividend Dividend increases / decreases
decreases by $0.20/share increases / by $0.40/share for every $100/oz $4.70
$4.50 for every $100/oz change decreases by change in the gold price
in the gold price $0.30/share for $4.30
every $100/oz
$4.00 change in gold $3.90
price
Annualized Dividend per Share ($)
$3.50
$3.50 2011 Dividends Paid
Q1 $0.15
$3.10
Q2 $0.20
$3.00
Q3 $0.30
$2.70
Q4 $0.35
$2.50
$2.30
$2.00
$2.00
$1.70
$1.50 $1.40
$1.20
$1.00
$1.00
$0.80
$0.60
$0.50 $0.40
$0.00
$1,100 $1,200 $1,300 $1,400 $1,500 $1,600 $1,700 $1,800 $1,900 $2,000- $2,100- $2,200- $2,300- $2,400- $2,500
-$1,199 -$1,299 -$1,399 -$1,499 -$1,599 -$1,699 -$1,799 -$1,899 -$1,999 $2,099 $2,199 $2,299 $2,399 $2,499 -$2,599
Trailing Realized Gold Price ($/oz)
Newmont Mining Corporation | Bank of Montreal Metals and Mining Conference | www.newmont.com 16 February 27, 2012
17. Newmont: Summary/Conclusion
~35% Potential increase in attributable gold production by 2017
Industry-leading returns on invested capital
Exploration upside as large as current reserve base
Strong balance sheet with significant financial flexibility
Industry-leading dividend
Newmont Mining Corporation | Bank of Montreal Metals and Mining Conference | www.newmont.com 17 February 27, 2012
19. Gold
Bullish Factors for Gold
Source: Dundee Wealth Economics
Newmont Mining Corporation | Bank of Montreal Metals and Mining Conference | www.newmont.com 19 February 27, 2012
20. Gold
Central Banks as Net Buyers of Gold
Net Central Bank Buying
Tonnes
Central Banks were net buyers of 439.7 tonnes of gold in 2011 – the highest level
since 1964
Emerging countries are recognizing the need to diversify away from FX holdings
Trend anticipated to continue due to lack of decisive action in dealing with European
and US debt issues
Source: Bloomberg, Thomson Reuters, GFMS, World Gold Council; Chart courtesy the World Gold Council – Gold Demand Trends Full Year 2011
Newmont Mining Corporation | Bank of Montreal Metals and Mining Conference | www.newmont.com 20 February 27, 2012
21. Gold
Supply and Demand Dynamics
Mine production of 2,810 tonnes, up 4% YoY
Global demand totaled 4,067 tonnes, up +0.4% YoY
Investment demand reached record 1,641 tonnes, up 5% YoY
Bar and coin demand of 1,486.7 tonnes, up 24% YoY
Source: LBMA, Thomson Reuters GFMS, World Gold Council
Newmont Mining Corporation | Bank of Montreal Metals and Mining Conference | www.newmont.com 21 February 27, 2012
22. Gold
Investment Demand
Holdings in ETFs Gold as Percentage of Assets Under Management
~US$147 Trillion in
global investor
holdings and gold
accounts for just
1%!
Money Markets Fixed Income
Equities Alternative Investments
Gold
Source: Thomson Reuters GFMS, World Gold Council Source: Dundee Wealth Economics
2011 demand for ETFs and similar Gold remains drastically under-held as
products of 2,361 tonnes, down an asset under management
58% YoY
Commodities in general, specifically
Gold averaged $1,571.52/oz, up gold, are morphing into an “investment
28% over 2010 asset class”
Newmont Mining Corporation | Bank of Montreal Metals and Mining Conference | www.newmont.com 22 February 27, 2012
23. Gold
Commodity Cycle
Gold Commodity Cycle
If the current bull cycle of gold ended, it would be the shortest
bull cycle in the past 200 years.
Source: Dundee Wealth Economics
Newmont Mining Corporation | Bank of Montreal Metals and Mining Conference | www.newmont.com 23 February 27, 2012
25. Industry Cost Inflation
Year-on-Year Changes to Industry Cash Costs
Industry Cash Cost Trend 2009 to 2011A1
$650 $5
$5
Industry CAGR = 16% $5 $640
$20 Industry Cash Cost Avg.
$600 $5 NEM Attributable CAS
$5 $25
$5 1
NEM
NEM
$10
$10 ~$565
~$591
$15 $20
$550 $15 $25 $555
Cash Costs ($/oz)
2011A Gold CAS Detail
$25
NEM
~10%
$500 $40 ~$510
~10%
$480
~10% ~50%
NEM CAGR „09-„11 = 13%
$450
NEM
~$440 ~20%
$400 Labor Materials & Parts
Consumables Diesel
Power
1Source: GFMS Gold Survey 2011, RBC Capital Markets
Newmont Mining Corporation | Bank of Montreal Metals and Mining Conference | www.newmont.com 25 February 27, 2012
26. Senior Peers Total Costs Breakout
Senior Peers Production Cost Increase1
$1,600
Total production cost per Gold Equivalent Ounce ($/oz)
51
$1,400
61 80
$1,200 54
$1,000 50 669
40 40 40 576
$800 30 20
340
$600 360 330
$400
580 621
450 510
$200 420
$0
2008 2009 2010 2011 2012E
CAS ($/oz) Capex ($/oz) Exploration ($/oz) SG&A ($/oz)
1Industry comparison based on ABX, GG, KGC & AU financials 2008-2011 Actuals. Company guidance utilized for 2012E.
Newmont Mining Corporation | Bank of Montreal Metals and Mining Conference | www.newmont.com 26 February 27, 2012
27. Capital Cost Pressures in Mining Industry
Rio Tinto BHP
Full Year 2011 capex Analyst Estimated Capex Spend1 ($M) Capex set to increase
of $12.3B – up 169% $25 by ~60% between
~5%
from 2010 2011-2012, then by
~20% ~20% and ~5%
Increase in capital $20
thereafter
intensity in 2011 in
Analyst Estimates ($B)
~60% Rise in capex
part due to A$ $15
strength attributed to the
building of future
>$33B in major $10 expansion potential,
projects planned as well as the impact
through 2014 $5 of higher input costs
2012 capex of $16B $27B of growth
approved – similar $0 projects in execution
trend of increasing 2011A 2012E 2013E 2014E
with ~$10B spent to
capital spend? 1Average analyst estimates as provided by JPMorgan, Deutsche Bank and date
Macquarie Research
Vale Anglo American
~$21B capex spend Analyst Estimated Capex Spend1 ($M) Capex flat between
includes ~$6B for $8 2011-2012; ~25%
sustaining operations $7 ~25% (~20%) increase forecasted
between 2012-2013
$6
Ramp up of capex Analyst Estimates ($B)
driven by $5
AAL recently sold
environmental 24.5% interest in
$4
licensing, human Anglo American Sur.
capital constraints,
$3 Speculation that sale
cost pressures and $2 was partly done to
longer lead times $1
strengthen balance
sheet in light of
$0
2012E 2013E 2014E
future capital needs
1Consensus analyst estimates as provided by Capital IQ.
Newmont Mining Corporation | Bank of Montreal Metals and Mining Conference | www.newmont.com 27 February 27, 2012
29. Africa
Akyem
Project Description
A project that doubles Ghanaian gold production and
offers future upside exploration upside
Key Statistics Estimates
(Attributable to NEM)
Annual Production (Koz)15: 350 - 450 Koz
CAS ($/oz)15: $450 - $550
Anticipated Start Date: ~2013 - 2014
Initial Capex ($B)16: $0.9 - $1.1
Current Status
H2 2011: Mechanical (CIL Tanks) & concrete work
associated with the primary crusher and mill
foundations commenced
H2 2012: Construction progress > 50%
H2 2012: Mining activities commence
Newmont Mining Corporation | Bank of Montreal Metals and Mining Conference | www.newmont.com 29 February 27, 2012
30. South America
Conga9
Project Description
A long-lived asset with potential to develop sulfide
and underground opportunities in a region with
existing infrastructure
Key Statistics Estimates
(Attributable to NEM)
300-350 Koz Au;
Annual Production15:
80-120 Mlbs Cu
~$400 - $450/oz
CAS15:
~$1.25 - ~$1.75/lb
Anticipated Start Date: ~2014 - 2015
Initial Capex ($B)16: $2.0 - $2.4
Near Term Milestones
H1 2012: First concrete pour for mill
H2 2012: Detailed engineering complete
H2 2012: Start of SAG Mill construction
H2 2012: Mining activities commence
Newmont Mining Corporation | Bank of Montreal Metals and Mining Conference | www.newmont.com 30 February 27, 2012
32. 2011 v 2012 Gold CAS ($/oz)
Rising APAC, Labor and Consumables Costs are Key Drivers
APAC cost increase accounts for $700 Changes in Gold CAS ($/oz) by Region
$680
~67% of total CAS increase
$660
Average salary in Australian ~$10 ~$10 ~$0 ~$650
$640 ~$40
mining sector was ~$110K/yr in
20101 $620
$600
Australian carbon tax passed in ~$590
$580
November 2011
$560
Polluters will pay ~$23/tonne of
$540
carbon released into
$520
atmosphere
$500
2011 Actual APAC N America Africa S America 2012 Gold CAS
(Midpt)
Changes in Gold CAS ($/oz) by Driver
Labor crunch stemming from $700
shortfall of mining professionals $680
$660 ~$5
Canada shortfall ~60K – 90K by ~$15 ~$5 ~$5 ~$650
$640 ~$25
20172
$620 ~$25
Peru shortfall ~40K by 20202
$600
Commodity boom boosting input $580
~$590
costs `
$560
Competition for parts, $540
equipment driving prices $520
$500
1AustrialnBureau of Statistics 2011 Actual Manpower All Other A$, net of Byproduct Other Inventory 2012 Gold
3Mining Industry Council
Direct Costs hedges credits Changes CAS (Midpt)
Newmont Mining Corporation | Bank of Montreal Metals and Mining Conference | www.newmont.com 32 February 27, 2012
34. Cautionary Statement Regarding
2012 Outlook
2012 Outlook projections contained in this presentation (“Outlook”) are considered “forward-looking statements” within the
meaning of Section 27A of the Securities Act of 1933, as amended, and Section 21E of the Securities Exchange Act of 1934, as
amended which are intended to be covered by the safe harbor created by such sections and other applicable laws. Outlook
represents management‟s good faith estimates or expectations of future results as of February 24, 2012 and is based upon
certain assumptions. Such assumptions, include, but are not limited to: (i) there being no significant change to current
geotechnical, metallurgical, hydrological and other physical conditions; (ii) permitting, development, operations and expansion
of the Company‟s projects being consistent with current expectations and mine plans; (iii) political developments in any
jurisdiction in which the Company operates being consistent with its current expectations; (iv) certain exchange rate
assumptions for the Australian dollar to the U.S. dollar, as well as other the exchange rates, being approximately consistent with
current levels; (v) certain price assumptions for gold, copper and oil; (vi) prices for key supplies being approximately consistent
with current levels; and (vii) the accuracy of our current mineral reserve and mineral resource estimates. However, Outlook is
subject to risks, uncertainties and other factors, including that such assumptions may prove to be incorrect and other factor
referred to on slide, which could cause actual results to differ materially from Outlook. Consequently, Outlook cannot be
guaranteed. Investors are cautioned that the Company does not undertake to subsequently reaffirm, provide comfort or
otherwise update Outlook to reflect events or circumstances after the date hereof or to reflect the occurrence of unanticipated
events. Investors should not assume that any lack of update constitutes a current reaffirmation of Outlook. Continued reliance
on Outlook after the date it is first issued is at investors' own risk.
Newmont Mining Corporation | Bank of Montreal Metals and Mining Conference | www.newmont.com 34 February 27, 2012
35. 2012 Outlook
Attributable Production Consolidated CAS Consolidated Capital Attributable Capital
Region (Kozs, Mlbs) ($/oz, $/lb) Expenditures ($M) Expenditures ($M)
Nevada 1,725 - 1,800 $575 - $625 $650 - $750 $650 - $750
La Herradura 200 - 240 $460 - $510 $80 - $130 $80 - $130
North America 1,900 - 2,000 $570 - $630 $780 - $830 $780 - $830
Yanacocha 650 - 700 $480 - $530 $530 - $580 $270 - $310
La Zanja 40 - 50 n/a - -
a
Conga - - $1,150 - $1,250 $600 - $650
South America 700 - 750 $480 - $530 $1,750 - $1,950 $800 - $900
Boddington 750 - 800 $800 - $850 $215 - $245 $215 - $245
Other Australia/NZ 980 - 1,030 $810 - $860 $375 - $400 $375 - $400
Batu Hijau e 45 - 55 $800 - $850 $200 - $230 $95 - $105 Consolidated Expenses Attributable Expenses
Asia Pacific 1,775 - 1,885 $800 - $850 $800 - $900 $700 - $800 Description ($M) ($M)
Ahafo 570 - 600 $500 - $550 $240 - $270 $240 - $270 General & Administrative $210 - $230 $210 - $230
Interest Expense $240 - $260 $230 - $250
Akyem - - $370 - $420 $370 - $420 DD&A $1,050 - $1,080 $890 - $920
Africa 570 - 600 $500 - $550 $600 - $700 $600 - $700 Exploration Expense $400 - $430 $360 - $390
Advanced Projects & R&D $475 - $525 $430 - $480
Corporate/Other - - $60 - $70 $60 - $70
Tax Rate 28% - 32% 28% - 32%
b,c d
Total Gold 5,000 - 5,200 $625 - $675 $4,000 - $4,300 $3,000 - $3,300 Assumptions
Gold Price ($/ounce) $1,500 $1,500
Boddington 70 - 80 $2.00 - $2.25 - -
Copper Price ($/pound) $3.50 $3.50
e
Batu Hijau 80 - 90 $1.80 - $2.20 - - Oil Price ($/barrel) $90 $90
Total Copper 150 - 170 $1.80 - $2.20 AUD Exchange Rate 1.00 1.00
a
The future development of the Conga project remains subject to risks and uncertainties as disclosed in the Company's cautionary
statement. Development of the Conga project has been temporarily suspended as disclosed on November 30, 2011. Should the
Company be unable to continue with the current development plan at Conga, Newmont may reprioritize and reallocate capital to
development alternatives in Nevada, Australia, Ghana, and Indonesia.
b
2012 Attributable CAS Outlook is $640 - $690 per ounce.
c
2012 Net Attributable CAS Outlook (inclusive of by-product credits) is $600 - $650 per ounce.
d
Includes capitalized interest of approximately $140 million.
e
Assumes Batu Hijau economic interest of 44.5625% for 2012, subject to final divestiture obligations.
Newmont Mining Corporation | Bank of Montreal Metals and Mining Conference | www.newmont.com 35 February 27, 2012
36. Reconciliation – Adjusted Net Income to GAAP Net Income
Non-GAAP Financial Measures
Non-GAAP financial measures are intended to provide additional information only and do not have any standard meaning prescribed by Generally Accepted Accounting
Principles (“GAAP”). These measures should not be considered in isolation or as a substitute for measures of performance prepared in accordance with GAAP.
Reconciliation of Adjusted Net Income to GAAP Net Income
Management uses the non-GAAP financial measure Adjusted net income to evaluate the Company‟s operating performance, and for planning and forecasting future business
operations. The Company believes the use of Adjusted net income allows investors and analysts to compare the results of the continuing operations of the Company and its
direct and indirect subsidiaries relating to the production and sale of minerals to similar operating results of other mining companies, by excluding exceptional or unusual items,
income or loss from discontinued operations and the permanent impairment of assets, including marketable securities and goodwill. Management‟s determination of the
components of Adjusted net income are evaluated periodically and based, in part, on a review of non-GAAP financial measures used by mining industry analysts.
Net income attributable to Newmont stockholders is reconciled to Adjusted net income as follows:
Three months ended Years ended
December 31, December 31,
(in millions except per share, after-tax) 2011 2010 2011 2010
Net income $ (1,028) $ 812 $ 366 $ 2,277
Impairment of Hope Bay assets 1,609 - 1,609 -
Other impairments/asset sales (5) (3) 105 (35)
Fronteer acquisition costs - - 18 -
Boddington contingent consideration 1 1 1 1
PTNNT community contribution - - - 13
Income tax planning, net - (264) (65) (391)
Loss from discontinued operations - 28 136 28
Adjusted net income $ 577 $ 574 $ 2,170 $ 1,893
Net income per share, basic $ (2.08) $ 1.65 $ 0.74 $ 4.63
Adjusted net income per share, basic $ 1.17 $ 1.16 $ 4.39 $ 3.85
Newmont Mining Corporation | Bank of Montreal Metals and Mining Conference | www.newmont.com 36 February 27, 2012
37. Attributable and Net Attributable CAS - Annual
Costs Applicable to Sales per Ounce/Pound
Costs applicable to sales per ounce/pound are non-GAAP financial measures. These measures are calculated by dividing the costs applicable to sales of gold and copper by gold ounces or copper pounds
sold, respectively. These measures are calculated on a consistent basis for the periods presented on both a consolidated and attributable to Newmont basis. Attributable costs applicable to sales are based
on our economic interest in production from our mines. For operations where we hold less than a 100% economic share in the production, we exclude the share of gold or copper production attributable to
the non-controlling interest. We include attributable costs applicable to sales per ounce/pound to provide management, investors and analysts with information with which to compare our performance to
other gold producers. Costs applicable to sales per ounce/pound statistics are intended to provide additional information only and do not have any standardized meaning prescribed by GAAP and should
not be considered in isolation or as a substitute for measures of performance prepared in accordance with GAAP. The measures are not necessarily indicative of operating profit or cash flow from
operations as determined under GAAP. Other companies may calculate these measures differently.
Net attributable costs applicable to sales per ounce measures the benefit of copper produced in conjunction with gold, as a credit against the cost of producing gold. A number of other gold producers
present their costs net of the contribution from copper and other non-gold sales. We believe that including a measure of this basis provides management, investors and analysts with information with which
to compare our performance to other gold producers, and to better assess the overall performance of our business. In addition, this measure provides information to enable investors and analysts to
understand the importance of non-gold revenues to our cost structure.
Costs applicable to sales per ounce/pound
Gold Copper
Years Ended December 31, Years Ended December 31,
2011 2010 2009 2011 2010 2009
Costs applicable to sales:
Consolidated $ 3,440 $ 3,054 $ 2,685 $ 450 $ 430 $ 323
Noncontrolling interests (1) (442) (395) (391) (171) (169) (174)
Attributable to Newmont $ 2,998 $ 2,659 $ 2,294 $ 279 $ 261 $ 149
Gold/Copper sold (000 ounces/million lbs):
Consolidated 5,820 6,296 6,534 356 539 507
Noncontrolling interests (1) (795) (1,043) (1,317) (153) (246) (281)
Attributable to Newmont 5,025 5,253 5,217 203 293 226
Costs applicable to sales per ounce/pound:
Consolidated $ 591 $ 485 $ 411 $ 1.26 $ 0.80 $ 0.64
Attributable to Newmont $ 597 $ 506 $ 440 $ 1.37 $ 0.89 $ 0.66
Net attributable costs applicable to sales per ounce
Years Ended December 31,
2011 2010 2009
Attributable costs applicable to sales:
Gold $ 2,998 $ 2,659 $ 2,294
Copper 279 261 149
$ 3,277 $ 2,920 $ 2,443
Copper revenue:
Consolidated $ (1,262) $ (1,848) $ (1,319)
Noncontrolling interests (1) 542 847 730
(720) (1,001) (589)
Net attributable costs applicable to sales $ 2,557 $ 1,919 $ 1,854
Attributable gold ounces sold (thousands) 5,025 5,253 5,217
Net attributable costs applicable to sales per ounce $ 509 $ 365 $ 356
(1) Relates to partners' interests in Batu Hijau and Yanacocha.
Newmont Mining Corporation | Bank of Montreal Metals and Mining Conference | www.newmont.com 37 February 27, 2012
38. Attributable and Net Attributable CAS - Quarterly
Costs applicable to sales per ounce/pound
Gold Copper
Three Months Ended December 31, Three Months Ended December 31,
2011 2010 2011 2010
Costs applicable to sales:
Consolidated $ 899 $ 775 $ 126 $ 101
Noncontrolling interests (1) (109) (110) (47) (38)
Attributable to Newmont $ 790 $ 665 $ 79 $ 63
Gold/Copper sold (000 ounces/million lbs):
Consolidated 1,493 1,518 80 105
Noncontrolling interests (1) (194) (232) (31) (48)
Attributable to Newmont 1,299 1,286 49 57
Costs applicable to sales per ounce/pound:
Consolidated $ 602 $ 512 $ 1.58 $ 0.95
Attributable to Newmont $ 608 $ 518 $ 1.64 $ 1.07
Net attributable costs applicable to sales per ounce
Three Months Ended December 31, Years Ended Ended December 31,
2011 2010 2011 2010
Attributable costs applicable to sales:
Gold $ 790 $ 665 $ 2,998 $ 2,659
Copper 79 63 279 261
$ 869 $ 728 $ 3,277 $ 2,920
Copper revenue:
Consolidated $ (272) $ (475) $ (1,262) $ (1,848)
Noncontrolling interests (1) 107 221 542 847
(165) (254) (720) (1,001)
Net attributable costs applicable to sales $ 704 $ 474 $ 2,557 $ 1,919
Attributable gold ounces sold (thousands) 1,299 1,286 5,025 5,253
Net attributable costs applicable to sales per ounce $ 542 $ 368 $ 509 $ 366
(1) Relates to partners' interests in Batu Hijau and Yanacocha.
Newmont Mining Corporation | Bank of Montreal Metals and Mining Conference | www.newmont.com 38 February 27, 2012
39. Attributable Proven, Probable and Combined Gold Reserves
(1)
Attributable Proven, Probable, and Combined Gold Reserves
December 31, 2011 December 31, 2010
Proven and Probable Metallurgical
Proven Reserves Probable Reserves Proven + Probable Reserves
Reserves Recovery
Deposits/Districts by Reporting Unit
Newmont Tonnage Grade Gold Tonnage Grade Gold Tonnage Grade Gold Tonnage Grade Gold
Share
(000 tons) (oz/ton) (000 ozs) (000 tons) (oz/ton) (000 ozs) (000 tons) (oz/ton) (000 ozs) (000 tons) (oz/ton) (000 ozs)
North America
Carlin Open Pits, Nevada(2) 100% 92,600 0.058 5,410 239,100 0.030 7,210 331,700 0.038 12,620 77% 263,600 0.043 11,320
Carlin Underground, Nevada 100% 11,300 0.271 3,070 6,700 0.300 2,020 18,000 0.282 5,090 86% 14,600 0.307 4,480
Midas, Nevada 100% 300 0.315 80 500 0.177 80 800 0.226 160 95% 600 0.319 190
Phoenix, Nevada 100% 24,900 0.018 460 422,200 0.016 6,790 447,100 0.016 7,250 72% 329,800 0.018 6,090
Twin Creeks, Nevada 100% 10,600 0.097 1,020 37,700 0.073 2,760 48,300 0.078 3,780 80% 57,800 0.076 4,390
Turquoise Ridge, Nevada (3) 25% 1,700 0.444 740 2,300 0.440 1,020 4,000 0.442 1,760 92% 3,100 0.457 1,410
(4)
Nevada In-Process 100% 23,000 0.020 460 0 0 23,000 0.020 460 65% 28,500 0.022 610
Nevada Stockpiles(5) 100% 65,100 0.053 3,440 3,100 0.028 90 68,200 0.052 3,530 76% 36,700 0.074 2,700
Total Nevada 229,500 0.064 14,680 711,600 0.028 19,970 941,100 0.037 34,650 78% 734,600 0.042 31,200
La Herradura, Mexico 44% 51,000 0.021 1,090 60,400 0.020 1,240 111,400 0.021 2,330 62% 105,700 0.022 2,290
TOTAL NORTH AMERICA 280,500 0.056 15,770 772,000 0.027 21,210 1,052,500 0.035 36,980 77% 840,300 0.040 33,490
South America
Conga, Peru(6) 51.35% 0 0 303,400 0.021 6,460 303,400 0.021 6,460 75% 317,200 0.019 6,080
Yanacocha Open Pits(7) 51.35% 34,200 0.050 1,710 85,700 0.022 1,860 119,900 0.030 3,570 72% 142,300 0.031 4,440
Yanacocha In-Process(4) 51.35% 13,100 0.025 330 2,100 0.027 60 15,200 0.025 390 78% 21,300 0.025 540
Total Yanacocha, Peru 47,300 0.043 2,040 87,800 0.022 1,920 135,100 0.029 3,960 72% 163,600 0.030 4,980
La Zanja, Peru(8) 46.94% 7,300 0.016 120 14,100 0.015 210 21,400 0.016 330 66% 20,600 0.017 350
TOTAL SOUTH AMERICA 54,600 0.040 2,160 405,300 0.021 8,590 459,900 0.023 10,750 73% 501,400 0.023 11,410
Asia Pacific
Batu Hijau Open Pit(9) 48.50% 127,600 0.017 2,110 196,100 0.005 1,040 323,700 0.010 3,150 75% 293,400 0.011 3,110
Batu Hijau Stockpiles(5)(9) 48.50% 0 0 156,900 0.003 490 156,900 0.003 490 70% 170,700 0.004 610
Total Batu Hijau, Indonesia 48.50% 127,600 0.017 2,110 353,000 0.004 1,530 480,600 0.008 3,640 75% 464,200 0.008 3,720
Boddington, Western Australia 100% 181,800 0.020 3,600 871,700 0.018 15,890 1,053,500 0.019 19,490 81% 1,067,700 0.019 20,300
(10)
Duketon, Western Australia 16.85% 2,000 0.044 90 8,800 0.045 400 10,800 0.045 490 95% 6,300 0.055 350
Jundee, Western Australia 100% 3,100 0.160 490 700 0.237 160 3,800 0.174 650 91% 4,700 0.160 750
Kalgoorlie Open Pit and Underground 50% 13,300 0.059 790 41,700 0.056 2,350 55,000 0.057 3,140 85% 55,700 0.059 3,300
(5)
Kalgoorlie Stockpiles 50% 53,900 0.023 1,260 0 0 53,900 0.023 1,260 78% 15,100 0.031 470
Total Kalgoorlie, Western Australia 50% 67,200 0.030 2,050 41,700 0.056 2,350 108,900 0.040 4,400 83% 70,900 0.053 3,780
Tanami, Northern Territories 100% 6,200 0.156 960 10,500 0.149 1,560 16,700 0.152 2,520 94% 14,400 0.142 2,040
Waihi, New Zealand 100% 0 0 3,200 0.112 360 3,200 0.112 360 89% 4,200 0.110 460
TOTAL ASIA PACIFIC 387,900 0.024 9,300 1,289,600 0.017 22,250 1,677,500 0.019 31,550 82% 1,632,300 0.019 31,400
Africa
Ahafo Open Pits(11) 100% 0 0 194,700 0.055 10,790 194,700 0.055 10,790 87% 148,300 0.064 9,540
Ahafo Underground (12) 100% 0 0.000 0 5,900 0.11 660 5,900 0.112 660 89% 0 0.000 0
Ahafo Stockpiles(5) 100% 21,000 0.030 630 0 0 21,000 0.030 630 86% 14,100 0.033 460
Total Ahafo, Ghana 100% 21,000 0.030 630 200,600 0.057 11,450 221,600 0.055 12,080 87% 162,400 0.062 10,000
Akyem, Ghana(13) 100% 0 0 144,500 0.051 7,390 144,500 0.051 7,390 88% 137,900 0.052 7,200
TOTAL AFRICA 21,000 0.030 630 345,100 0.055 18,840 366,100 0.053 19,470 87% 300,300 0.057 17,210
TOTAL NEWMONT WORLDWIDE 744,000 0.037 27,860 2,812,000 0.025 70,890 3,556,000 0.028 98,750 80% 3,274,300 0.029 93,500
(1) Reserves are calculated at a a gold price of US$1,200, A$1,250, or NZ$1,600 per ounce unless otherwise noted. 2010 reserves were calculated at a gold price of US$950, A$1,100, or
NZ$1,350 per ounce unless otherwise noted. Tonnage amounts have been rounded to the nearest 100,000 unless they are less than 50,000, and gold ounces have been rounded to the
nearest 10,000.
(2)
Includes reserves under development at the Emigrant deposits for combined total undeveloped reserves of 1.6 million ounces.
(3) Reserve estimates provided by Barrick, the operator of the Turquoise Ridge Joint Venture.
(4)
In-process material is the material on leach pads at the end of each year from which gold remains to be recovered. In-process material reserves are reported separately where tonnage
or contained ounces are greater than 5% of the total site-reported reserves and contained ounces are greater than 100,000.
(5) Stockpiles are comprised primarily of material that has been set aside to allow processing of higher grade material in the mills. Stockpiles increase or decrease depending on current
mine plans. Stockpile reserves are reported separately where tonnage or contained ounces are greater than 5% of the total site-reported reserves and contained ounces are greater
(6) Project is under development.
(7) Reserves include the currently undeveloped deposit at La Quinua Sur, which contains reserves of 0.8 million attributable ounces.
(8) Reserves estimates were provided by Buenaventura, the operator of the La Zanja project.
(9) Percentage reflects Newmont’s economic interest at December 31, 2011.
(10)
Reserve estimates provided by Regis Resources Ltd, in which Newmont holds a 16.85% interest.
(11) Includes undeveloped reserves at Yamfo South, Yamfo Central, Techire West, Subenso South, Subenso North, Yamfo Northeast, and Susuan totaling 3.2 million ounces.
(12) Subika Underground project is under development.
(13) Project is under development.
Newmont Mining Corporation | Bank of Montreal Metals and Mining Conference | www.newmont.com 39 February 27, 2012
40. Attributable Copper Reserves
(1)
Attributable Copper Reserves
December 31, 2011 December 31, 2010
Proven Reserves Probable Reserves Proven + Probable Reserves Proven + Probable Reserve
Newmont
Tonnage Grade Copper Tonnage Grade Copper Tonnage Grade Copper Metallurgical Tonnage Grade Copper
Deposits/Districts Share
(000 tons) (Cu%) (million (000 tons) (Cu%) (million (000 tons) (Cu%) (million Recovery (000 tons) (Cu%) (million
pounds) pounds) pounds) pounds)
North America
Phoenix, Nevada 100% 24,900 0.15% 70 425,400 0.15% 1,230 450,300 0.15% 1,300 61% 332,600 0.15% 1,030
(2)
Phoenix Copper Leach, Nevada 100% 9,900 0.24% 50 160,300 0.21% 690 170,200 0.21% 740 52% 132,900 0.23% 610
TOTAL NORTH AMERICA 34,800 0.17% 120 585,700 0.16% 1,920 620,500 0.16% 2,040 58% 465,500 0.18% 1,640
South America
Conga, Peru(3) 51.35% 0 0 303,400 0.28% 1,690 303,400 0.28% 1,690 85% 317,200 0.26% 1,660
TOTAL SOUTH AMERICA 0 0 303,400 0.28% 1,690 303,400 0.28% 1,690 85% 317,200 0.26% 1,660
Asia Pacific
Batu Hijau(3) 48.50% 127,600 0.51% 1,300 196,100 0.35% 1,370 323,700 0.41% 2,670 76% 293,400 0.44% 2,560
Batu Hijau, Stockpiles(4)(5) 48.50% 0 0 156,900 0.34% 1,060 156,900 0.34% 1,060 66% 170,700 0.35% 1,200
Batu Hijau, Indonesia 48.50% 127,600 0.51% 1,300 353,000 0.34% 2,430 480,600 0.39% 3,730 73% 464,100 0.40% 3,760
Boddington, Western Australia 100.00% 181,800 0.10% 350 871,700 0.11% 1,910 1,053,500 0.11% 2,260 83% 1,067,800 0.11% 2,360
TOTAL ASIA PACIFIC 309,400 0.27% 1,650 1,224,700 0.18% 4,340 1,534,100 0.20% 5,990 77% 1,531,900 0.20% 6,120
TOTAL NEWMONT WORLDWIDE 344,200 0.26% 1,770 2,113,800 0.19% 7,950 2,458,000 0.20% 9,720 74% 2,314,600 0.20% 9,420
(1)
Reserves are calculated at US$3.00 or A$3.15 per pound copper price unless otherwise noted. 2010 reserves were calculated at US$2.50 or A$2.95 per pound copper price unless otherwise noted.
Tonnage amounts have been rounded to the nearest 100,000 and pounds have been rounded to the nearest 10 million.
(2)
Project is under development. Leach reserves are within Phoenix Reserve Pit.
(3) Project is under development.
(4)
Percentage reflects Newmont's economic interest at December 31, 2011.
(5)
Stockpiles are comprised primarily of material that has been set aside to allow processing of higher grade material. Stockpiles increase or decrease depending on current mine plans. Stockpiles are
reported separately where tonnage or contained metal are greater than 5% of the total site reported reserves.
Newmont Mining Corporation | Bank of Montreal Metals and Mining Conference | www.newmont.com 40 February 27, 2012