2020.01.14 PI New Pacific Report
•
0 likes•66 views

2020.01.14 PI New Pacific Report

Recommended
More Related Content
What's hot
What's hot (20)
Similar to 2020.01.14 PI New Pacific Report
Similar to 2020.01.14 PI New Pacific Report (20)
More from Hindenburg Research
More from Hindenburg Research (20)
Recently uploaded
Recently uploaded (20)
2020.01.14 PI New Pacific Report
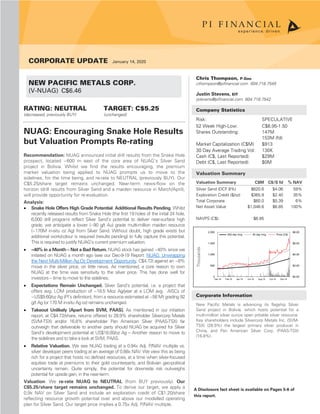
- 1. Chris Thompson, P.Geo cthompson@pifinancial.com 604.718.7549 Justin Stevens, EIT jstevens@pifinancial.com 604.718.7542 Company Statistics Risk: SPECULATIVE 52 Week High-Low: C$6.95-1.50 Shares Outstanding: 147M 153M (fd) Market Capitalization (C$M) $913 30 Day Average Trading Vol: 130K Cash (C$, Last Reported): $29M Debt (C$, Last Reported): $0M Valuation Summary Valuation Summary C$M C$/S fd % NAV Silver Sand (DCF 8%) $620.6 $4.06 59% Exploration Credit ($/oz) $365.9 $2.40 35% Total Corporate $60.0 $0.39 6% Net Asset Value $1,046.6 $6.85 100% NAVPS (C$): $6.85 Thousands Corporate Information New Pacific Metals is advancing its flagship Silver Sand project in Bolivia, which hosts potential for a multi-million silver ounce open pittable silver resource. Key shareholders include Silvercorp Metals Inc. (SVM- TSX) (28.9%) the largest primary silver producer in China, and Pan American Silver Corp. (PAAS-TSX) (16.8%). A Disclosure fact sheet is available on Pages 5-6 of this report. CORPORATE UPDATE January 14, 2020 NEW PACIFIC METALS CORP. (V-NUAG) C$6.46 RATING: NEUTRAL TARGET: C$5.25 (decreased, previously BUY) (unchanged) NUAG: Encouraging Snake Hole Results but Valuation Prompts Re-rating Recommendation: NUAG announced initial drill results from the Snake Hole prospect, located ~600 m east of the core area of NUAG’s Silver Sand project in Bolivia. Whilst we find the results encouraging, the premium market valuation being applied to NUAG prompts us to move to the sidelines, for the time being, and re-rate to NEUTRAL (previously BUY). Our C$5.25/share target remains unchanged. Near-term news-flow on the horizon (drill results from Silver Sand and a maiden resource in March/April), will provide opportunity for re-evaluation. Analysis: • Snake Hole Offers High Grade Potential. Additional Results Pending. Whilst recently released results from Snake Hole (the first 19 holes of the initial 24 hole, 6,000 drill program) reflect Silver Sand’s potential to deliver near-surface high grade, we anticipate a lower (~90 g/t Au) grade multi-million maiden resource (~170M in-situ oz Ag) from Silver Sand. Without doubt, high grade exists but additional work/colour is required (results pending) to fully capture this potential. This is required to justify NUAG’s current premium valuation. • ~40% in a Month – Not a Bad Return. NUAG stock has gained ~40% since we initiated on NUAG a month ago (see our Dec-9-19 Report: NUAG: Unwrapping the Next Multi-Million Ag Oz Development Opportunity, C$4.72) against an ~8% move in the silver price, on little news. As mentioned, a core reason to own NUAG at the time was sensitivity to the silver price. This has done well for investors – time to move to the sidelines. • Expectations Remain Unchanged. Silver Sand’s potential, i.e. a project that offers avg. LOM production of ~18.5 Moz Ag/year at a LOM avg. AISCs of ~US$9.60/oz Ag (PI’s definition), from a resource estimated at ~58 Mt grading 92 g/t Ag (or 170 M in-situ Ag oz) remains unchanged. • Takeout Unlikely (Apart from SVM, PAAS). As mentioned in our initiation report, at C$4.72/share, returns offered to 28.9% shareholder Silvercorp Metals (SVM-TSX) and/or 16.8% shareholder Pan American Silver (PAAS-TSX) far outweigh that deliverable to another party should NUAG be acquired for Silver Sand’s development potential at US$18.00/oz Ag – Another reason to move to the sidelines and to take a look at SVM, PAAS. • Relative Valuation. We see NUAG trading at a 0.94x Adj. P/NAV multiple vs. silver developer peers trading at an average of 0.88x NAV. We view this as being rich for a project that hosts no defined resources, at a time when silver-focused equities trade at premiums to their gold counterparts, and Bolivian geo-political uncertainty remain. Quite simply, the potential for downside risk outweighs potential for upside gain, in the near-term. Valuation: We re-rate NUAG to NEUTRAL (from BUY previously). Our C$5.25/share target remains unchanged. To derive our target, we apply a 0.9x NAV on Silver Sand and include an exploration credit of C$1.20/share reflecting resource growth potential over and above our modelled operating plan for Silver Sand. Our target price implies a 0.75x Adj. P/NAV multiple. $0.00 $2.00 $4.00 $6.00 $8.00 0 500 1,000 1,500 2,000 Dec-18 Feb-19 Apr-19 Jun-19 Aug-19 Oct-19 Dec-19 200 day mvg 50 day mvg Price (C$)
- 2. New Pacific Metals Corp. (V-NUAG) – January 14, 2020 2 | CORPORATE UPDATE Chris Thompson, P.Geo | Justin Stevens, EIT Snake Hole Results Results released yesterday represent the first 19 holes of the initial 24-hole, 6,000 m drill program at Snake Hole. Snake Hole is located ~600 m east of the core area of Silver Sand (See Exhibit 1). Key takeaways include: • Drilling is focused on testing a ~750 m of mineralized structure with results released yesterday covering ~400 m of the southern portion of the Snake Hole structural trend, as currently defined. • Selected intercepts include 72.44 m grading 279 g/t Ag from 60.5 m to 132.94 m including 32.96 m grading 517 g/t Ag from 84.95 m to 117.9 m; 38.4 m grading 143 g/t Ag from 29.9 m to 68.3m including 6.2m grading 749 g/t Ag from 36.8 m to 43.0 m; and 11.12m grading 761 g/t Ag from 149.48 m to 160 m. • Surface mapping suggests that the mineralized fracture zone remains open to north where it potentially trends undercover towards the Jisas prospect located ~2 km to the northwest. • Results from the five remaining holes which test the northern portion of the trend are pending. Exhibit 1 – Silver Sand Project Plan Showing Targets, Including Snake Hole Source: New Pacific Metals Corp.
- 3. New Pacific Metals Corp. (V-NUAG) – January 14, 2020 Chris Thompson, P.Geo | Justin Stevens, EIT CORPORATE UPDATE | 3- A Word on Silver Whilst we note that the silver price has lost ground relative to gold (YTD), we see a higher silver price being reflected in select silver focused equities (specifically NUAG), which are trading at premium multiples. This is concerning. Either the silver price will play catch up to gold and the Au: Ag ratio will move lower from 86:1 to potentially 80:1 (which we last saw in Sept 2019) or silver equities will correct lower. An 80:1 ratio implies a silver price of US$19.50/oz assuming current spot gold (US$1,562/oz). For perspective, if silver does move higher and continue its 6-month trend of outperforming gold we see a US$23/oz Ag price as not being unrealistic (see our Sept-4- 19 Report: Silver Price Sensitivity: US$23/oz – Blink & You Might Miss it). We continue to watch the silver space. Valuation Using a DCF valuation, calculated using base-case estimates of $18.00/oz Ag and a US$0.75/C$ FX rate we value Silver Sand’s potential at ~C$621M (C$4.06/share) on a project basis (See Exhibit 2). For the additional resource potential offered by NUAG’s prospective land package, we apply an additional credit of ~C$366M, based on potential to grow our modelled mineable resource to 270M in-situ oz Ag (an additional 100 in-situ oz Ag) and a US$1.37/oz Ag valuation metric (consistent with the NAV-derived valuation of Ag ounces modelled in our mine plan for Silver Sand. In terms of corporate adjustments, we recognize ~C$60M in corporate adjustments to arrive at a total NAV of C$6.85/share (with our target of C$5.25/share based on applying a 0.9x NAV multiple on Silver Sand and incorporating 0.5x of our exploration credit (C$1.20) (see Exhibit 2). We see NUAG trading at a 0.94x Adj. P/NAV multiple vs. silver developer peers trading at an average of 0.88x NAV. We view this as being rich for a project that hosts no defined resources, at a time when silver-focused equities trade at premiums to their gold counterparts, and Bolivian geo- political uncertainty remain. Quite simply, the potential for downside risk outweighs potential for upside gain, in the near-term – time to move to the sidelines. We re-rate NUAG to NEUTRAL (previously from BUY). Our C$5.25/share target remains unchanged. Exhibit 2 – NUAG Valuation Summary & Target Derivation Source: PI Financial Corp. Valuation Summary C$ 000 C$/fd % NAV Multiple Target Value Value Multiple Target Value Project NAV Target Derivation Silver Sand (DCF 8%) $620,607 $4.06 59% 0.90x $3.66 Project NAVPS (C$) $6.46 0.75x $4.84 Exploration Credit ($/oz) $365,949 $2.40 35% 0.50x $1.20 Corporate NAVPS (C$) $0.39 1.0x $0.39 Project Total $986,556 $6.46 94% $4.85 $5.24 Corporate NAV Target Price $5.25 Working Capital $36,249 $0.24 3% 1.00x $0.24 Return to Target -15% Additional Capital $23,775 $0.16 2% 1.00x $0.16 LT Liabilities $0 $0.00 0% 1.00x $0.00 Total Corporate $60,023 $0.39 6% $0.39 Net Asset Value $1,046,580 $6.85 100% $5.25 Adjusted Straight P/NAV 0.90x 0.91x Target P/NAV 0.75x 0.77x Share Count I/O F/D ITM 147,262 152,787
- 4. New Pacific Metals Corp. (V-NUAG) – January 14, 2020 4 | CORPORATE UPDATE Chris Thompson, P.Geo | Justin Stevens, EIT Exhibit 3 – Silver-Focused Producer and Developer Peers (P/CFPS & P/NAV multiples). Source: PI Financial Corp. Share Target Stock Price Price Rating 2019 E 2020 E 2019 E 2020 E 2019 E 2020 E NAVPS P/NAV TP/NAV Silver Developers MAG Silver MAG.TO C$13.76 C$19.50 BUY - C$0.10 n.m. 131.5x n.m. 4.0x C$17.90 0.75x 1.10x CT/JS SilverCrest Metals SIL.TO C$8.36 C$10.50 BUY - - n.m. n.m. n.m. n.m. C$8.78 0.95x 1.21x PK/AA New Pacific Metals NUAG.V C$6.46 C$5.25 NEUTRAL - - n.m. n.m. n.m. n.m. C$6.85 0.94x 0.75x CT/JS Group Average 0.88x 1.0x Company Analyst NAV Ticker CFPS P/CF TP/CF
- 5. New Pacific Metals Corp. (V-NUAG) – January 14, 2020 Chris Thompson, P.Geo | Justin Stevens, EIT CORPORATE UPDATE | 5 Disclosure Fact Sheet Ratings Price Volatility / Risk BUY : recommendation: stock is expected to appreciate from its current price level at least 10-20% in the next 12 months. NEUTRAL : recommendation: stock is expected to trade in a narrow range from its current price level in the next 12 months. SELL : recommendation: stock is expected to decline from its current price level at least 10-20% in the next 12 months. U/R : Under Review N/R : No Rating TENDER: Investors are guided to tender to the terms of the takeover offer. Analyst recommendations and targets are based on the stock’s expected return over a 12-month period or may be based on the company achieving specific fundamental results. Under certain circumstances, and at the discretion of the analyst, a recommendation may be applied for a shorter time period. The basis for the variability in the expected percentage change for a recommendation, relates to the differences in the risk ratings applied to individual stocks. For instance stocks that are rated Speculative must be expected to appreciate at the high end of the range of 10-20% over a 12- month period. SPECULATIVE : The Company has no established operating revenue, and/or balance sheet or cash flow concerns exist. Typically low public float or lack of liquidity exists. Rated for risk tolerant investors only. ABOVE AVERAGE : Revenue and earnings predictability may not be established. Balance sheet or cash flow concerns may exist. Stock may exhibit low liquidity. AVERAGE : Average revenue and earnings predictability has been established; no significant cash flow/balance sheet concerns are foreseeable over the next 12 months. Reasonable liquidity exists. Price Volatility/Risk analysis while broad based includes the risks associated with a company’s balance sheet, variability of revenue or earnings, industry or sector risks, and liquidity risk. Analyst Certification I, Chris Thompson, hereby certify that all of the views expressed in this report accurately reflect my personal views about the subject securities or issuers. I also certify that no part of my compensation was, is, or will be, directly or indirectly related to the specific recommendations or views expressed in this report. I am the research analyst primarily responsible for preparing this report. Research Disclosures Applicability 1) PI Financial Corp. and its affiliates’ holdings in the subject company’s securities, in aggregate exceeds 1% of each company’s issued and outstanding securities. 1) No 2) The analyst(s) responsible for the report or recommendation on the subject company, a member of the research analyst’s household, and associate of the research analyst, or any individual directly involved in the preparation of this report, have a financial interest in, or exercises investment discretion or control over, securities issued by the following companies. 2) No 3) PI Financial Corp. and/or its affiliates have received compensation for investment banking services for the subject company over the preceding 12-month period. 3) No 4) PI Financial Corp. and/or its affiliates expect to receive or intend to seek compensation for investment banking services from the subject company. 4) Yes 5) PI Financial Corp. and/or its affiliates have managed or co-managed a public offering of securities for the subject company in the past 12 months. 5) No 6) The following director(s), officer(s) or employee(s) of PI Financial Corp. is a director of the subject company in which PI provides research coverage. 6) No 7) A member of the research analyst’s household serves as an officer, director or advisory board member of the subject company. 7) No 8) PI Financial Corp. and/or its affiliates make a market in the securities of the subject company. 8) No 9) Company has partially funded previous analyst visits to its projects. 9) No 10) Additional disclosure: 10) No General Disclosure The affiliates of PI Financial Corp. are PI Financial (US) Corp., PI Financial Services Corp., and PI Capital Corp. Analysts are compensated through a combined base salary and bonus payout system. The bonus payout is amongst other factors determined by revenue generated directly or indirectly from various departments including Investment Banking. Evaluation is largely on an activity-based system that includes some of the following criteria: reports generated, timeliness, performance of recommendations, knowledge of industry, quality of research and investment guidance, and client feedback. Analysts and all other Research staff are not directly compensated for specific Investment Banking transactions. None of the material, nor its content, nor any copy of it, may be altered in any way, transmitted to, copied or distributed to any other party, without the prior express written permission of PI Financial Corp. PI Financial Corp.’s policies and procedures regarding dissemination of research, stock rating and target price changes can be reviewed on our corporate website at www.pifinancial.com (Research: Research and Conflict Disclosure).
- 6. New Pacific Metals Corp. (V-NUAG) – January 14, 2020 6 | CORPORATE UPDATE Chris Thompson, P.Geo | Justin Stevens, EIT The attached summarizes PI’s analysts review of the material operations of the attached company(s). Analyst Company Type of Review Operations / Project Date Chris Thompson New Pacific Metals Corp. Management Update Vancouver, BC 01/20 Site Visit Silver Sand 4/19 Disclosure to US Residents PI Financial (US) Corp. is a U.S. registered broker-dealer and subsidiary of PI Financial Corp. PI Financial (US) Corp. accepts responsibility for the contents of this research report, subject to the terms and limitations as set out above. U.S. residents seeking to effect a transaction in any security discussed herein should contact PI Financial (US) Corp. directly. Recommendations Number of Recommendations Percentage BUY 58 77.33% NEUTRAL 13 17.33% SELL 2 2.67% TENDER 2 2.67% U/R 0 0.00% N/R 0 0.00% TOTAL 75 Stock Rating and Target Changes For reports that cover more than six subject companies, the reader is referred to our corporate web site for information regarding stock ratings and target changes. www.pifinancial.com (Research: Research and Conflict Disclosure). New Pacific Metals Corp. (Initiated Coverage: Dec 09/19) Date Rating Change Target Change Share Price Jan 14/20 Buy to Neutral $5.25 $6.46 Dec 09/19 Buy $5.25 $4.72 . $0.00 $1.00 $2.00 $3.00 $4.00 $5.00 $6.00 $7.00
- 7. Participants of all Canadian Marketplaces. Members: Investment Industry Regulatory Organization of Canada, Canadian Investor Protection Fund and AdvantageBC International Busi- ness Centre - Vancouver. Estimates and projections contained herein are our own and are based on assumptions which we believe to be reasonable. Information presented herein, while obtained from sources we believe to be reliable, is not guaranteed either as to accuracy or completeness, nor in providing it does PI Financial Corp. assume any responsibility or liability. This information is given as of the date appearing on this report, and PI Financial Corp. assumes no obligation to update the information or advise on further developments relating to securities. PI Financial Corp. and its affiliates, as well as their respective partners, directors, shareholders, and employees may have a position in the securities mentioned herein and may make purchases and/or sales from time to time. PI Financial Corp. may act, or may have acted in the past, as a financial advisor, fiscal agent or underwriter for certain of the companies mentioned herein and may receive, or may have received, a remuneration for their services from those companies. This report is not to be construed as an offer to sell, or the solicitation of an offer to buy, securities and is intended for distribution only in those jurisdictions where PI Financial Corp. is registered as an advisor or a dealer in securities. Any distribution or dissemination of this report in any other jurisdiction is strictly prohibited. PI Financial Corp. is a Canadian broker-dealer and is not subject to the standards or requirements of MiFID II. Readers of PI Financial Corp. research in the applicable jurisdictions should make their own efforts to ensure MiFID II compliance. For further disclosure information, reader is referred to the disclosure section of our website. Capital Markets Group Research Analysts Mining Chris Thompson, P. Geo Head of Mining Research 604.718.7549 Philip Ker, P.Geo, MBA 647.789.2407 Special Situations & Cannabis Jason Zandberg, B.BA, CFA 604.718.7541 Devin Schilling, CFA 604.718.7557 Technology Gus Papageorgiou, CFA 416.883.9047 David Kwan, CFA 604.718.7528 Associate Analyst Justin Stevens, EIT 604.718.7542 Research Associates Akin Akinwale, B. Eng 647.789.2415 Fayassir Haqna, B.BA 604.718.7556 Neehal Upadhyaya, BAFM, MAcc 416.775.5107 Marketing and Publishing Michelle Kwok 604.664.2724 Institutional Sales Vancouver Jim Danis, B.Sc. (Hons.) 604.718.7551 Jeremiah Katz 604.664.2916 David Goguen, CFA 604.664.2963 Doug Melton, FCSI 604.718.7532 Brodie Dunlop 604.718.7533 Toronto Jose Estevez, CFA 416.883.9042 John McBride 416.883.9045 InstitutionalTrading Vancouver Darren Ricci 604.664.2998 or 800.667.6124 (US) or 877.682.7233 (CDN) Adam Dell, CFA 604.718.7517 or 888.525.8811 Calvin Buchanan 604.718.7535 Toronto Scott Brophy 416.883.9043 Mark Whelpton 416.883.9048 Investment Banking Mining Dan Barnholden, MBA 604.664.3638 Russell Mills, CFA, MFin 647.789.2405 Tim Graham, B.Comm 604.664.3656 Jim Locke, CFA 604.664.2670 Technology Blake Corbet, BA 604.664.2967 Vay Tham 647.789.2417 Equity Capital Markets/Syndication Tim Johnston 416.775.5112 Trina Wang 604.664.3637 Investment Banking Associate Joe Brunner 604.664.3633 Aaron Eisenberg 647.789.2411 Investment Banking Analyst Trevor Anderson 604.718.7516 Head Office Suite 1900, 666 Burrard Street Vancouver, BC V6C 3N1 ph: 604.664.2900 fx: 604.664.2666 Calgary Office Suite 4000, 350 7th Avenue SW Calgary, AB T2P 3N9 ph: 403.543.2900 fx: 403.543.2800 Toronto Office Suite 3401, 40 King Street West Toronto, ON M5H 3Y2 ph: 416.883.9040 fx: 647.789.2401 PI Financial Corp. www.pifinancial.com Managing Director, Head of Research Gus Papageorgiou, CFA 416.883.9047 Managing Director, SVP Capital Markets Jeremiah Katz 604.664.2916 Managing Director, Head of Institutional Sales &Trading Jim Danis, B.Sc. (Hons.) 604.718.7551 Managing Director, Co-Head of Investment Banking Blake Corbet, BA 604.664.2967 Managing Director, Co-Head of Investment Banking Dan Barnholden, MBA 604.664.3638 For a complete list of branch office locations and contact information, please go to www.pifinancialcorp.com