Download as PDF, PPTX


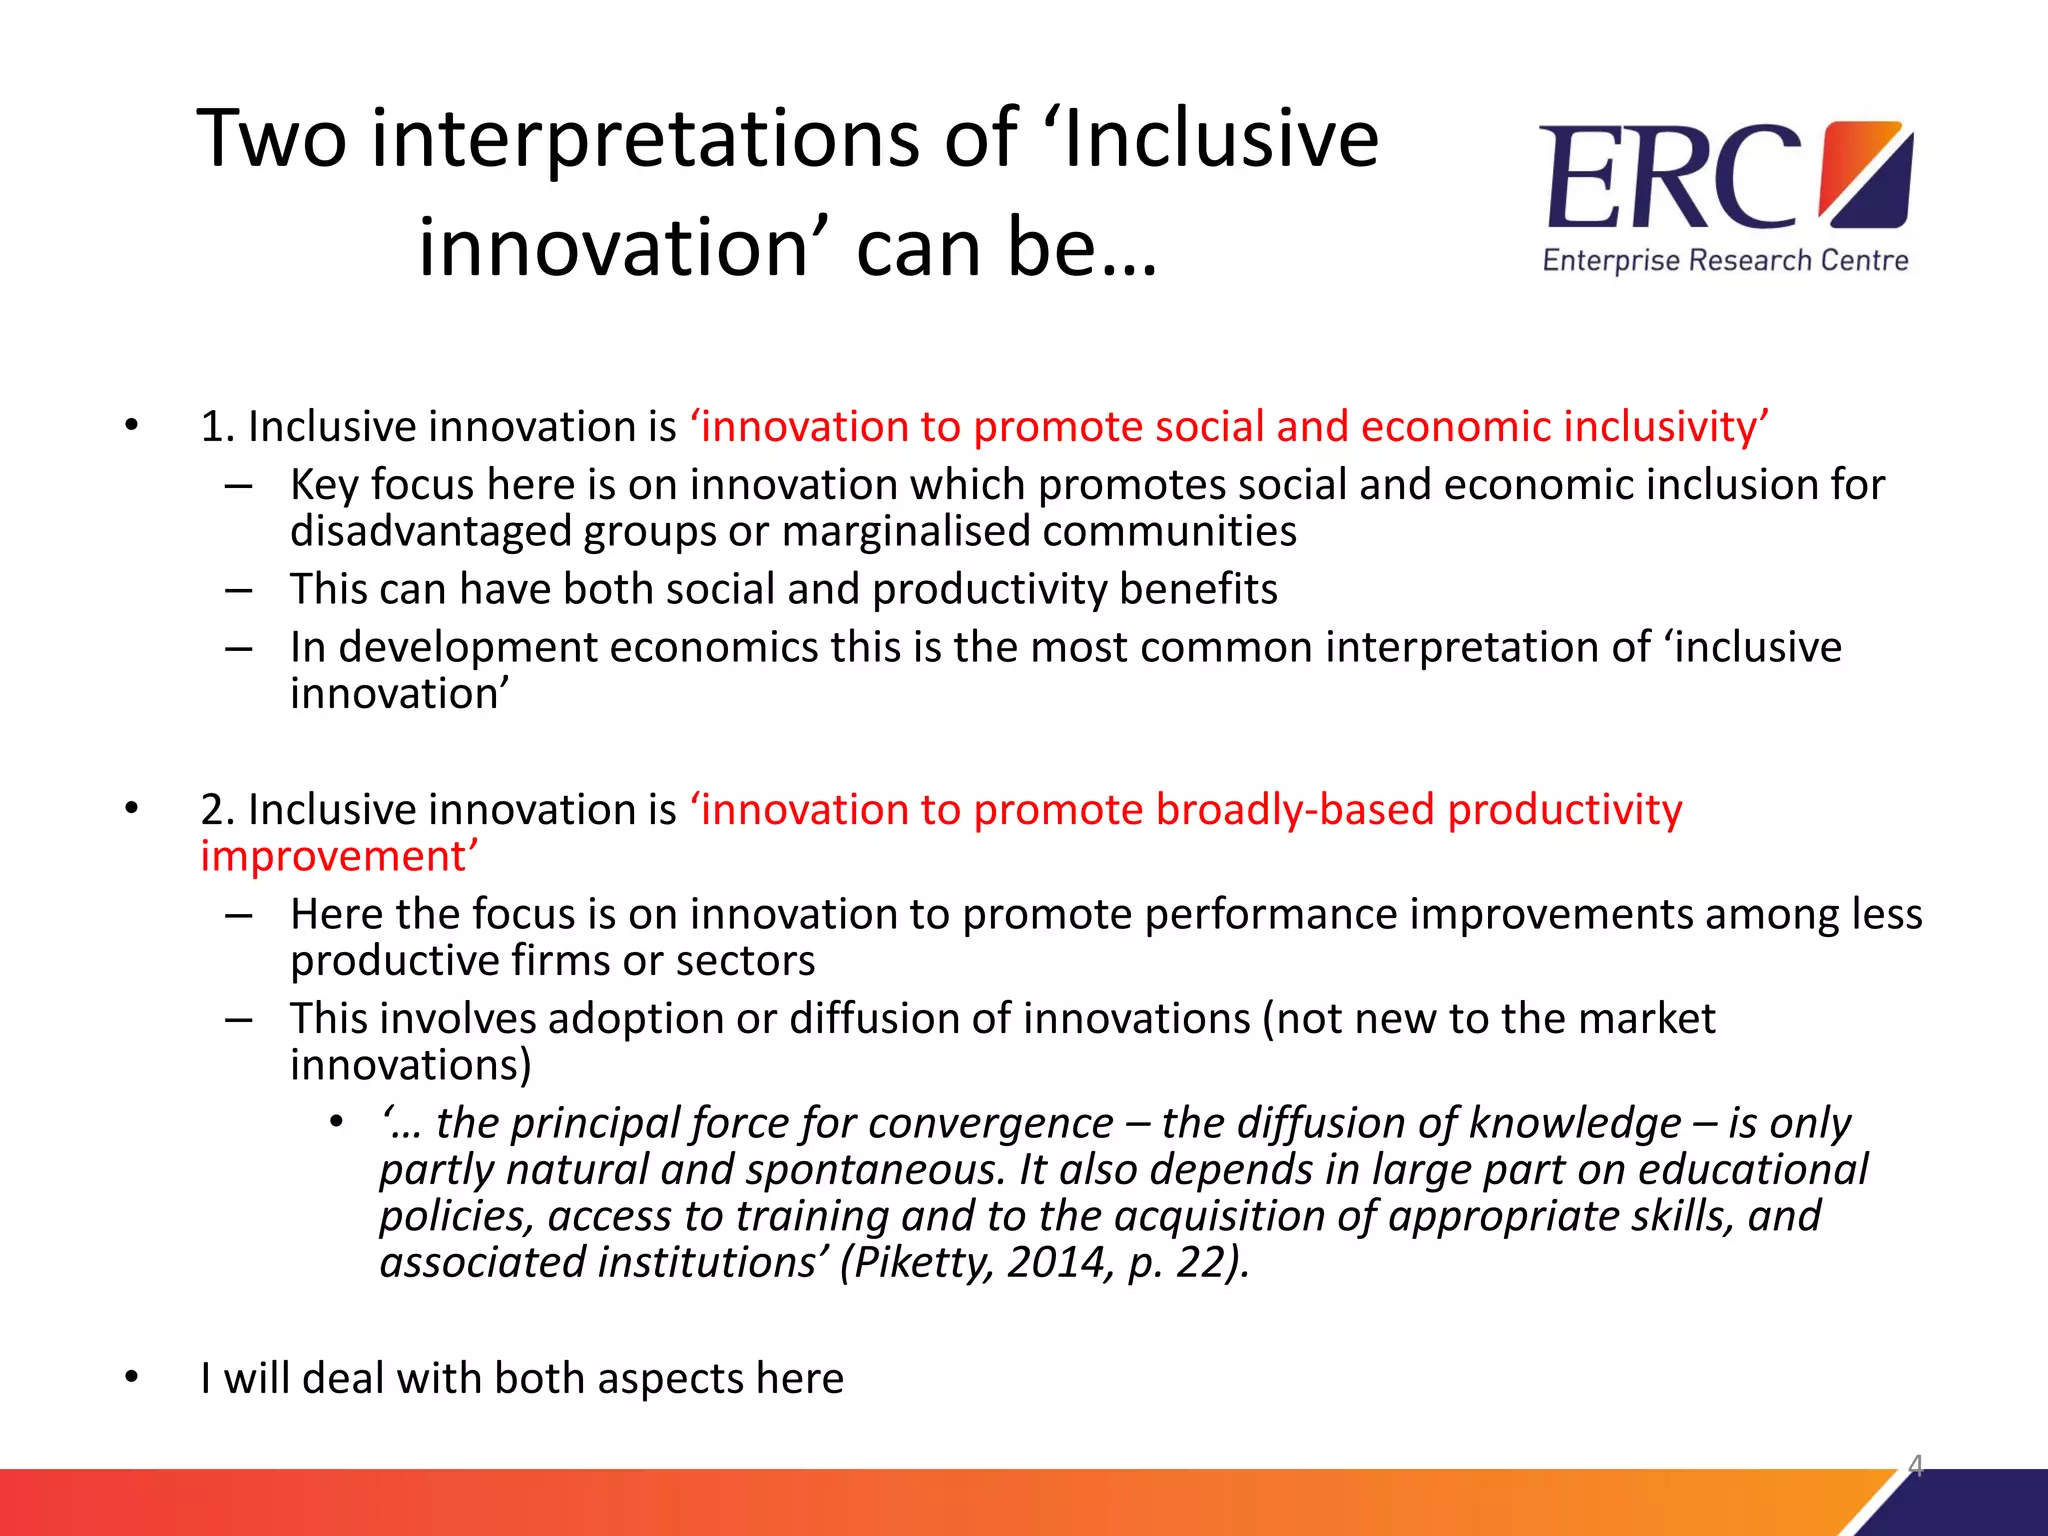


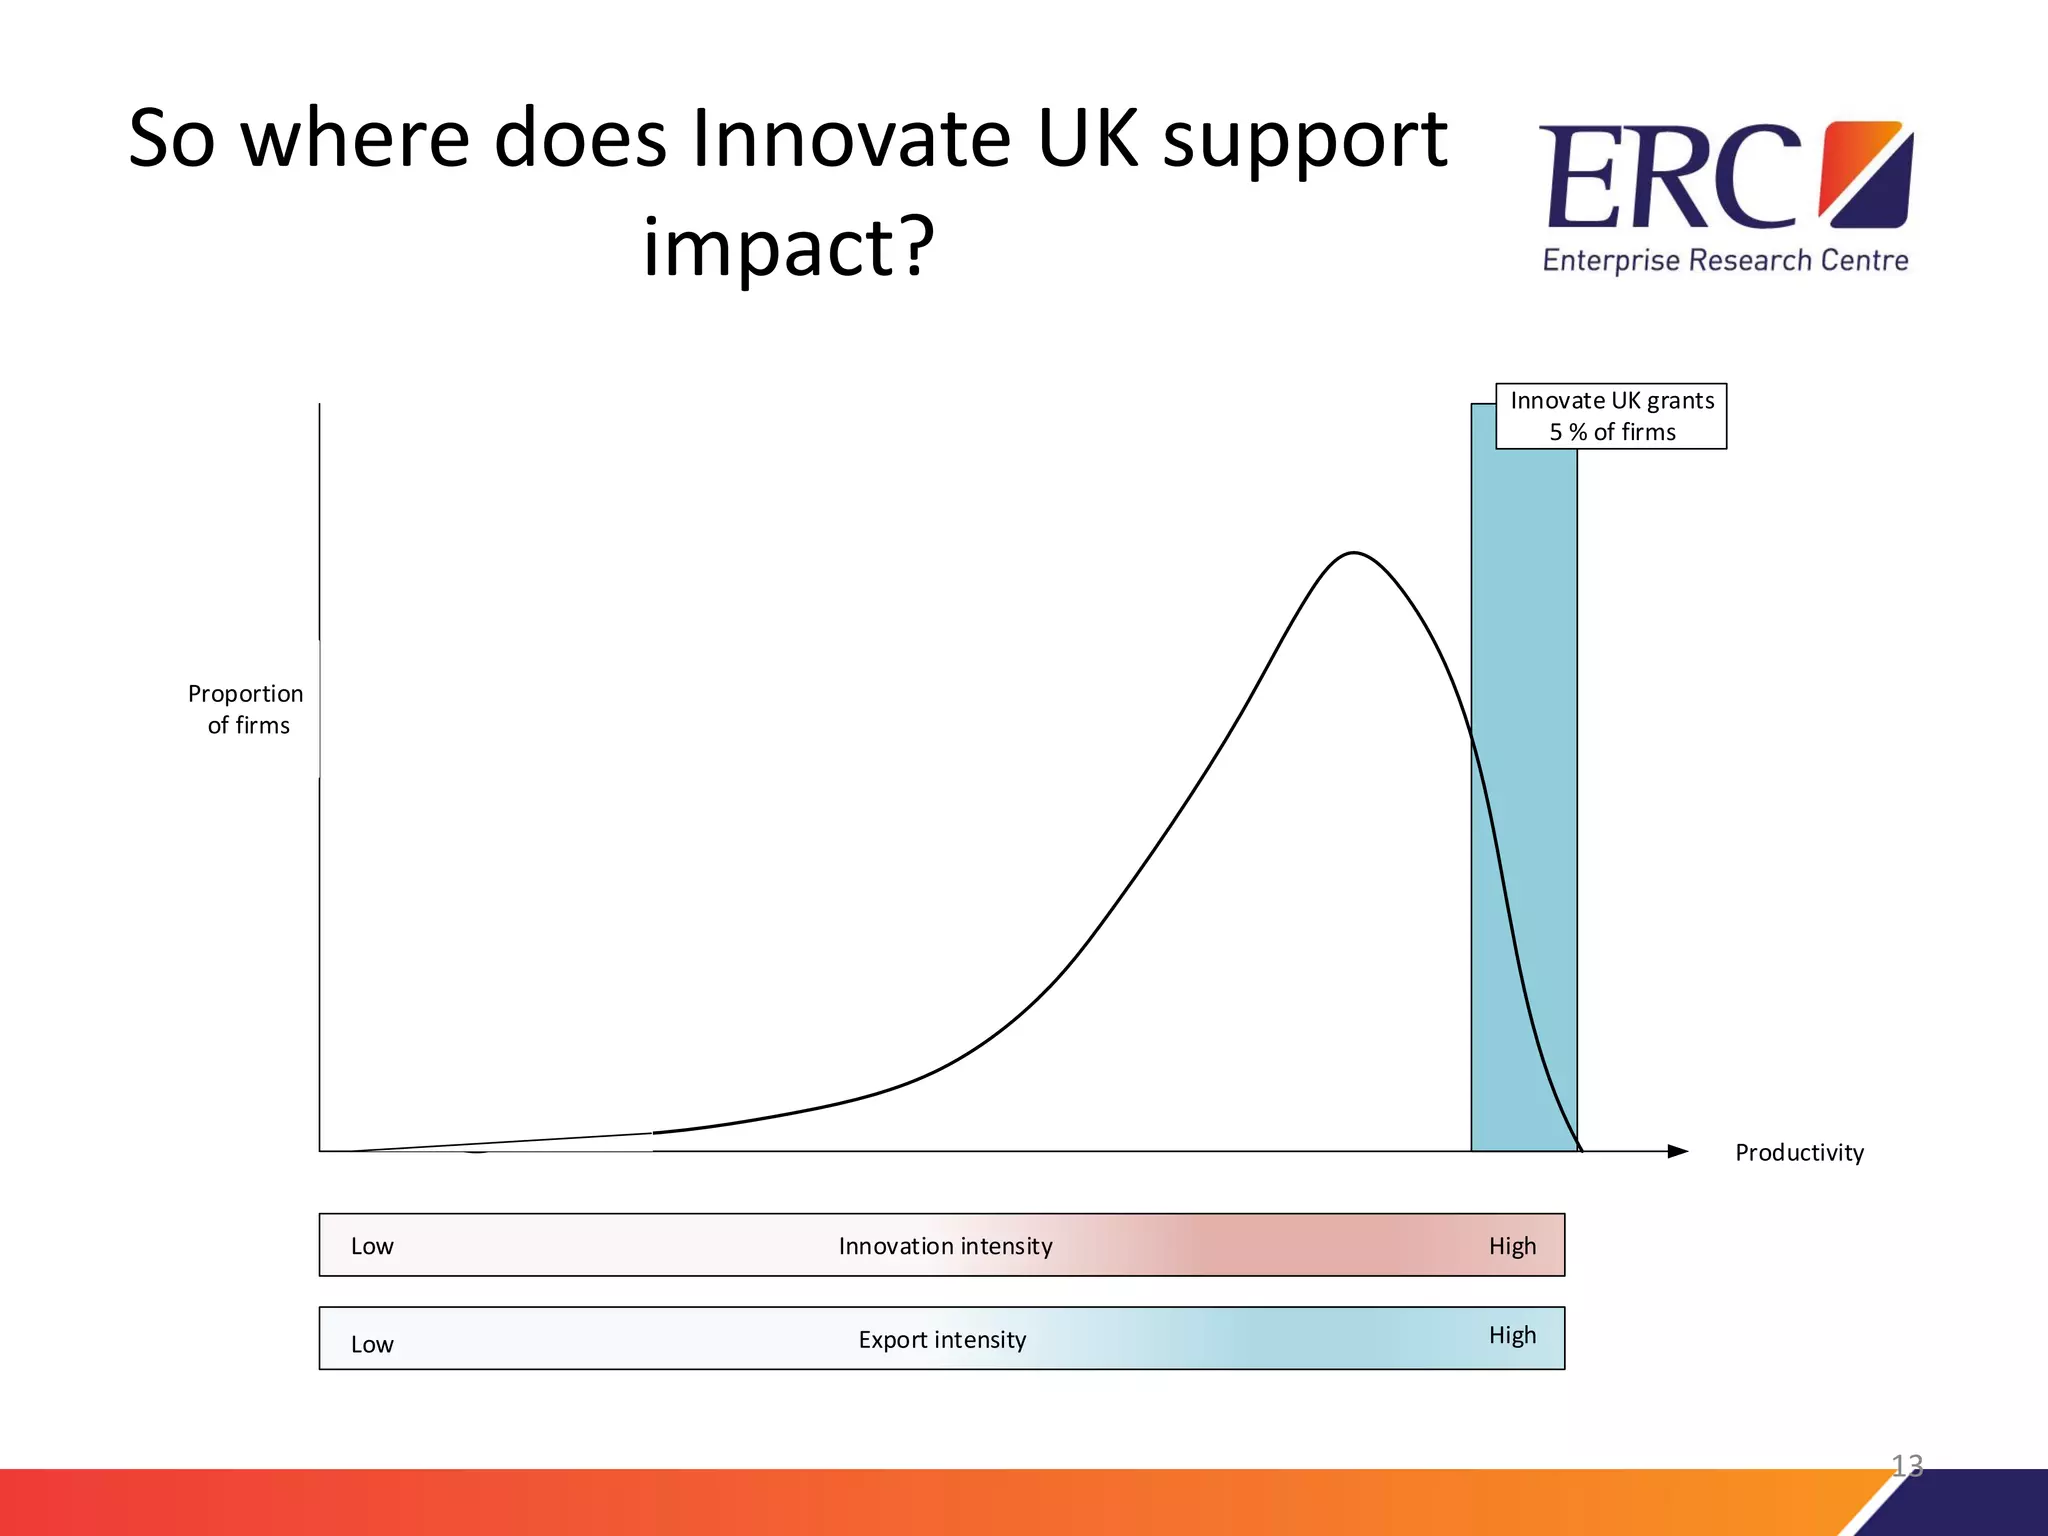
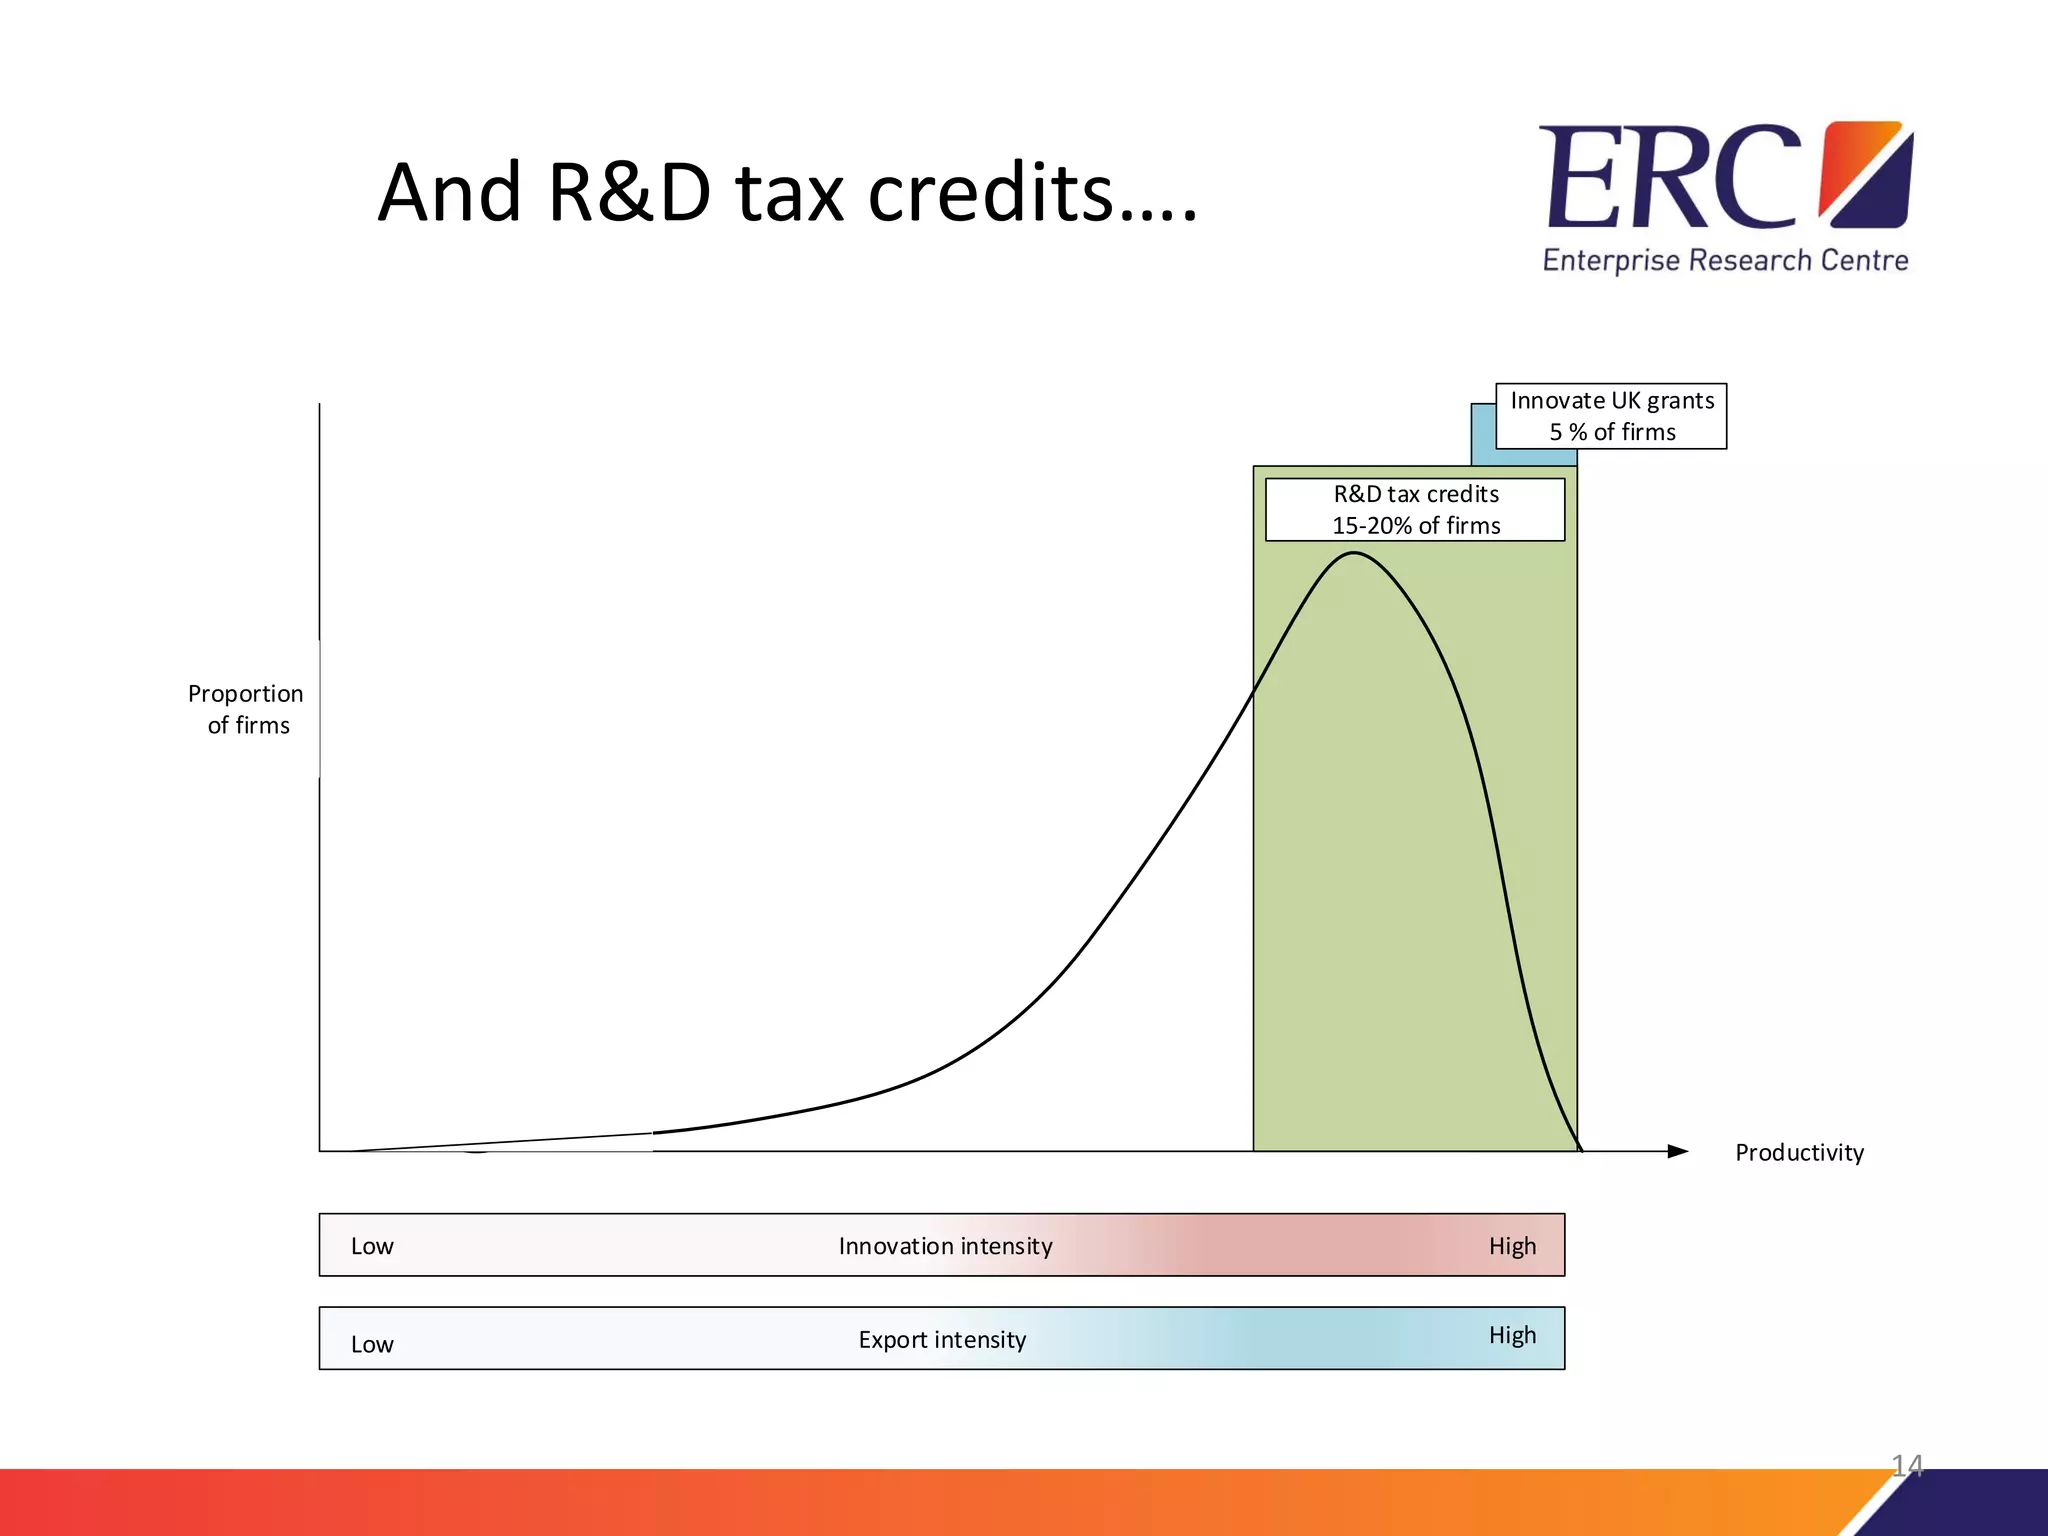
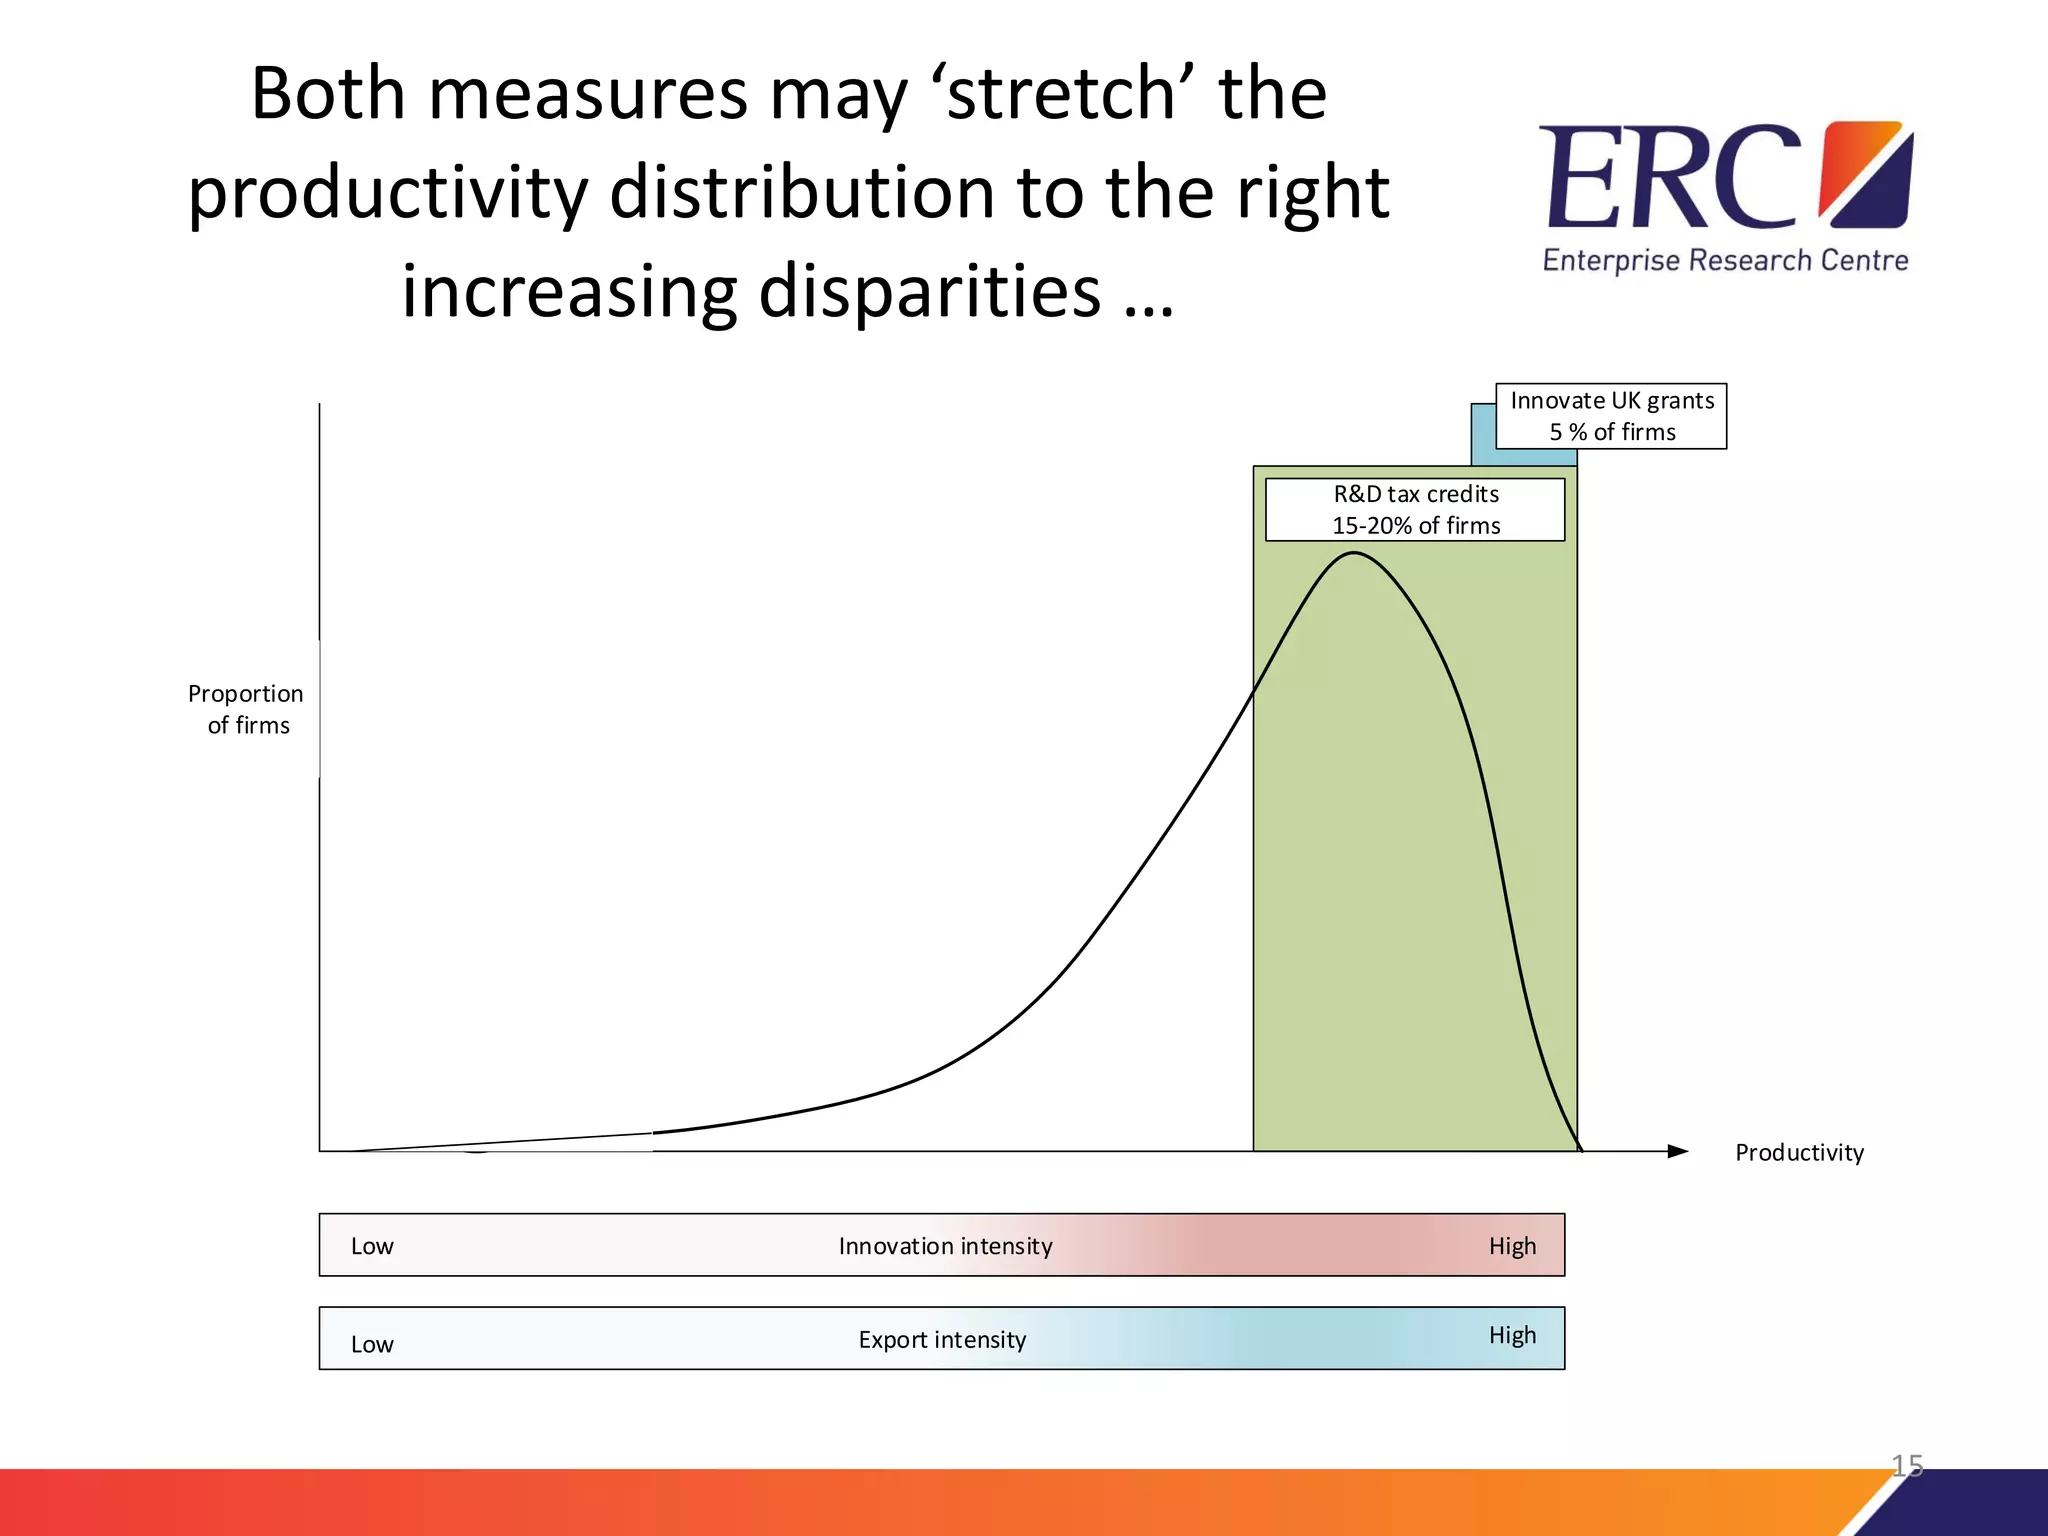
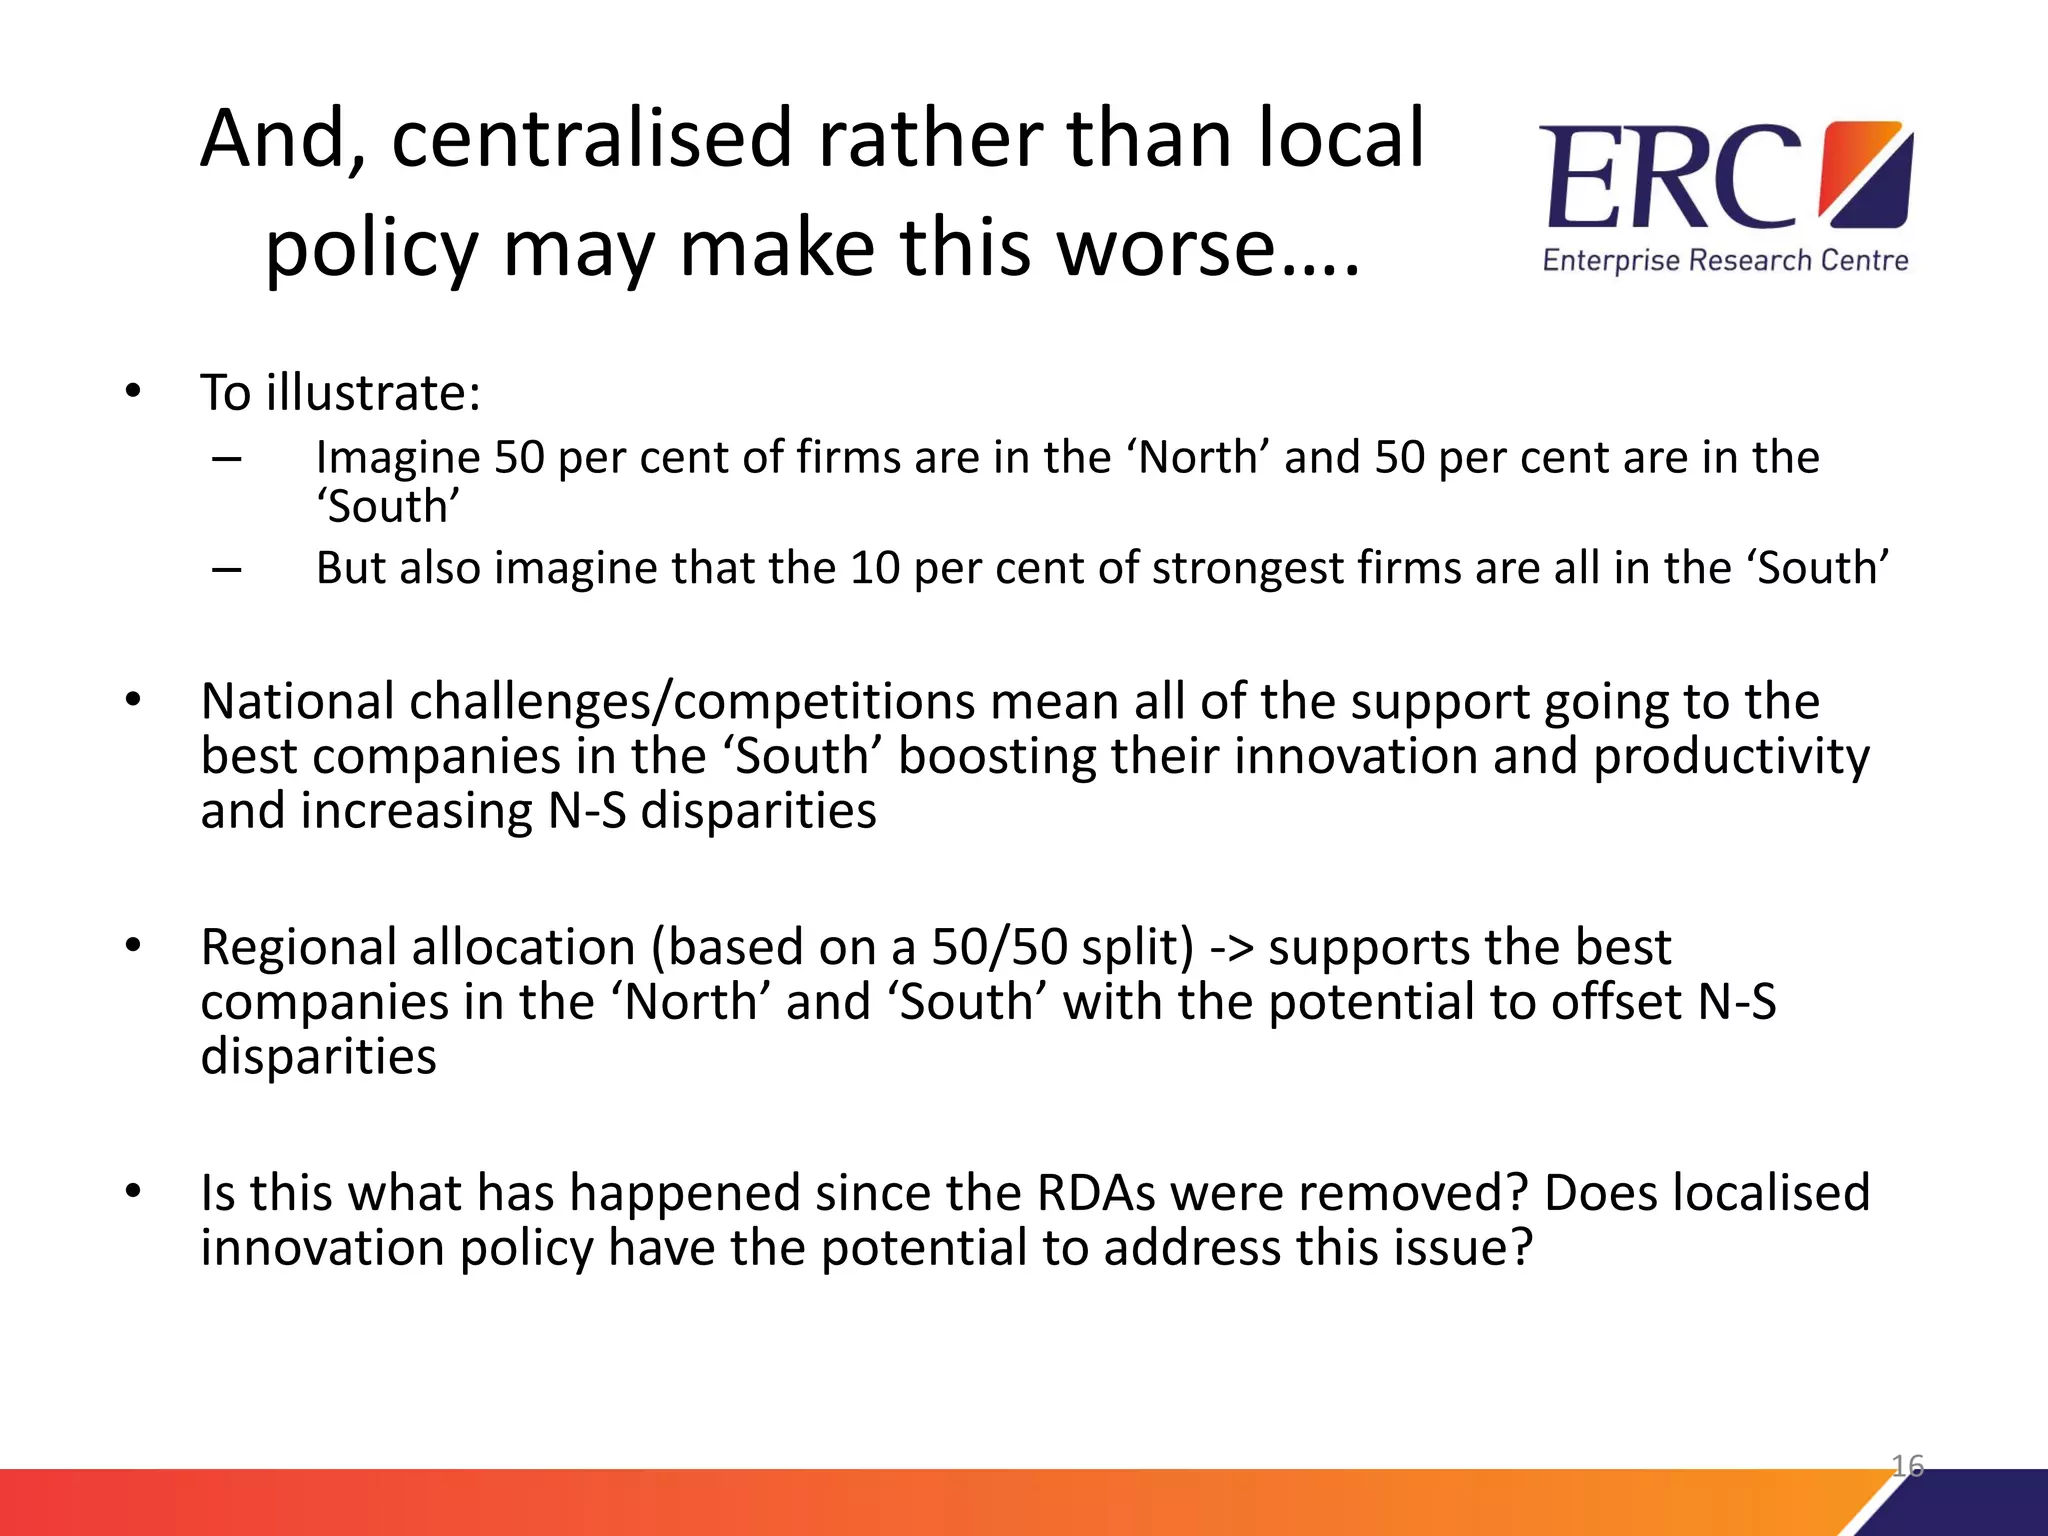

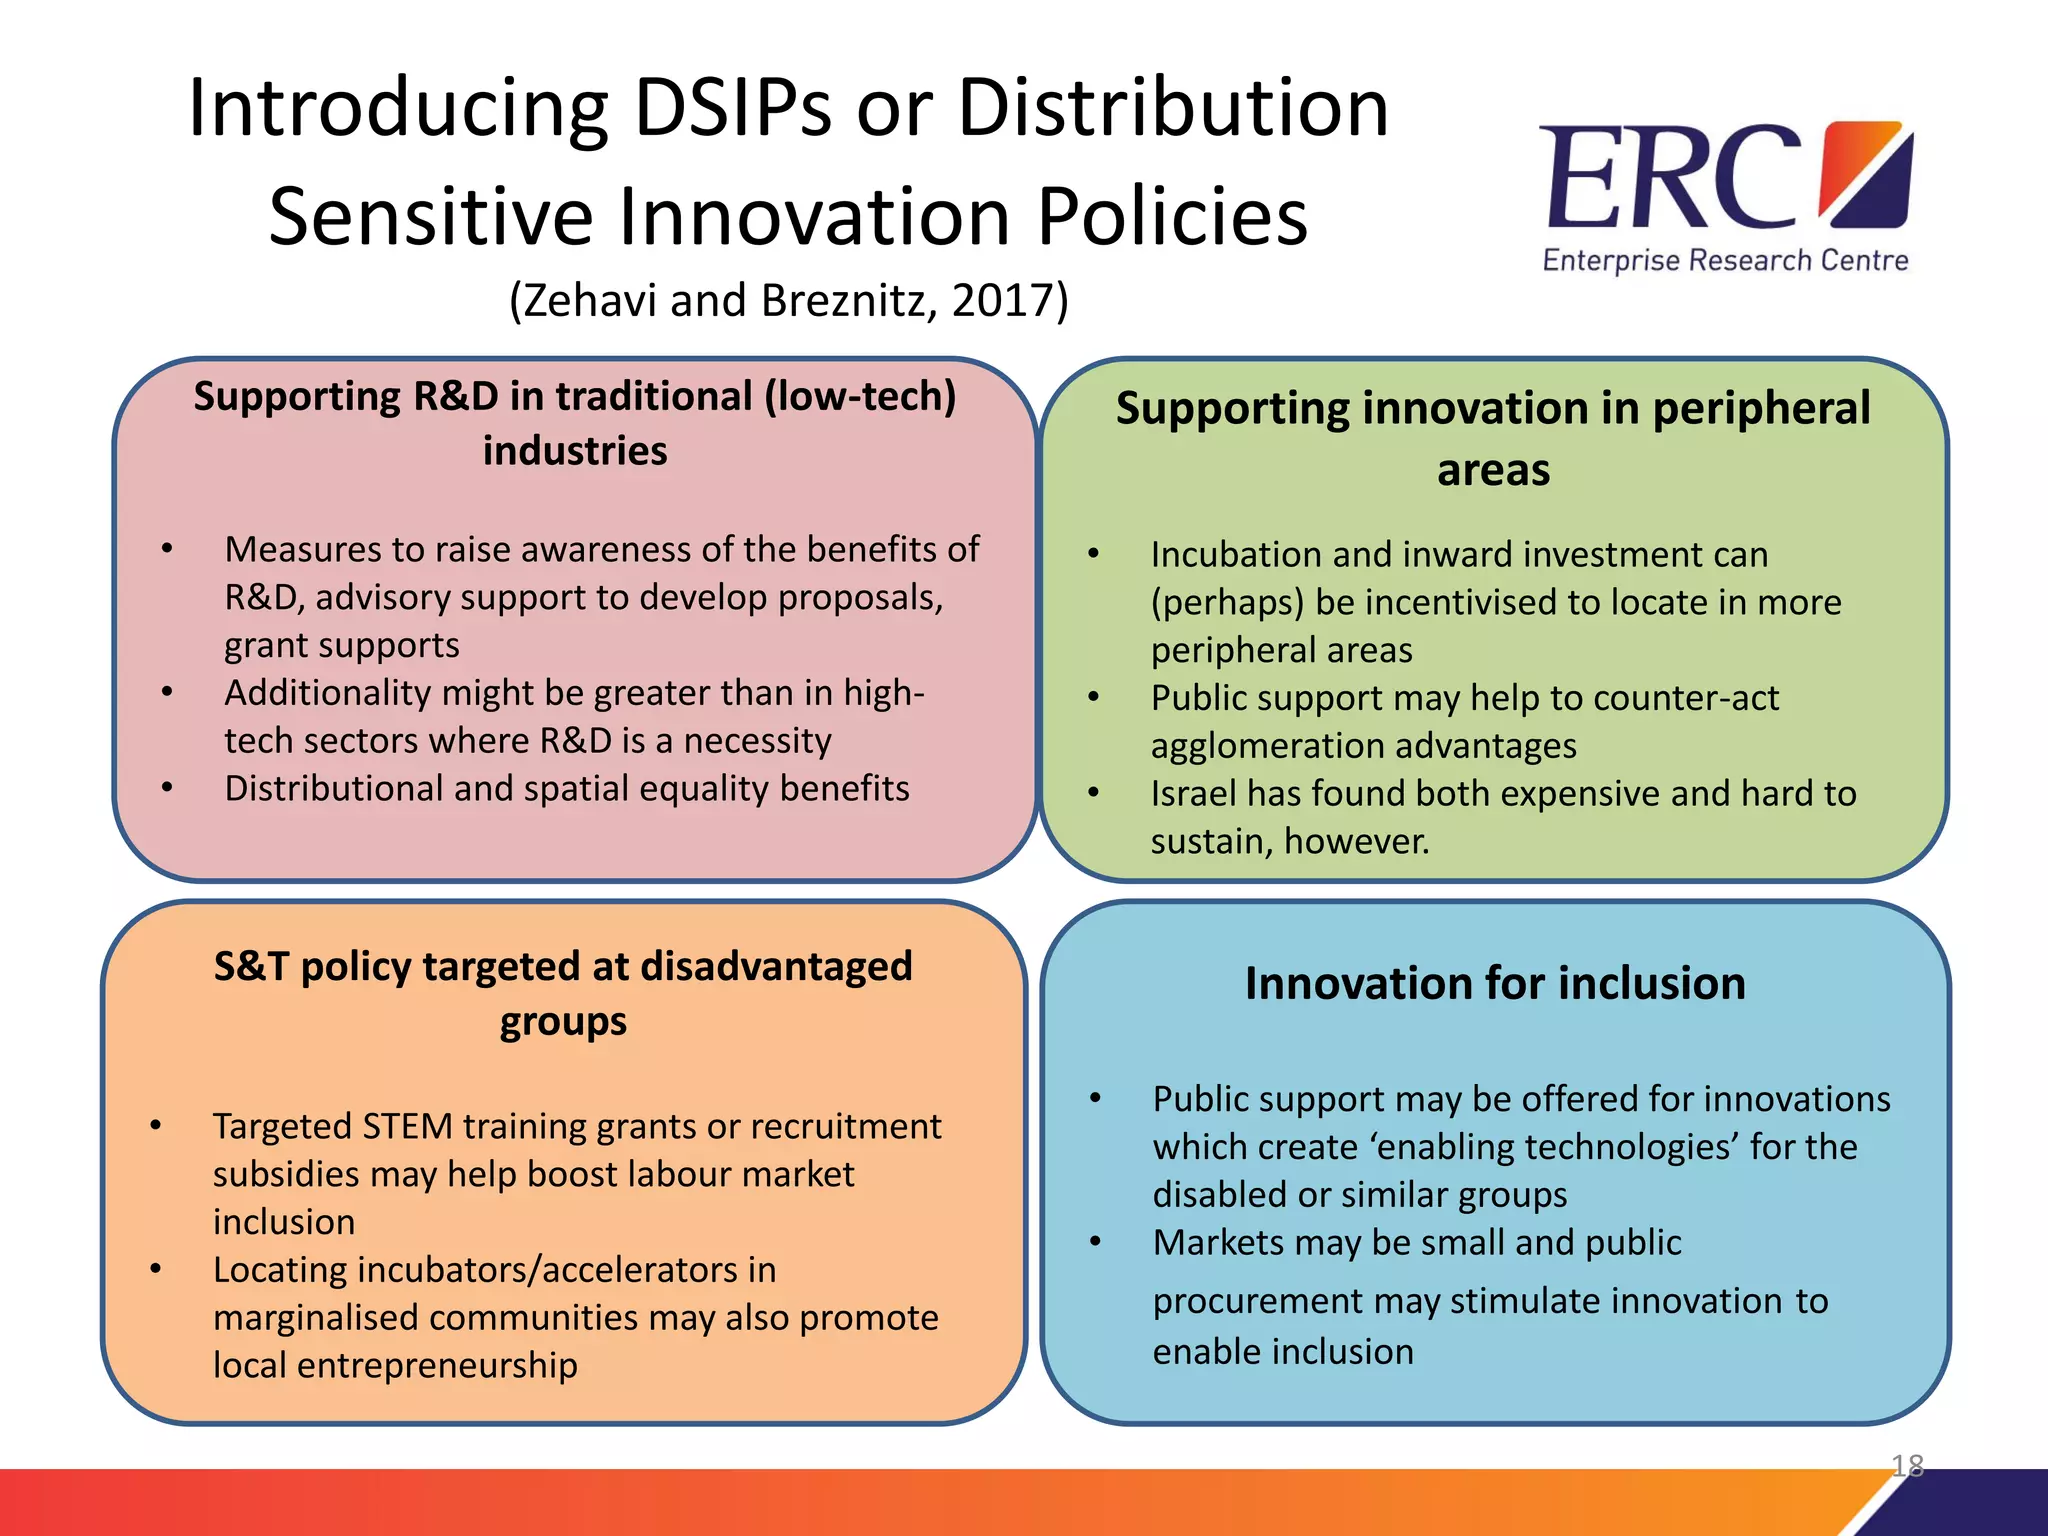


This document discusses inclusive innovation and the challenges of current innovation policy. It argues that innovation and productivity vary widely between industries, firm sizes, and localities, and these disparities seem to be growing. Current centralised innovation policy may be exacerbating these disparities by primarily supporting the most innovative firms. The document proposes introducing distribution sensitive innovation policies to promote innovation among less productive firms and sectors through measures like supporting R&D in traditional industries, innovation in peripheral areas, STEM training for disadvantaged groups, and technologies to promote inclusion. It also stresses the importance of knowledge diffusion and absorptive capacity.


