
Download as PDF, PPTX

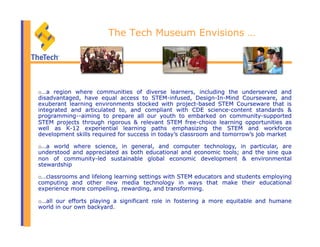
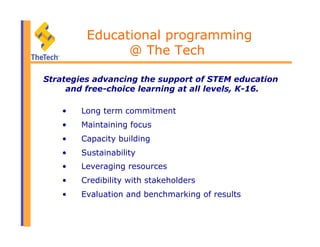
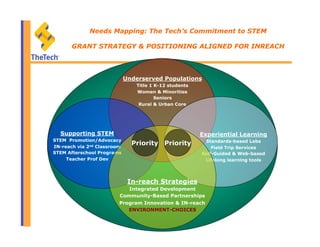
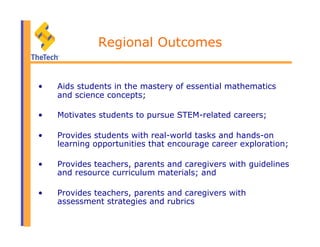
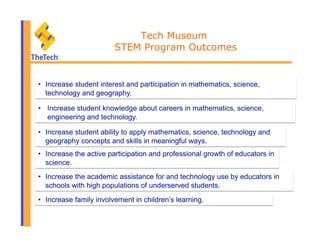


The document discusses the Tech Museum's strategy for grant and cooperative agreements from 2008-2012. It outlines the museum's mission to inspire learning about technologies through educational programming. The strategy focuses on supporting STEM education, with priorities around underserved populations like Title 1 K-12 students, women and minorities. It discusses developing community partnerships and innovative programs to increase engagement. Regional outcomes of the museum's STEM programs are listed as aiding student mastery of science concepts, motivating pursuit of STEM careers, and providing teachers with resources and assessment tools.


