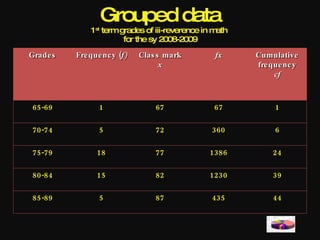
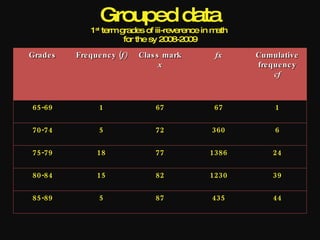
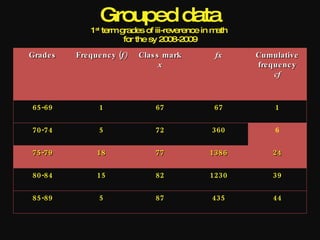
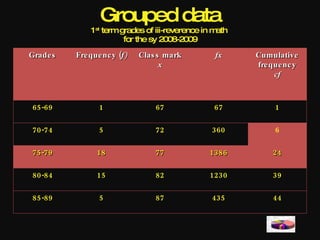
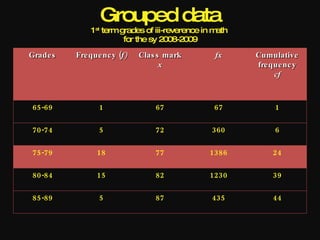
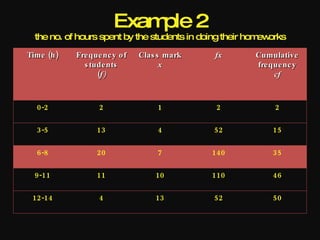
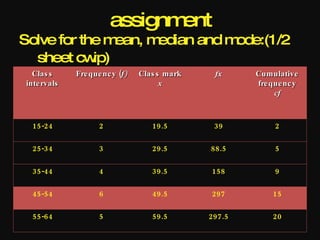
Ungrouped data
1 st term grades of iii-reverence in math
           for the sy 2008-2009
    Grade s                  Fre que nc y (f)
       68                           1
       73                           1
       74                           4
       75                           3
       76                           1
       77                           1
       78                           6
       79                           7
       80                           6
       81                           7
       82                           2
       86                           3
       89                           2
Grouped data
              1 st term grades of iii-reverence in math
                         for the sy 2008-2009
Grade s   Fre que nc y (f)   Clas s mark           fx     Cumulative
                                   x                      fre que nc y
                                                               cf


65-69            1               67               67           1

70-74            5               72               360          6

75-79           18               77              1386         24

80-84           15               82              1230         39

85-89            5               87               435         44
Presentation of data
Fo r g ro upe d data :
                   histogram
Presentation of data
Fo r g ro upe d data :
              Frequency polygon
Presentation of data
Fo r g ro upe d data :
                         ogive
Presentation of data
Fo r ung ro upe d data :
                  Line graph
Presentation of data
Fo r ung ro upe d data :
                   bar graph
Presentation of data
Fo r ung ro upe d data :
                   Pie chart
Presentation of data
Fo r ung ro upe d data :
                  pictograph
Grouped data

To s o lve fo r the me an
Divide the sum of the product of all the class
  m arks and frequency by the sum of all the
                  frequency.
Grouped data
In s ymbo ls :


                          x=
                             ∑ fx
                             ∑f
                            x                   ∑ fx
                  whe re is the me an ,         is the s um o f all the
  pro duc tf o f the fre que nc y and the c las s mark and        is the s um
         ∑
  o f all the fre que nc y .
Grouped data
              1 st term grades of iii-reverence in math
                         for the sy 2008-2009
Grade s   Fre que nc y (f)   Clas s mark           fx     Cumulative
                                   x                      fre que nc y
                                                               cf


65-69            1               67               67           1

70-74            5               72               360          6

75-79           18               77              1386         24

80-84           15               82              1230         39

85-89            5               87               435         44
Grouped data

To s o lve fo r the me dian
1. Locate the m  edian class (the interval that
  contains the m      iddle point of the
  observation). This is found through the
  cum ulative frequency colum  n.
Grouped data
              1 st term grades of iii-reverence in math
                         for the sy 2008-2009
Grade s   Fre que nc y (f)   Clas s mark           fx     Cumulative
                                   x                      fre que nc y
                                                               cf


65-69            1               67               67           1

70-74            5               72               360          6

75-79           18               77              1386         24

80-84           15               82              1230         39

85-89            5               87               435         44
Grouped data

To s o lve fo r the me dian
2. Identify the low class boundary of the
                    er
  m edian class, the cum ulative frequency of
  the interval before the m edian class and
  the class w idth.
Grouped data
              1 st term grades of iii-reverence in math
                         for the sy 2008-2009
Grade s   Fre que nc y (f)   Clas s mark           fx     Cumulative
                                   x                      fre que nc y
                                                               cf


65-69            1               67               67           1

70-74            5               72               360          6

75-79           18               77              1386         24

80-84           15               82              1230         39

85-89            5               87               435         44
Grouped data
In s ymbo ls :
                             ∑ f          
                            w
                              2    − cf b 
                                           
              median = Lm +               
                                 fm
                          L
             w whe re is m lo we r limit o f the me dian c las s , is
                               the
                                           ∑ the fre que nc y , is the
                                              f
  the c las s width ,     is the s um o f all
                   cf b
  c umulative fre que nc y o f the inte rval be fo re the me dian c las s
                                                          fm
  and        is the fre que nc y o f the me dian c las s .
Grouped data
              1 st term grades of iii-reverence in math
                         for the sy 2008-2009
Grade s   Fre que nc y (f)   Clas s mark           fx     Cumulative
                                   x                      fre que nc y
                                                               cf


65-69            1               67               67           1

70-74            5               72               360          6

75-79           18               77              1386         24

80-84           15               82              1230         39

85-89            5               87               435         44
Grouped data

To s o lve fo r the mo de
Sim identify the m
     ply          idpoint of the interval
  w the largest num of class
    ith             ber
  frequency.
Grouped data
              1 st term grades of iii-reverence in math
                         for the sy 2008-2009
Grade s   Fre que nc y (f)   Clas s mark           fx     Cumulative
                                   x                      fre que nc y
                                                               cf


65-69            1               67               67           1

70-74            5               72               360          6

75-79           18               77              1386         24

80-84           15               82              1230         39

85-89            5               87               435         44
Grouped data
              1 st term grades of iii-reverence in math
                         for the sy 2008-2009
Grade s   Fre que nc y (f)   Clas s mark           fx     Cumulative
                                   x                      fre que nc y
                                                               cf


65-69            1               67               67           1

70-74            5               72               360          6

75-79           18               77              1386         24

80-84           15               82              1230         39

85-89            5               87               435         44
Exam 2
                           ple
  the no. of hours spent by the students in doing their hom orks
                                                           ew

Time (h )   Fre que nc y o f   Clas s mark    fx        Cumulative
              s tude nts             x                  fre que nc y
                  (f)                                        cf


  0-2              2               1          2              2

  3-5             13               4          52            15

  6-8             20               7         140            35

  9-11            11               10        110            46

 12-14             4               13         52            50
synthesis

1. Recite the form for solving the m
                   ula               ean,
  m edian and m  ode.
2. Howcan w use this lesson in real life?
              e
3. discuss w ay/s on howyou can easily
  m orize the form for solving the
    em                ula
  m ean, m edian and m  ode?
assignment
Solve for the m ean, median and mode:(1/2
  sheet cw  ip)
   Clas s     Fre que nc y (f)   Clas s mark    fx     Cumulative
 inte rvals                            x               fre que nc y
                                                            cf


  15-24              2              19.5        39          2

  25-34              3              29.5       88.5         5

  35-44              4              39.5       158          9

  45-54              6              49.5       297         15

  55-64              5              59.5       297.5       20

Stat.Presentation Of Data Swine Flu

  • 4.
    Ungrouped data 1 stterm grades of iii-reverence in math for the sy 2008-2009 Grade s Fre que nc y (f) 68 1 73 1 74 4 75 3 76 1 77 1 78 6 79 7 80 6 81 7 82 2 86 3 89 2
  • 5.
    Grouped data 1 st term grades of iii-reverence in math for the sy 2008-2009 Grade s Fre que nc y (f) Clas s mark fx Cumulative x fre que nc y cf 65-69 1 67 67 1 70-74 5 72 360 6 75-79 18 77 1386 24 80-84 15 82 1230 39 85-89 5 87 435 44
  • 6.
    Presentation of data For g ro upe d data : histogram
  • 7.
    Presentation of data For g ro upe d data : Frequency polygon
  • 8.
    Presentation of data For g ro upe d data : ogive
  • 9.
    Presentation of data For ung ro upe d data : Line graph
  • 10.
    Presentation of data For ung ro upe d data : bar graph
  • 11.
    Presentation of data For ung ro upe d data : Pie chart
  • 12.
    Presentation of data For ung ro upe d data : pictograph
  • 13.
    Grouped data To so lve fo r the me an Divide the sum of the product of all the class m arks and frequency by the sum of all the frequency.
  • 14.
    Grouped data In symbo ls : x= ∑ fx ∑f x ∑ fx whe re is the me an , is the s um o f all the pro duc tf o f the fre que nc y and the c las s mark and is the s um ∑ o f all the fre que nc y .
  • 15.
    Grouped data 1 st term grades of iii-reverence in math for the sy 2008-2009 Grade s Fre que nc y (f) Clas s mark fx Cumulative x fre que nc y cf 65-69 1 67 67 1 70-74 5 72 360 6 75-79 18 77 1386 24 80-84 15 82 1230 39 85-89 5 87 435 44
  • 16.
    Grouped data To so lve fo r the me dian 1. Locate the m edian class (the interval that contains the m iddle point of the observation). This is found through the cum ulative frequency colum n.
  • 17.
    Grouped data 1 st term grades of iii-reverence in math for the sy 2008-2009 Grade s Fre que nc y (f) Clas s mark fx Cumulative x fre que nc y cf 65-69 1 67 67 1 70-74 5 72 360 6 75-79 18 77 1386 24 80-84 15 82 1230 39 85-89 5 87 435 44
  • 18.
    Grouped data 1 st term grades of iii-reverence in math for the sy 2008-2009 Grade s Fre que nc y (f) Clas s mark fx Cumulative x fre que nc y cf 65-69 1 67 67 1 70-74 5 72 360 6 75-79 18 77 1386 24 80-84 15 82 1230 39 85-89 5 87 435 44
  • 19.
    Grouped data To so lve fo r the me dian 2. Identify the low class boundary of the er m edian class, the cum ulative frequency of the interval before the m edian class and the class w idth.
  • 20.
    Grouped data 1 st term grades of iii-reverence in math for the sy 2008-2009 Grade s Fre que nc y (f) Clas s mark fx Cumulative x fre que nc y cf 65-69 1 67 67 1 70-74 5 72 360 6 75-79 18 77 1386 24 80-84 15 82 1230 39 85-89 5 87 435 44
  • 21.
    Grouped data In symbo ls : ∑ f  w  2 − cf b   median = Lm +   fm L w whe re is m lo we r limit o f the me dian c las s , is the ∑ the fre que nc y , is the f the c las s width , is the s um o f all cf b c umulative fre que nc y o f the inte rval be fo re the me dian c las s fm and is the fre que nc y o f the me dian c las s .
  • 22.
    Grouped data 1 st term grades of iii-reverence in math for the sy 2008-2009 Grade s Fre que nc y (f) Clas s mark fx Cumulative x fre que nc y cf 65-69 1 67 67 1 70-74 5 72 360 6 75-79 18 77 1386 24 80-84 15 82 1230 39 85-89 5 87 435 44
  • 23.
    Grouped data To so lve fo r the mo de Sim identify the m ply idpoint of the interval w the largest num of class ith ber frequency.
  • 24.
    Grouped data 1 st term grades of iii-reverence in math for the sy 2008-2009 Grade s Fre que nc y (f) Clas s mark fx Cumulative x fre que nc y cf 65-69 1 67 67 1 70-74 5 72 360 6 75-79 18 77 1386 24 80-84 15 82 1230 39 85-89 5 87 435 44
  • 25.
    Grouped data 1 st term grades of iii-reverence in math for the sy 2008-2009 Grade s Fre que nc y (f) Clas s mark fx Cumulative x fre que nc y cf 65-69 1 67 67 1 70-74 5 72 360 6 75-79 18 77 1386 24 80-84 15 82 1230 39 85-89 5 87 435 44
  • 26.
    Exam 2 ple the no. of hours spent by the students in doing their hom orks ew Time (h ) Fre que nc y o f Clas s mark fx Cumulative s tude nts x fre que nc y (f) cf 0-2 2 1 2 2 3-5 13 4 52 15 6-8 20 7 140 35 9-11 11 10 110 46 12-14 4 13 52 50
  • 27.
    synthesis 1. Recite theform for solving the m ula ean, m edian and m ode. 2. Howcan w use this lesson in real life? e 3. discuss w ay/s on howyou can easily m orize the form for solving the em ula m ean, m edian and m ode?
  • 28.
    assignment Solve for them ean, median and mode:(1/2 sheet cw ip) Clas s Fre que nc y (f) Clas s mark fx Cumulative inte rvals x fre que nc y cf 15-24 2 19.5 39 2 25-34 3 29.5 88.5 5 35-44 4 39.5 158 9 45-54 6 49.5 297 15 55-64 5 59.5 297.5 20